

Abstract
This study quantifies health outcome disparities in invasive Methicillin-Resistant Staphylococcus aureus (MRSA) infections by leveraging a novel artificial intelligence (AI) fairness algorithm, the Fairness-Aware Causal paThs (FACTS) decomposition, and applying it to real-world electronic health record (EHR) data. We spatiotemporally linked 9 years of EHRs from a large healthcare provider in Florida, USA, with contextual social determinants of health (SDoH). We first created a causal structure graph connecting SDoH with individual clinical measurements before/upon diagnosis of invasive MRSA infection, treatments, side effects, and outcomes; then, we applied FACTS to quantify outcome potential disparities of different causal pathways including SDoH, clinical and demographic variables. We found moderate disparity with respect to demographics and SDoH, and all the top ranked pathways that led to outcome disparities in age, gender, race, and income, included comorbidity. Prior kidney impairment, vancomycin use, and timing were associated with racial disparity, while income, rurality, and available healthcare facilities contributed to gender disparity. From an intervention standpoint, our results highlight the necessity of devising policies that consider both clinical factors and SDoH. In conclusion, this work demonstrates a practical utility of fairness AI methods in public health settings.
Keywords: AI fairness, Methicillin-resistant Staphylococcus aureus, Health outcome disparity
1. Introduction
Invasive Methicillin-Resistant Staphylococcus aureus (MRSA) infections pose a significant public health concern. According to the Centers for Disease Control and Prevention (CDC), MRSA infections account for a substantial proportion of healthcare-associated infections, affecting both inpatient and outpatient settings1. These infections, characterized by resistance to all beta-lactam antibiotics, have been associated with increased morbidity, mortality, and healthcare costs.
It is widely recognized that socioeconomic and demographic factors influence transmission and care outcomes of infectious diseases, including MRSA. For example, See et al. (2017) shed light on the complex interplay between race, socioeconomic factors, and MRSA infections2. Gualandi et al. (2018) analyzed surveillance data in the USA from nine US states (20+ million people) and found that the risk of MRSA infection in African Americans was double the risk in other racial/ethnic groups, even when rates were decreasing3. Nonetheless, Mohnasky et al. (2021) found that in a prospective cohort of individuals seen in a single, large US medical center for over 20 years, social disparity in MRSA outcomes was explained by differences in comorbidities between racial/ethnic groups4. Thus, contrasts among studies could be explained by population selection and modeling choices. Many studies on quantification of health outcome disparity within invasive MRSA infections have been associational in nature, and further research is necessary to deconstruct and understand the underlying causal mechanisms driving such disparity in order to identify potential avenues for intervention. Such advancement can help develop effective strategies to mitigate the impact of the disease which target not only the majority of the population, but also specific subpopulations that might be more vulnerable, e.g., the elderly or ethnic/racial minorities.
To address the aforementioned challenges, we employ a recently developed artificial intelligence (AI) fairness algorithm, the Fairness-Aware Causal paThs (FACTS) decomposition5. FACTS is able to decompose disparity of an outcome measure with respect to a variable of interest into multiple causal pathways, and to quantify the relative contribution of each path. We apply FACTS on large real world electronic health record (EHR) data collated over 9 years from a large healthcare provider in Florida, USA, linked with contextual social determinants of health (SDoH).
2. Materials and Methods
2.1. Ethics Statement
This study obtained approval from the Institutional Review Board (#IRB201900652) of the University of Florida (UF). The authors strictly adhere to the research integrity and ethical principles outlined in the Declaration of Helsinki.
2.2. Data Source
We analyzed deidentified EHR data from the UF Health’s Integrated Data Repository (IDR, https://idr.ufhealth.org/), which includes two primary hospitals in Gainesville and Jacksonville, and several other outpatient clinics in Florida. The IDR-EHR data includes patients’ demographics, residence (here masked into 3-digit zip codes), laboratory tests (encoded with Logical Observation Identifiers Names and Codes, LOINC), drug prescriptions (RxNorm terminology), clinical procedures and diagnoses (International Classification of Disease, ICD 9th and 10th revision). In this study all ICD-10 codes were converted to ICD-9 format following General Equivalence Mappings guideline of Centers for Medicare & Medicaid Services6 since the sample predominantly consisted of ICD-9 codes. Data requests can be directed to IDR (https://idr.ufhealth.org/research-services/) in compliance with institutional, state and US Federal policies; authors are willing to share study procedures for reproducing results.
We linked individual patient records to the county-level social determinants of health (SDoH) variables using multiple external sources. SDoH variables used in this work were: Median Household Income7; Rurality (urban or rural based on the Federal Bureau of Investigation metropolitan criteria)8; Health Insurance Coverage (proportion of residents of uninsured populations)9, and Access to Healthcare Facilities (proximity and availability of healthcare facilities such as hospitals, clinics, and primary care providers in the area; number of hospital beds per 100,000 population)10.
2.3. Study Design, Study Population, Variables
We included adults aged 18 years and older at the time of diagnosis of invasive MRSA (ICD-9-CM: 041.11) at UF Health between January 1, 2011, and July 1, 2019. To ensure comprehensive medical information availability, patients without complete sociodemographic information and without a prior medical record from at least one year before their first invasive MRSA diagnosis were excluded. Excluding these patients mitigated potential bias arising from missing comprehensive past medical information. To follow up comprehensive antibiotic treatment, we defined three time points for each patient’s antibiotic treatment. Time 1 was defined as the empiric treatment stage which the patient will receive without any test results confirmed when they got infected. Time 2 was defined as the time when their initial antibiotic susceptibility testing was revealed, and Time 3 was 7 days from time 2 (reflecting patient’s latest clinical progression). A detailed clinical justification of the choice of the three time points is given in a prior work 11. Individuals who were missing antibiotic treatment history for those three time points were dropped from the study. Fig. 1 provides an overview of the inclusion criteria cascade.
Fig. 1.

Flowchart of Study Population
The study’s index/baseline date was set corresponding to the first invasive MRSA diagnosis, and the outcome was 30-day mortality. The patients’ variables at index date included age, gender (male vs. female), race (African American vs. White), Charlson’s comorbidity index (CCI), history of antibiotic usage, prior history of kidney impairment, types of infection (i.e., bloodstream infection or not), severity of infection (i.e., transfer to intensive care unit, ICU, or not), and the SDoH panel. Additional variables upon admission included the treatment course (i.e., whether they received vancomycin or not at each time point), and side effects (i.e., nephrotoxicity developed after the initial treatment).
2.4. Causal Assumptions and FACTS
Using literature search and authors’ consensus, we created a partially directed acyclic graph (pDAG) connecting SDoH with individual clinical measurements before/upon diagnosis of invasive MRSA infection, treatments, side effects, and outcomes. Double-edged arrows might represent unmeasured confounding between two variables (e.g., income and rurality).
Each arrow in the pDAG is supported by at least one finding from our literature search. Race was associated with previous vancomycin use12,13, types of infection14, severity of infection14, prior kidney impairment15, prior drug resistance2,16, income17, and chronic comorbidities18–23. Income and health insurance were linked24,25. Sex was associated with health insurance26, income27, and chronic comorbidities28–30. Income and rurality were linked31. Rurality was also associated with access to healthcare facilities32, and healthcare facilities were associated with chronic comorbidities33–35. Age was associated with health insurance coverage25 and chronic comorbidities21,36,37. Previous vancomycin use was associated with prior drug resistance38 and vancomycin at Time 139,40. Type of infection41, severity of infection40,41, chronic comorbidities39, and prior drug resistance39 were also associated with vancomycin at Time 1. Vancomycin at T1 was associated with vancomycin at Time 2, and vancomycin at Time 2 was associated with vancomycin at Time 342. Chronic comorbidities and prior kidney impairment were associated with nephrotoxicity which developed after Time 143. Vancomycin at Time 2 and Vancomycin at Time 3 were also linked with nephrotoxicity which developed after Time 143–45. Vancomycin at Time 3 was associated with mortality46.
The final pDAG is provided in Fig. 2. We selected race, income, gender, and age as exposure variables. The pDAG was used to calculate an adjustment set to identify the effect of the exposures with respect to MRSA outcome, quantifying the potential disparity in terms of odds ratios using a main-effects logistic regression. After this analysis, we applied the FACTS on our pDAG using the same exposures5. In detail, FACTS builds a prediction model of the outcome using all variables (through the XGBoost algorithm), then uses a given pDAG and a ‘sensitive’ attribute of interest (i.e., exposure, like gender or race) to calculate the contribution to outcome disparity for all paths involving such sensitive attribute. Finally, it ranks and outputs the most important paths.
Fig. 2.

Partially directed acyclic graph representing the causal relationships among clinical, sociodemographic variables, and MRSA 30-day mortality (race is displayed as the exposure variable).
2.5. Software
We conducted our analyses in R (https://www.r-project.org/), using the libraries ‘tidyverse’47 and ‘data.table’48 for data preprocessing, ‘comorbidity’49 for calculating Charlson’s comorbidity index (CCI), and ‘tidycensus’50 for extracting the US Census Bureau’s data APIs. The DAG and the adjustment sets were done with dagitty (https://www.dagitty.net/). For the FACTS analysis, we applied Python based on the code available at: https://github.com/weishenpan15/FACTS.
3. Results
3.1. Characteristics of the Study Population
We identified 1,433 individuals admitted to the hospital and diagnosed with an invasive MRSA infection between 2011 and 2019, based on the bio/tissue-sample source and the culture test (i.e., blood, fluid, bone, and other internal body site). After matching with socio-demographic information based on the three digits zip-code information of each patient, and after filtering based on all inclusion criteria as described in the methods, a total of 395 patients constituted the final study sample (Fig. 1).
Table 1 describes the baseline characteristics of the sample. Patients were 55.2 years old on average. The percentage of females was 50.1%, and 39.0% of the population was African American. In terms of county-level SDoH, the average number of healthcare facilities was 189, 50.9% of individuals lived in urban areas, the median household income was $48,300, and 21.8% was the prevalence of being uninsured. The mean Charlson’s comorbidity index was 6.40. The prevalence of patients who were administered vancomycin before this invasive MRSA infection was 68.6%, and for 35.9% of patients, there was record of multiple drug resistance (MDR). Eighty percent of patients had a bloodstream infection, and 52.2% of patients were transferred to the ICU. The percentages of vancomycin usage at each time point were 97%, 79%, and 66.1% respectively. While being treated, 10.1% of patients developed nephrotoxicity, and 53.4% had prior history of kidney impairment.
Table 1.
Variable Characteristics of the Study Population (N=395)
| Variables | Measure; Mean (SD), Median [Min, Max] or N (%) |
|---|---|
| Individual-level EHR variables | |
| Age | 55.2 (16.4), 56 [19, 96] |
| Age – 65+ years old | 121 (30.6%) |
| Gender – Female | 198 (50.1%) |
| Race – African American | 154 (39.0%) |
| Charlson’s comorbidity index (CCI) | 6.40 (3.92), 6 [0,20] |
| History of antibiotic usage (Vancomycin) | 271 (68.6%) |
| Prior history of kidney impairment | 211 (53.4%) |
| Types of Infection - Bloodstream | 316 (80.0%) |
| Severity of Infection – ICU stay | 206 (52.2%) |
| Prior Drug Resistance | 142 (35.9%) |
| Nephrotoxicity developed | 40 (10.1%) |
| Vancomycin use at Time1 | 383 (97.0%) |
| Vancomycin use at Time2 | 312 (79.0%) |
| Vancomycin use at Time3 | 261 (66.1%) |
| County-level sociodemographic variables | |
| Number of Healthcare Facilities (number of beds/100,000) | 189 (30.3), 192 [107, 367] |
| Area – Urban | 201 (50.9%) |
| Median household Income | $48,300 (7,900), $44,700 [$39,500, $67,400] |
| Insurance coverage (% of Uninsured) | 21.8 (4.17), 21.9 [13.8, 35.7] |
In Fig. 3, we described the annual trend of the number of patients with invasive MRSA infection in our study sample. Additionally, we depicted the number of bacterial infection patients registered in our EHR system and the population of two Florida counties where large hospitals of the UF Health Network are situated (i.e., Alachua county and Duval county). The combined population of both counties exhibited an increasing trend over the years, while the number of invasive MRSA cases fluctuated annually. For the invasive MRSA cases, the data only covers half of 2019, from January to July.
Fig. 3.
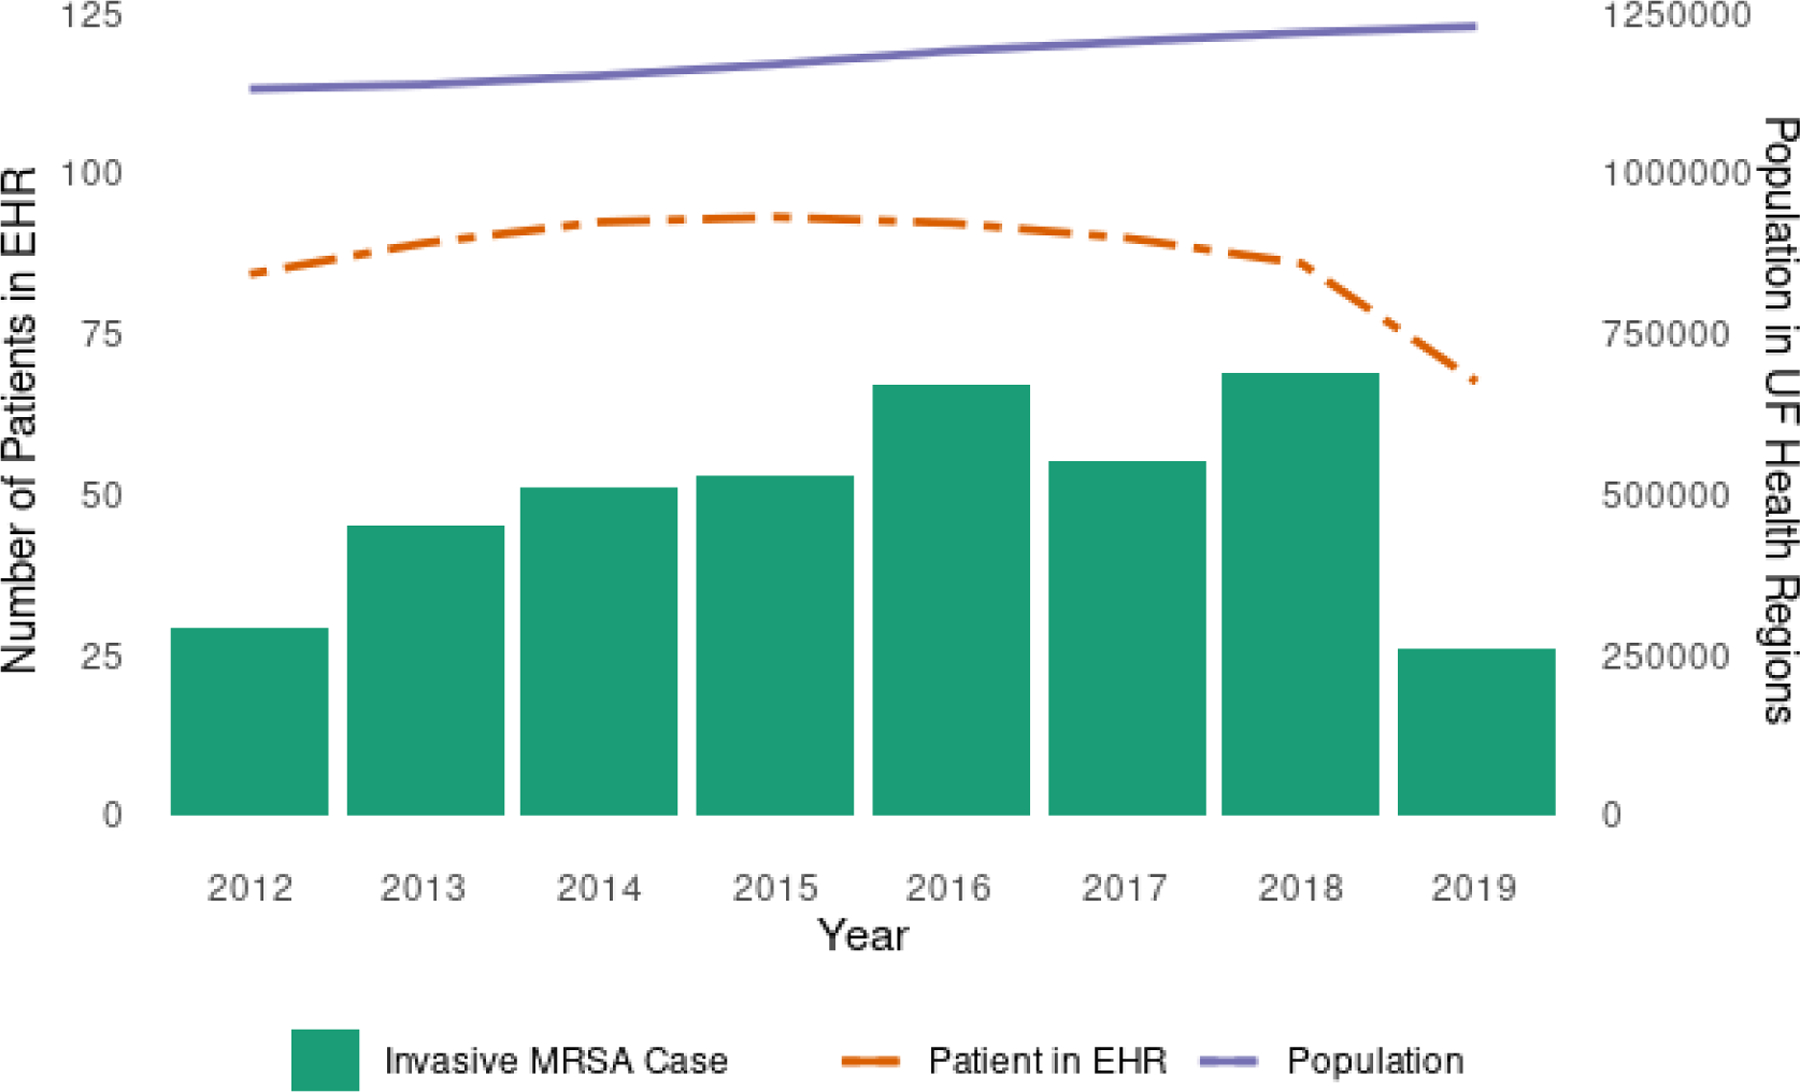
Annual trends in invasive MRSA cases, EHR patients, and local population
3.2. Quantification of Health Outcome Disparity
We estimated the total and direct effects of age, race, income, and gender on the 30-day mortality outcome. For each of the exposure variables, we report the odds ratios (OR) and 95% confidence intervals (CI) obtained by fitting a logistic regression model with the adjustment set variables identified through the pDAG (Table 2). Income showed the strongest association with outcome disparity (total effect OR 0.44, 95% CI 0.17–0.99), followed by age, gender, and race. All effect estimates, except that of income, included OR=1 in the 95%CI.
Table 2.
Total and direct effects of age, race, income, and gender on to risk of 30-day mortality in invasive MRSA Infection.
| Sensitive Variable | Model | Odds Ratio (95% CI) |
|---|---|---|
| Age (65+ years old =1 vs. younger=0) | Outcome ~ Age | 2.11 (0.98, 4.48) |
| Outcome ~ Age + Chronic Comorbidity + Previous Vancomycin Use + Prior Drug Resistance + Severity of Infection + Types of Infection | 1.64 (0.74, 3.60) | |
| Race (African American=1 vs. White=0) | Outcome ~ Race | 0.77 (0.34, 1.65) |
| Outcome ~ Race + Types of Infection + Severity of Infection + Previous Vancomycin Use + Prior Drug Resistance + Chronic Comorbidity | 0.58 (0.24, 1.30) | |
| Income (Below median=1 vs. Upper=0) | Outcome ~ Income | 0.44 (0.17, 0.99) |
| Outcome ~ Income + Chronic Comorbidity + Race + Rurality + Gender | 0.74 (0.24, 2.14) | |
| Gender (Female=1 vs. Male=1) | Outcome ~ Gender | 1.15 (0.54, 2.45) |
| Outcome ~ Gender + Chronic Comorbidity + Previous Vancomycin Use + Prior Drug Resistance + Severity of Infection + Types of Infection | 1.24 (0.57,2.72) |
We then ran the FACTS algorithm on the same set of exposures (Table 3). Of note, FACTS needs all binary variables, so we split the numeric variables based on their median. Overall, all paths showed absolute low weights, close to zero, for both accuracy and disparity metrics. Results did not change when including only clinical variables or clinical and SDoH variables in the pDAG and associated paths. There were no relevant paths detected for income. Comorbidity was detected as a disparity path for age, race, and gender. Antibiotic use, timing, and renal toxicity were relevant with respect to race, while income, rurality and number of healthcare facilities were relevant for gender disparity.
Table 3.
FACTS decomposition of disparity in 30-day mortality from invasive MRSA infection, with respect to age, race, income, and gender
| Sensitive Variable | Clinical-only | Clinical + SDoH | ||||
|---|---|---|---|---|---|---|
|
| ||||||
| Disparity Path | Disparity | Accuracy | Disparity Path | Disparity | Accuracy | |
| Age | Comorbidity | −0.01162 | 0.00840 | - | - | - |
|
| ||||||
| Race | Comorbidity | −0.05714 | 0.03361 | Comorbidity | −0.05428 | 0.02857 |
| Prior Kidney Impairment | 0.02571 | −0.01512 | Prior Vancomycin Use | −0.01142 | −0.00672 | |
| Nephrotoxici ty developed after Time 1 ↔Vancomyc in use at Time 2 ↔ Vancomycin use at Time 3 | 0.01428 | −0.00840 | Prior Kidney Impairment | 0.00857 | −0.00504 | |
|
| ||||||
| Income | - | - | - | - | - | - |
|
| ||||||
| Gender | Comorbidity | −0.05084 | 0.02521 | Insurance | −0.05101 | 0.02857 |
| - | - | - | Income→ Rurality | 0.01333 | −0.00672 | |
| - | - | - | Income→ Rurality → Facility | 0.00265 | 0.02857 | |
4. Discussion
We deconstructed sociodemographic disparity in 30-day mortality among invasive MRSA infections, using EHR data and fairness AI methods. Upon explicit expert-derived causal assumptions, we found moderates to strong effects of age, gender, race, and income on mortality, although the 95% CIs included no difference in risk among groups. Our fairness analysis, conducted using the FACTS algorithm, revealed that comorbidity status was the most significant contributor to outcome disparity across age, race, and gender, while no distinct paths could be found for income. For race, antibiotic usage, timing, and prior kidney impairment contributed to disparity, while SDoH contributed to outcome disparity among genders. Age and income are well-known risk factors for mortality, and confirming their effects was clearly expected. Prior kidney impairment, identified through pre-infection creatinine levels, could contribute to the observed differences in invasive MRSA mortality rates between racial groups. Kidney impairment significantly influences the clinical management of MRSA infections in hospitals. Beyond its effect on the immune response, renal impairment also complicates the choice and dosage of anti-MRSA antibiotics that can be safely administered. For instance, vancomycin, the most commonly used antibiotic agent for treating these infections and a known iatrogenic cause of acute kidney injury, necessitates close monitoring and dosage adjustments based on renal function42. Further, while creatinine levels served as an indicator of renal function in our analysis, clinical teams during the study period were likely assessing for renal impairment using creatinine-based equations that vary by race, e.g., estimated glomerular filtration rate (eGFR), and changing accordingly the medical management of the patient. As a result, use of eGFR in clinical practice could have confounded the disparity paths that we decomposed51. Compared to other studies, our findings are consistent with recent literature that analyzed individuals diagnosed with S. aureus bacteremia, reporting no differences in mortality between racial groups4,52. However, it has to be noted that study populations are heterogeneous and demographic groups exhibit strong differences in risk factors. We found that variations in mortality rates are partially attributable to the burden of underlying comorbidities, therapeutic choices, and SDoH that differ among ages, incomes, genders, and races. Of note, our results align with another recent analysis of EHR in Florida that quantified the effect of demographics and SDoH on outcome disparity in urinary tract infections (UTIs), where comorbidity, number of healthcare facilities, income and insurance were also found to be involved in disparity paths with respect to race.11
The decision to use FACTS for this study was driven by the algorithm’s emphasis on causal pathways which account for both directed and undirected arrows between variables in partially directed acyclic graphs (pDAGs). While statistical-based algorithms focus on assessing whether all groups have the same metric for outcomes, causal-based fairness is more concerned with analyzing the presence of causal effects of a sensitive attribute on outcomes, including path-specific fairness.53 Although studies exist that focus on path-specific effects 54–57, the FACTS algorithm introduced a novel approach. The algorithm concentrates not only on causal paths but also on uncovering overlooked sources of disparity that may contribute to model disparity. The capability of the FACTS algorithm to consider undirected relationships among risk factors in pDAGs is pivotal, especially when relationships are unclear. Therefore, public health researchers could benefit directly from using advanced algorithm (i.e., FACTS) by quantifying the unknown weights of factors to the model disparity.
Our study has several limitations. Firstly, our causal assumptions may be incorrect, and we did not account for unmeasured confounders in our models. Despite researcher’s best efforts to define a DAG, it remains a challenge in real-life situations to accurately represent all variable relationships. This brings up concerns of incorrect assumptions and the potential for reverse causality. However, both FACTS and the generalized adjustment criterion can work with partial DAGs, which can mitigate some of these issues. Another recommended approach is to estimate effects using multiple DAGs, each incorporating different assumptions. Secondly, due to our strict inclusion criteria, only one third of patients who potentially had an invasive MRSA infection were included, which likely introduced selection bias (i.e., exclusion bias). Exclusion bias arises when particular members of a population are excluded from a study due to criteria set by researchers. The patients who were not included in our study constituted about two-thirds of the patients with invasive MRSA; these patients were mainly excluded due to a lack of sequential antibiotic prescription records. The excluded patients might have exhibited different disparity pathways if sufficient information had been available to conduct such disparity analyses. However, by starting from what is available to us, discovered pathways by FACTS could provide initial inferences about the invasive MRSA population. These inferences could be further refined as principles for secondary data collection become more standardized in research and therefore minimizing missing information. Therefore, despite the constraint of not encompassing every patient in our EHR, our study can still offer valuable and profound insights. We aimed to identify diverse causal pathways of disparity and by meticulously delineating our cohort definition in this preliminary analysis. This approach was intended to curtail information bias and mitigate the impact of missing data. By sharing our method transparently, we seek to contribute meaningful insights, informed by a clear and comprehensive understanding of the available data, that can elucidate the disparity pathways prevalent in the broader invasive MRSA population. Thirdly, given the sample size and observed effect sizes, type II errors were also likely. Fourthly, the current release of the FACTS algorithm is capable of handling only binary variables; it is anticipated that future versions of the algorithm will expand its capabilities.
5. Conclusion
In conclusion, this work demonstrates the practical utility of fairness AI methods in public health settings. The FACTS framework can be useful to explore intervention strategies for optimizing health outcomes among different sociodemographic groups using actionable variables in the causal pathways, e.g., reducing rates of comorbidities in vulnerable populations, and equalizing SDoH. For future studies, it is paramount to relax the population selection constraints, and to explore multiple different causal assumptions to reduce residual bias.
Acknowledgments
Work partially supported by grant NIH NIAID 1R01AI141810; NIH NIA R33AG062884;
References
- 1.. Centers for Disease Control and Prevention (U.S.). Antibiotic Resistance Threats in the United States, 2019 Centers for Disease Control and Prevention (U.S.); 2019. doi: 10.15620/cdc:82532 [DOI] [Google Scholar]
- 2.See I, Wesson P, Gualandi N, et al. Socioeconomic Factors Explain Racial Disparities in Invasive Community-Associated Methicillin-Resistant Staphylococcus aureus Disease Rates. Clin Infect Dis 2017;64(5):597–604. doi: 10.1093/cid/ciw808 [DOI] [PMC free article] [PubMed] [Google Scholar]
- 3.Gualandi N, Mu Y, Bamberg WM, et al. Racial Disparities in Invasive Methicillin-resistant Staphylococcus aureus Infections, 2005–2014. Clin Infect Dis 2018;67(8):1175–1181. doi: 10.1093/cid/ciy277 [DOI] [PMC free article] [PubMed] [Google Scholar]
- 4.Mohnasky MC, Park L, Eichenberger E, et al. 1373. Racial Disparities in Clinical Characteristics and Outcomes for Methicillin Susceptible and Methicillin-Resistant Staphylococcus aureus Bacteremia. Open Forum Infectious Diseases 2021;8(Supplement_1):S773. doi: 10.1093/ofid/ofab466.1565 [DOI] [Google Scholar]
- 5.Pan W, Cui S, Bian J, Zhang C, Wang F. Explaining Algorithmic Fairness Through Fairness-Aware Causal Path Decomposition Proceedings of the 27th ACM SIGKDD Conference on Knowledge Discovery & Data Mining. Published online 2021. [Google Scholar]
- 6.ICD-9-CM to and from ICD-10-CM and ICD-10-PCS Crosswalk or General Equivalence Mappings NBER. Accessed July 31, 2023. https://www.nber.org/research/data/icd-9-cm-and-icd-10-cm-and-icd-10-pcs-crosswalk-or-general-equivalence-mappings [Google Scholar]
- 7.<au>Bureau UC>. American Community Survey Data Census.gov. Accessed October 21, 2022. https://www.census.gov/programs-surveys/acs/data.html [Google Scholar]
- 8.Florida FBI. Accessed July 29, 2023. https://ucr.fbi.gov/crime-in-the-u.s/2018/crime-in-the-u.s.−2018/tables/table-10/table-10-state-cuts/florida.xls [Google Scholar]
- 9.How Healthy is your County? | County Health Rankings. County Health Rankings & Roadmaps Accessed January 18, 2023. https://www.countyhealthrankings.org/county-health-rankings-roadmaps
- 10.Hospital Beds - Florida Health CHARTS - Florida Department of Health Accessed October 21, 2022. https://www.flhealthcharts.gov/ChartsReports/rdPage.aspx?rdReport=NonVitalIndNoGrp.Dataviewer&cid=0313
- 11.Jun I, Cohen SA, Ser SE, et al. Optimizing Dynamic Antibiotic Treatment Strategies against Invasive Methicillin-Resistant Staphylococcus Aureus Infections using Causal Survival Forests and G-Formula on Statewide Electronic Health Record Data In: Le T, Li J, Ness R, et al., eds. Proceedings of The KDD’23 Workshop on Causal Discovery, Prediction and Decision. Vol 218. Proceedings of Machine Learning Research. PMLR; 2023:98–115. https://proceedings.mlr.press/v218/inyoung23a.html [PMC free article] [PubMed] [Google Scholar]
- 12.Olesen SW, Grad YH. Racial/Ethnic Disparities in Antimicrobial Drug Use, United States, 2014–2015. Emerg Infect Dis 2018;24(11):2126–2128. doi: 10.3201/eid2411.180762 [DOI] [PMC free article] [PubMed] [Google Scholar]
- 13.Young EH, Strey KA, Lee GC, et al. National Disparities in Antibiotic Prescribing by Race, Ethnicity, Age Group, and Sex in United States Ambulatory Care Visits, 2009 to 2016. Antibiotics 2023;12(1). doi: 10.3390/antibiotics12010051 [DOI] [PMC free article] [PubMed] [Google Scholar]
- 14.Rybak MJ, Zasowski EJ, Jorgensen SCJ, et al. Risk Factors for Bloodstream Infections Among an Urban Population with Skin and Soft Tissue Infections: A Retrospective Unmatched Case-Control Study. Infect Dis Ther 2019;8(1):75–85. doi: 10.1007/s40121-018-0227-9 [DOI] [PMC free article] [PubMed] [Google Scholar]
- 15.Eneanya ND, Boulware LE, Tsai J, et al. Health inequities and the inappropriate use of race in nephrology. Nature Reviews Nephrology 2022;18(2):84–94. doi: 10.1038/s41581-021-00501-8 [DOI] [PMC free article] [PubMed] [Google Scholar]
- 16.Denoble A, Reid HW, Krischak M, et al. Bad bugs: antibiotic-resistant bacteriuria in pregnancy and risk of pyelonephritis. Am J Obstet Gynecol MFM 2022;4(2):100540. doi: 10.1016/j.ajogmf.2021.100540 [DOI] [PMC free article] [PubMed] [Google Scholar]
- 17.Racial disparities in income and poverty remain largely unchanged amid strong income growth in 2019 Economic Policy Institute. Accessed August 1, 2023. https://www.epi.org/blog/racial-disparities-in-income-and-poverty-remain-largely-unchanged-amid-strong-income-growth-in-2019/ [Google Scholar]
- 18.Cancer Disparities - Cancer Stat Facts. SEER Accessed January 22, 2023. https://seer.cancer.gov/statfacts/html/.html
- 19.Cancer Disparities - NCI Published August 4, 2016. Accessed January 22, 2023. https://www.cancer.gov/about-cancer/understanding/disparities
- 20.Cheng YJ, Kanaya AM, Araneta MRG, et al. Prevalence of Diabetes by Race and Ethnicity in the United States, 2011–2016. JAMA 2019;322(24):2389–2398. doi: 10.1001/jama.2019.19365 [DOI] [PMC free article] [PubMed] [Google Scholar]
- 21.Deshpande AD, Harris-Hayes M, Schootman M. Epidemiology of diabetes and diabetes-related complications. Phys Ther 2008;88(11):1254–1264. doi: 10.2522/ptj.20080020 [DOI] [PMC free article] [PubMed] [Google Scholar]
- 22.Ward E, Jemal A, Cokkinides V, et al. Cancer disparities by race/ethnicity and socioeconomic status. CA Cancer J Clin 2004;54(2):78–93. doi: 10.3322/canjclin.54.2.78 [DOI] [PubMed] [Google Scholar]
- 23.Zavala VA, Bracci PM, Carethers JM, et al. Cancer health disparities in racial/ethnic minorities in the United States. Br J Cancer 2021;124(2):315–332. doi: 10.1038/s41416-020-01038-6 [DOI] [PMC free article] [PubMed] [Google Scholar]
- 24.Lee DC, Liang H, Shi L. The convergence of racial and income disparities in health insurance coverage in the United States. International Journal for Equity in Health 2021;20(1):96. doi: 10.1186/s12939-021-01436-z [DOI] [PMC free article] [PubMed] [Google Scholar]
- 25.Keisler-Starkey K, Bunch LN. Health Insurance Coverage in the United States: 2020. [Google Scholar]
- 26.Dec 21 P, 2022. Women’s Health Insurance Coverage KFF. Published December 21, 2022. Accessed January 23, 2023. https://www.kff.org/womens-health-policy/fact-sheet/womens-health-insurance-coverage/ [Google Scholar]
- 27.Barroso A, Brown A. Gender pay gap in U.S. held steady in 2020 Pew Research Center. Accessed January 22, 2023. https://www.pewresearch.org/fact-tank/2021/05/25/gender-pay-gap-facts/ [Google Scholar]
- 28.O’Neil A, Scovelle AJ, Milner AJ, Kavanagh A. Gender/Sex as a Social Determinant of Cardiovascular Risk. Circulation 2018;137(8):854–864. doi: 10.1161/CIRCULATIONAHA.117.028595 [DOI] [PubMed] [Google Scholar]
- 29.Mosca L, Barrett-Connor E, Wenger NK. Sex/gender differences in cardiovascular disease prevention: what a difference a decade makes. Circulation 2011;124(19):2145–2154. doi: 10.1161/CIRCULATIONAHA.110.968792 [DOI] [PMC free article] [PubMed] [Google Scholar]
- 30.Ntritsos G, Franek J, Belbasis L, et al. Gender-specific estimates of COPD prevalence: a systematic review and meta-analysis. Int J Chron Obstruct Pulmon Dis 2018;13:1507–1514. doi: 10.2147/COPD.S146390 [DOI] [PMC free article] [PubMed] [Google Scholar]
- 31.Data show U.S. poverty rates in 2019 higher in rural areas than in urban for racial/ethnic groups Accessed January 22, 2023. http://www.ers.usda.gov/data-products/chart-gallery/gallery/chart-detail/?chartId=101903
- 32.Johnston KJ, Wen H, Kotwal A, Joynt Maddox KE. Comparing Preventable Acute Care Use of Rural Versus Urban Americans: an Observational Study of National Rates During 2008–2017. J Gen Intern Med 2021;36(12):3728–3736. doi: 10.1007/s11606-020-06532-4 [DOI] [PMC free article] [PubMed] [Google Scholar]
- 33.Siminoff LA. Access and equity to cancer care in the USA: a review and assessment. Postgraduate Medical Journal 2005;81(961):674–679. doi: 10.1136/pgmj.2005.032813 [DOI] [PMC free article] [PubMed] [Google Scholar]
- 34.Yee AM, Mazumder PK, Dong F, Neeki MM. Impact of Healthcare Access Disparities on Initial Diagnosis of Breast Cancer in the Emergency Department. Cureus 2020;12(8):e10027. doi: 10.7759/cureus.10027 [DOI] [PMC free article] [PubMed] [Google Scholar]
- 35.Mannoh I, Hussien M, Commodore-Mensah Y, Michos ED. Impact of social determinants of health on cardiovascular disease prevention. Curr Opin Cardiol 2021;36(5):572–579. doi: 10.1097/HCO.0000000000000893 [DOI] [PubMed] [Google Scholar]
- 36.Forouhi NG, Wareham NJ. Epidemiology of diabetes. Medicine (Abingdon) 2014;42(12):698–702. doi: 10.1016/j.mpmed.2014.09.007 [DOI] [PMC free article] [PubMed] [Google Scholar]
- 37.Risk Factors: Age - NCI Published April 29, 2015. Accessed January 22, 2023. https://www.cancer.gov/about-cancer/causes-prevention/risk/age
- 38.Amberpet R, Sistla S, Parija SC, Thabah MM. Screening for Intestinal Colonization with Vancomycin Resistant Enterococci and Associated Risk Factors among Patients Admitted to an Adult Intensive Care Unit of a Large Teaching Hospital. J Clin Diagn Res 2016;10(9):DC06–DC09. doi: 10.7860/JCDR/2016/20562.8418 [DOI] [PMC free article] [PubMed] [Google Scholar]
- 39.Leekha S, Terrell CL, Edson RS. General Principles of Antimicrobial Therapy. Mayo Clin Proc 2011;86(2):156–167. doi: 10.4065/mcp.2010.0639 [DOI] [PMC free article] [PubMed] [Google Scholar]
- 40.Karam G, Chastre J, Wilcox MH, Vincent JL. Antibiotic strategies in the era of multidrug resistance. Critical Care 2016;20(1):136. doi: 10.1186/s13054-016-1320-7 [DOI] [PMC free article] [PubMed] [Google Scholar]
- 41.VanEperen AS, Segreti J. Empirical therapy in Methicillin-resistant Staphylococcus Aureus infections: An Up-To-Date approach. J Infect Chemother 2016;22(6):351–359. doi: 10.1016/j.jiac.2016.02.012 [DOI] [PubMed] [Google Scholar]
- 42.Jeffres MN. The Whole Price of Vancomycin: Toxicities, Troughs, and Time. Drugs 2017;77(11):1143–1154. doi: 10.1007/s40265-017-0764-7 [DOI] [PMC free article] [PubMed] [Google Scholar]
- 43.Filippone E, Kraft W, Farber J. The Nephrotoxicity of Vancomycin. Clin Pharmacol Ther 2017;102(3):459–469. doi: 10.1002/cpt.726 [DOI] [PMC free article] [PubMed] [Google Scholar]
- 44.Liu J, Tong SYC, Davis JS, Rhodes NJ, Scheetz MH, CAMERA2 Study Group. Vancomycin Exposure and Acute Kidney Injury Outcome: A Snapshot From the CAMERA2 Study. Open Forum Infectious Diseases 2020;7(12):ofaa538. doi: 10.1093/ofid/ofaa538 [DOI] [PMC free article] [PubMed] [Google Scholar]
- 45.Sawada A, Kawanishi K, Morikawa S, et al. Biopsy-proven vancomycin-induced acute kidney injury: a case report and literature review. BMC Nephrol 2018;19:72. doi: 10.1186/s12882-018-0845-1 [DOI] [PMC free article] [PubMed] [Google Scholar]
- 46.Schweizer ML, Richardson K, Vaughan Sarrazin MS, et al. Comparative Effectiveness of Switching to Daptomycin Versus Remaining on Vancomycin Among Patients With Methicillin-resistant Staphylococcus aureus (MRSA) Bloodstream Infections. Clinical Infectious Diseases 2021;72(Supplement_1):S68–S73. doi: 10.1093/cid/ciaa1572 [DOI] [PMC free article] [PubMed] [Google Scholar]
- 47.Wickham H, Averick M, Bryan J, et al. Welcome to the Tidyverse. Journal of Open Source Software 2019;4(43):1686. doi: 10.21105/joss.01686 [DOI] [Google Scholar]
- 48.Dowle M, Srinivasan A. Data.Table: Extension of `data.Framè; 2023. [Google Scholar]
- 49.Gasparini A comorbidity: An R package for computing comorbidity scores. Journal of Open Source Software 2018;3(23):648. doi: 10.21105/joss.00648 [DOI] [Google Scholar]
- 50.Walker K, Herman M. Tidycensus: Load US Census Boundary and Attribute Data as “tidyverse” and ‘Sf’-Ready Data Frames; 2023. https://walker-data.com/tidycensus/ [Google Scholar]
- 51.Williams WW, Hogan JW, Ingelfinger JR. Time to Eliminate Health Care Disparities in the Estimation of Kidney Function. New England Journal of Medicine 2021;385(19):1804–1806. doi: 10.1056/NEJMe2114918 [DOI] [PubMed] [Google Scholar]
- 52.Ruffin F, Dagher M, Park LP, et al. Black and White Patients With Staphylococcus aureus Bacteremia Have Similar Outcomes but Different Risk Factors. Clinical Infectious Diseases 2023;76(7):1260–1265. doi: 10.1093/cid/ciac893 [DOI] [PMC free article] [PubMed] [Google Scholar]
- 53.Wang X, Zhang Y, Zhu R. A brief review on algorithmic fairness. MSE 2022;1(1):7. doi: 10.1007/s44176-022-00006-z [DOI] [Google Scholar]
- 54.Chiappa S Path-Specific Counterfactual Fairness. AAAI 2019;33(01):7801–7808. doi: 10.1609/aaai.v33i01.33017801 [DOI] [Google Scholar]
- 55.Kusner MJ, Loftus J, Russell C, Silva R. Counterfactual Fairness In: Guyon I, Luxburg UV, Bengio S, et al. , eds. Advances in Neural Information Processing Systems. Vol 30. Curran Associates, Inc.; 2017. https://proceedings.neurips.cc/paper_files/paper/2017/file/a486cd07e4ac3d270571622f4f316ec5-Paper.pdf [Google Scholar]
- 56.Nabi R, Shpitser I. Fair Inference on Outcomes. AAAI 2018;32(1). doi: 10.1609/aaai.v32i1.11553 [DOI] [PMC free article] [PubMed] [Google Scholar]
- 57.Wu Y, Zhang L, Wu X, Tong H. PC-Fairness: A Unified Framework for Measuring Causality-based Fairness In: Wallach H, Larochelle H, Beygelzimer A, Alché-Buc F d’, Fox E, Garnett R, eds. Advances in Neural Information Processing Systems. Vol 32. Curran Associates, Inc.; 2019. https://proceedings.neurips.cc/paper_files/paper/2019/file/44a2e0804995faf8d2e3b084a1e2db1d-Paper.pdf [Google Scholar]