

Abstract
Objective
To describe network structure and alignment across organizations in healthcare, public health, and social services sectors that serve pregnant and parenting women with substance use disorder (SUD) in an urban and a rural community.
Data Sources and Study Settings
Two community networks, one urban and one rural with each including a residential substance use treatment program, in Kentucky during 2021.
Study Design
Social network analysis measured system collaboration and cross‐sector alignment between healthcare, public health, and social services organizations, applying the Framework for Aligning Sectors. To understand the alignment and structure of each network, we measured network density overall and between sectors, network centralization, and each organization's degree centrality and effective size.
Data Collection/Extraction Methods
Computer‐assisted telephone interviews were conducted to document alignment around shared purpose, data, financing, and governance.
Principal Findings
On average, overall and cross‐sector network densities in both communities were similar. However, alignment was highest for data sharing and financing in the urban community and for shared purpose and governance in the rural community. Cross‐sector partnerships involving healthcare organizations were more prevalent in the rural county (44% vs. 38% for healthcare/public health, 44% vs. 29% for healthcare/social services), but more prevalent for those involving public health/social services organizations in the urban county (42% vs. 24%). A single healthcare organization had the highest degree centrality (Mdn [IQR] = 26 [26–9.5]) and effective size (Mdn [IQR] = 15.9 [20.6–8.7]) within the rural county. Social services organizations held more central positions in the urban county (degree centrality Mdn [IQR] = 13 [14.8–9.5]; effective size Mdn [IQR] = 10.4 [11.4–7.9]).
Conclusions
Cross‐sector alignment may strengthen local capacity for comprehensive SUD care for pregnant and parenting women. Healthcare organizations are key players in cross‐sector partnerships in the rural community, where one healthcare facility holds the central brokerage role. In contrast, public health agencies are key to cross‐sector collaboration with social services in the urban community.
Keywords: child and adolescent health, health care organizations and systems, integrated delivery systems, maternal and perinatal care and outcomes, rural health, social determinants of health, substance use: alcohol/chemical dependency/tobacco
What is known on this topic
Pregnant and parenting women in recovery and their family members often face barriers to care and need services and supports from multiple sectors.
Local substance use treatment programs may collaborate with other organizations to ensure comprehensive services and facilitate successful recovery during and after residential treatment.
The Framework for Aligning Sectors conceptualizes that when the healthcare, public health, and social services sectors align, community capacity to promote health and well‐being is improved.
What this study adds
There are differences in network structure and cross‐sector alignment in rural and urban networks, suggesting different needs to build system capacity at a local level.
The position of and roles played by organizations in each sector may vary across urban and rural communities and network disruptions could impact care delivery.
1. INTRODUCTION
Substance use and the opioid epidemic have had considerable impacts on individuals, families, and communities, more so during the COVID‐19 pandemic. In 2020, there was a 30% and 38% increase in suspected drug and opioid overdoses, respectively. 1 Drug overdose deaths disproportionately impact males 2 but are increasing among pregnant and postpartum women and those of reproductive age, 3 with a higher increase in rural areas. 4 Substance use during pregnancy increases the risk of negative maternal outcomes, including miscarriage, preterm labor, and delivery complications. 4 , 5 , 6 , 7 , 8 Additionally, infants are at higher risk of low birthweight, preterm birth, and needing care in a neonatal intensive care unit. 5 , 6 , 7 , 8 , 9 , 10
Health risks extend beyond pregnancy and delivery. State maternal mortality review boards indicate that approximately one quarter of all postpartum deaths are attributable to mental health conditions including overdose. 11 Postpartum depression also increases the likelihood of substance use, 12 and exogenous stressors such as COVID‐19 increase the probability of developing serious mental health conditions associated with substance use disorders (SUDs) in postpartum women. 13 Addressing those needs is key to improving outcomes. 14
Pregnant women report low rates of treatment for SUD, 15 with identified barriers including challenges with SUD screening in women's health settings, lack of resources, social stigma, and potential legal implications. 16 , 17 , 18 , 19 Further, there are documented disparities between urban and rural communities in access to treatment and support services for pregnant women with SUDs. 20 , 21 In rural Kentucky, 80% of pregnant women seeking recovery support for SUDs experienced obstacles to obtaining needed supports. 22 One recent case study based in Kentucky identified primary barriers to SUD treatment as fragmented services, stigmatization and distrust of mental and behavioral healthcare in the community, and disengagement of community members after the closure of a major healthcare facility. 23
Federal and state governments have focused attention and resources on SUD prevention and treatment in an effort to minimize barriers to accessing SUD care. The Comprehensive Addiction and Recovery Act (CARA) invested over $180 million in prevention and treatment of opioid use. 24 States have also leveraged the Section 1115 waiver program to expand Medicaid coverage for residential substance use treatment. 25 States remained challenged with financing and sustaining residential programs that allow children to stay with pregnant and parenting women during treatment. 26
Local communities and organizations are on the forefront in the response to SUDs, including use among pregnant and parenting women. Hospitals, health systems, first responders, legal services, recovery services, housing programs, and harm reduction programs face increasing demand for services and support; however, capacity constraints are challenging. 27 , 28 , 29
Rural healthcare infrastructure, particularly hospital‐based services, has changed extensively over the last several decades. Recent rural hospital closures, primarily in southern regions of the United States, have disproportionately impacted a population affected by poverty 30 and the opioid epidemic. In Kentucky, rural hospital closures between 2010 and 2019 left nearly 45,000 people with diminished access to hospital services, with approximately 20,000 people without access within a 30‐min drive. 31 Access to acute care services is not the only barrier people face. Several studies have demonstrated distance‐related access barriers, 21 , 22 and associations between longer travel distance and decreased access to providers, declining continuity of care, and reduced use of services for treatment of SUDs in nonresidential treatment facilities. 32 , 33 , 34 , 35
Interconnected systems of care may improve health outcomes for pregnant women via coordinated and comprehensive services, 36 but the evidence is limited. There has been recent attention on cross‐sector collaborations that can serve medical and nonmedical social and public needs, 37 which are common among people with co‐occurring SUD and mental health disorders. 38 While the social and public health services supporting individuals with SUD are important, 39 few studies have examined the composition of networks of organizations that serve pregnant or parenting women affected by substance use. To our knowledge, only one study has looked at cross‐sector partnerships in service networks focused on pregnant and parenting women with SUDs; that study demonstrated that while cross‐sector partnerships with local treatment programs existed, the strength of these partnerships varied based on partner type. 40 No analysis explored the context of the relationships themselves, local factors that may contribute to partnerships, nor the dependence of organizations on each other 41 to sustain comprehensive care delivery across sectors.
Aligning Systems for Health is a program funded by the Robert Wood Johnson Foundation and coordinated through the Georgia Health Policy Center. The Framework for Aligning Sectors (Framework) posits that when organizations within healthcare, public health, and social services align around shared purpose, data, financing, and governance, they are more likely to contribute to broader community health goals. 37 Using the Framework as a conceptual model, the SHERO (Strengthening Health Equity and Recovery Outcomes) study was designed to measure and compare overall and cross‐sector alignment around purpose, data sharing, governance, and financing. In this case study, we examine variations in whole network alignment in two community service networks, one urban and one rural, serving pregnant and parenting women in recovery. We further explore the structure of each network, examining the positionality of individual organizations to understand how participation of those organizations may influence overall network capacity and highlight any potential vulnerabilities and strengths.
2. METHODS
2.1. Setting
We defined the networks of healthcare, public health, and social services organizations in two communities where Volunteers of America Mid‐States operates Freedom House (FH), a residential SUD treatment program where mothers are served along with their child/ren. FH is operating in two communities: one in urban Jefferson County, Kentucky, and a second in rural Clay County, Kentucky, allowing us to explore networks surrounding similar programs in starkly different community contexts.
The FH in Jefferson County, Kentucky, was opened in 1993 responding to the recognition that pregnant and parenting women needed a different approach to recovery support. Subsequently, FH expanded to three additional locations in Jefferson County, and in 2020, one location in rural Clay County, Kentucky. Jefferson County is home to Louisville, the largest urban center in Kentucky, with a population of 782,969 in 2020. 42 Over 70% of the Jefferson County population was White and over 23% was Black, and the median income in 2020 was $61,633. The Clay County FH expansion was encouraged by local leaders, who were facing a growing opioid epidemic and national headlines citing Clay County as the hardest place to live in America. 43 Clay County is in rural Appalachian Kentucky and had a population of 20,345 in 2020. 44 Over 94% were White and 4% Black, and the county had a median income of $33,399. Despite these differences, both counties have high maternal vulnerability indices, particularly around physical health, substance use, and mental health. 45
FH programming combines medication, clinical, and peer support. Key program goals include reducing or stopping substance use, family reunification, and maintenance of stable housing and employment. While the programs in both counties primarily serve women in their closest geographic regions to maximize linkages, they are available to women across the state. By design, FH relies on community partnerships and collaborations to support clients in areas such as enhancing parenting skills, establishing permanent housing, and addressing legal issues. Their partnerships span healthcare, public health, and social services sectors.
2.2. Data collection
To identify organizational members of each network, FH staff provided a roster of partner organizations in the fall of 2020. To ensure our network boundaries included other organizations key to serving women and families, we conducted interviews with 10 FH clients or graduates of the program from the previous year. We asked each participant about organizations she sought out or received services from during her recovery. Each additional organization was added to the roster and verified by FH staff as actively providing services in the county. State agencies with an active role in local service delivery were eligible for inclusion in the network. Organizations without a local presence in the county were excluded. We categorized all organizations into one of the three sectors: healthcare, public health, and social services organizations.
Once the networks were defined, FH staff provided the study team with a primary contact at each organization who was knowledgeable about the organizational relationships. Organizational contacts were invited to participate in a 1‐h telephone‐based survey on behalf of their organization; we offered a gift card for their participation. All interviews were conducted between January and June 2021. The response rate was 57% in rural Clay County and 56% in urban Jefferson County.
The network survey included 32 questions designed to document relationships between organizations in each network, exploring overall collaboration and the presence of alignment in each of the four primary constructs within the Framework: purpose, data sharing, financing, and governance. Existing partnerships were defined as those present within the 12 months prior to the time the survey was conducted. Each construct within the Framework was operationalized with three to five questions informed by discussions with the SHERO Community Advisory Board and the Aligning Systems for Health Program Office team at the Georgia Health Policy Center. We also included questions about the presence of community‐wide systems or coalitions that could facilitate data sharing and shared decision‐making, and the impact of COVID‐19 on the organizations' work and community partnerships. Supplement 1 lists the survey questions.
2.3. Network analysis
We used social network analysis 46 to quantify alignment among organizations in each community and describe the structure of the networks. Each organization or node is referred to as an ego, while the other organizations directly tied to the ego are referred to as alters. All survey responses were coded to denote the presence (1) or absence (0) of a tie (relationship) between two organizations. For each network, we constructed a square adjacency matrix format to show organization‐by‐organization ties, allowing for symmetric and asymmetric relationships and analysis at the network and node levels.
The primary network‐level measures included density and centralization. Network density indicates the extent to which ties between organizations are present in a network. Network density was calculated as the proportion of observed ties among all possible ties, where a higher density indicates more ties present, and is reported overall and across sectors. Network centralization measures the extent to which ties within a network are concentrated around one or a few organizations. 36 A more centralized network may indicate that certain organizations within the network serve in power‐broker roles that could facilitate or discourage alignment. Centralization is reported as a proportion, where a higher centralization means the ties of that type are dominated by one or a few organizations in the network, though it does not identify which organizations serve in central roles. Both measures were calculated for each type of interorganizational tie and were averaged across each construct and overall for each network.
The primary node‐level measures of interest were degree centrality and effective size, which are used to determine which organizations and sectors in each network were most central in each type of tie. In contrast to network centralization, degree centrality helps identify which individual organizations serve in central roles. 47 Degree centrality refers to the size of a node's ego network (the number of ties an ego/node has) and is interpreted as the ability to influence other organizations and control access to key resources. 48 Degree centrality is calculated as the total number of ties, undirected, incoming, and outgoing, an ego has. A higher degree centrality indicates a higher degree of influence and access to resources. The organization's effective size measures the structure of the organization's ego network and associated gaps, or structural holes, within that network. 49 Effective size assesses the connectedness of the organization's alters, calculated as the proportion of the organization's alters that are tied to each other, subtracted from the total number of an organization's alters. When an organization has many ties that are sparsely connected to each other, there are more structural holes, the effective size is larger, and a brokerage role is indicated for that organization, 49 , 50 which implies control of resource coordination and information within a network. The two node‐level measures, degree centrality and effective size, are calculated at the node (organizational) level and within each sector, reported as the median and interquartile range for each measure.
All nodes within the network were assigned attributes denoting organizational characteristics, including the primary sector in which they provide services. All network‐level and node‐level measures were calculated using UCINET 6. 51 Network graphs visualizing alignment were produced using NetDraw. 51 The study was approved through the University of Louisville Institutional Review Board.
3. RESULTS
We identified 25 organizations in the urban county and 28 organizations in the rural county. In both communities, social services organizations comprised over 60% of organizations in the network, healthcare organizations between 18% and 28%, and public health organizations between 8% and 18%.
3.1. Network‐level findings
Overall, alignment was relatively low in both communities with an average network‐level density of 41% in the urban county and 45% in the rural county. Supplement 2 displays the density and centralization in each network within each construct of the Framework. We observed substantial variation in alignment around particular types of ties in each community. Alignment was present more often for shared purpose, averaging over 20% in both communities and less so for shared data, governance, and financing.
Organizations in the urban county reported slightly more alignment around data sharing (11% vs. 4%, on average) and shared financing (3% vs. 2%, on average), though both were low. Urban organizations also reported more alignment around advocacy for both policy (within shared purpose) and financing models (within shared financing).
Organizations in the rural county reported closely tied missions, operationalized in this study as an indicator of shared purpose, with a density of 60% compared with 36% in the urban county. The rural network had more alignment around shared purpose (27% vs. 24%) and shared governance (12% vs. 6%).
Despite low network density, both networks had high levels of centralization, especially for shared purpose and data sharing; however, centralization also varied by type of tie. For example, centralization around directional data sharing was very high (88%–90%) in the rural county, indicating that data exchange was highly concentrated between a small number of organizations even when data sharing prevalence (density) was low. Figures 1 and 2 visualize these differences graphically.
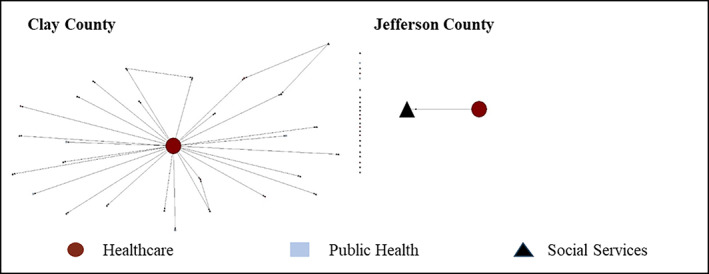
FIGURE 1.
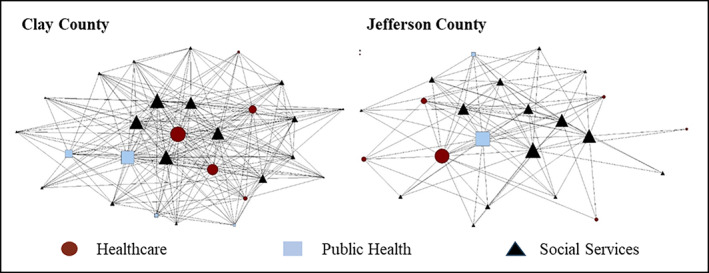
Rural and urban network structure for shared mission between organizations. Node shapes denote the sector. Circles are healthcare organizations, squares are public health organizations, and triangles are social services organizations. A larger node indicates a larger relative effective size. Nodes with no lines indicate that organization did not have any ties.
FIGURE 2.
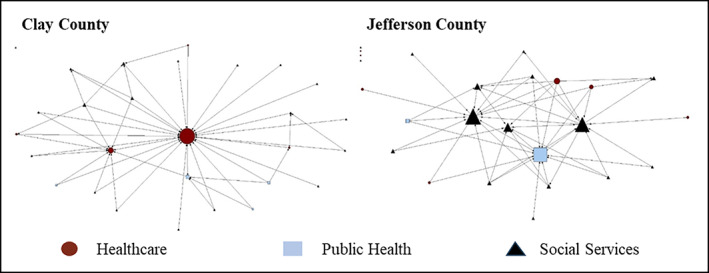
Rural and urban network structure in data sharing between organizations. Node shapes denote the sector. Circles are healthcare organizations, squares are public health organizations, and triangles are social services organizations. A larger node indicates a larger relative effective size. Nodes with no lines indicate that organization did not have any ties.
The figures demonstrate the varying structure of the networks. Figure 1 visualizes the networks for shared mission and shows a much denser network in the rural county. Figure 2 represents the networks for sharing data. Both networks were less dense for data sharing than for shared mission. The urban county was 2% denser around data sharing with others, but the rural county was more centralized around a single healthcare organization, indicating that data sharing was more dispersed in the urban county and more concentrated involving the healthcare organization in the rural county.
Cross‐sector alignment of any kind had a mean density of 35% in both communities. However, there were meaningful urban–rural differences in the types of cross‐sector alignment. Supplement 3 describes cross‐sector density, overall, and by each construct and survey item. We observed more organizational ties (alignment) between the public health and social services sectors in urban Jefferson County, overall (81% vs. 48%), and around all alignment constructs. Alignment involving healthcare organizations was more prevalent in the rural county compared with the urban county. There were nuances to these data. Regarding data sharing, overall network density was highest for the urban county (Supplement 2), but the types of data sharing relationships vary when considering cross‐sector partnerships (Supplement 3). For example, healthcare organizations are frequent partners in data sharing agreements with public health and social services organizations in the urban county, where these partnerships are denser for more formal ties such as data sharing agreements and shared data systems. However, the cross‐sector density of data sharing relationships involving healthcare organizations was higher in the rural county, largely driven by data sharing to and from a single healthcare organization.
3.2. Node‐level findings
The median highest degree centrality among organizations in the urban network was 12.0 (IQR = 15.5–7.0), of 24 maximum possible ties, and the median largest effective size was 10.3 (IQR = 11.2–6.0). Among organizations within the rural network, the median highest degree centrality was 26.0 (IQR = 26.0–5.0) out of a maximum 27 and the median largest effective size was 12.3 (IQR = 20.0–4.8), indicating more structural holes in the rural network.
There were differences in the prominence of sectors across the networks, as presented in Supplement 4. The healthcare sector was most central to the network in the rural county with both the largest number of ties to other organizations and smallest proportion of those alter organizations with ties to one another (highest degree centrality and largest effective size), calculated among 15 of 19 tie types (79%); 12 of 19 tie types (63%) held by a single healthcare facility, spanning overall collaboration, shared mission, data sharing, shared purpose, shared governance, and shared financing. The organizations most central to the network in the urban county were most frequently from the social services sector with the highest degree centrality calculated among 14 of 19 items (74%), spanning overall collaboration, data sharing, shared purpose, shared governance, and shared financing. Similarly, the organizations with the largest effective size, indicating a brokerage role, in the urban network were most frequently from the social services sector (16 of 19 items, 84%).
When assessing whether an organization had partnered with other organizations in the network to deliver services, there were key differences between the rural county, where a major healthcare facility again had the highest centrality and largest effective size, and the urban county, where one social services organization played a similar role (Figure 3). A similar pattern was observed in client referrals, where the healthcare facility was most central in the rural network, and this role was shared among multiple public health and social services organizations in the urban network (Figure 4).
FIGURE 3.
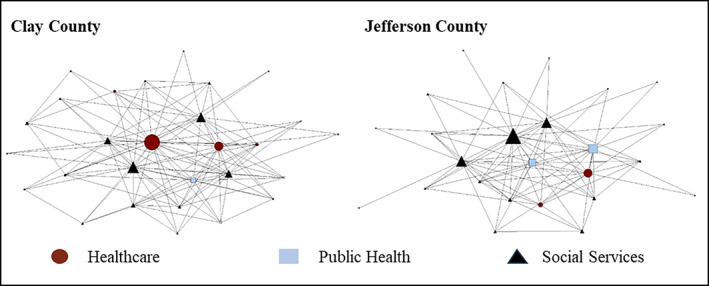
Rural and urban network structure in partnering to deliver services overall. Node shapes denote the sector. Circles are healthcare organizations, squares are public health organizations, and triangles are social services organizations. A larger node indicates a larger relative effective size.
FIGURE 4.
Rural and urban network structure in client referral. Node shapes denote the sector. Circles are healthcare organizations, squares are public health organizations, and triangles are social services organizations. A larger node indicates a larger relative effective size. Nodes with no lines indicate that organization did not have any ties.
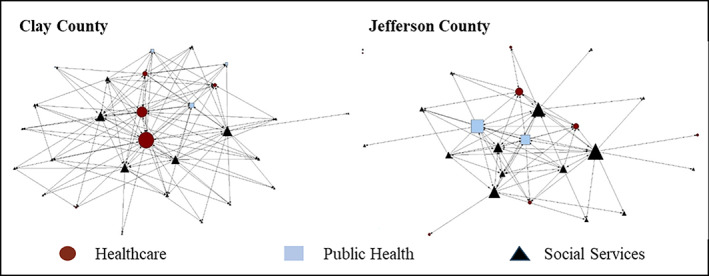
These differences were most prominent when assessing whether an organization had paid for services delivered by other organizations and whether other organizations shared client data. While the majority of organizations in the rural county did not pay other organizations for services, the healthcare organization paid nearly every other organization for services delivered (effective size = 25.85); almost no organizations in the urban county paid each other for services delivered (Figure 5). Similarly, the majority of organizations in the rural county shared data almost exclusively with the healthcare organization (effective size = 24.3). In the urban county, a larger number of social services and public health organizations share client data across the network (largest effective size = 11.5) (Figure 2).
FIGURE 5.
Rural and urban network structure in paying for services delivered by other organizations. Node shapes denote the sector. Circles are healthcare organizations, squares are public health organizations, and triangles are social services organizations. A larger node indicates a larger relative effective size. Nodes with no lines indicate that organization did not have any ties.
4. DISCUSSION
The results of the network and node‐level analyses suggest major and important differences in the alignment and structure of the urban and rural network of organizations serving pregnant and parenting women in recovery. System and cross‐sector alignment differed in the communities, as did the potential dependency of organizations on one another. Alignment, as measured by network density, was most prevalent around shared purpose. We observed limited alignment around shared data, financing, or governance. The rural county had greater alignment around shared purpose and shared governance, possibly related to the organizations and their employees operating within a more resource‐dependent and socially interconnected local environment and with less redundancy in service delivery organizations. Cross‐sector alignment was more prevalent in the urban county among public health and social services organizations and in the rural county for partnerships that engaged the healthcare sector.
Upon further examination, the findings illuminate the prominence of the healthcare sector in the rural community where one organization, a healthcare facility, held the largest central brokerage role in the network. This was especially evident in the domains of data sharing, service delivery, paying other organizations for services, and client referrals, where the network is vulnerable to data, communication, and resource breakdowns due to a higher number of structural holes. In contrast, the urban county had more duplication in service delivery organizations and fewer structural holes. Multiple organizations from social services and the public health sector held central roles across the majority of tie types, with almost no financing between organizations. This may provide redundancy in the network and protection from dissolution if an organization is no longer able to provide services. Further, organizations in the urban community face an external environment that includes market competition and, therefore, strategically differentiate themselves to attract both clients and external resources, possibly explaining lower alignment around shared purpose. 52 , 53
We found more network‐level alignment in shared data and slightly more alignment around shared financing in the urban county, though we found some variation by tie type when examining data sharing alignment across sectors. Both data sharing and financial relationships are largely dependent on formal collaborations, legal contracts, and monetary resources. Urban organizations may be more likely to enter into formal arrangements due to organizational expertise and extended financial resources. The network interviews also revealed that the urban county had a community‐wide data sharing platform for tracking client referrals, available by subscription to local organizations, increasing the likelihood that organizations shared client data.
The presence of healthcare organizations in public health systems has evolved and may be driven by strategic decision‐making and policy change. 54 , 55 Our study shows that the healthcare sector played a significant role in connecting other sectors in the rural network but was less engaged in service delivery in the urban community. Owsley et al. found that urban public health systems had greater availability of recommended public health services compared with rural public health systems since implementation of the Patient Protection and Affordable Care Act. 56 With limited resources in the rural community, the healthcare facility provided important structural and social support infrastructure in addition to medical services. The large effective size and degree centrality of a single healthcare organization indicates significant structural holes in the rural network, making the network highly dependent and vulnerable to disruptions. Should this single healthcare organization close, reduce service lines, or fail to support mental or behavioral healthcare in the community, this rural community system serving pregnant and parenting women and their families could practically dissolve, becoming much less aligned and collaborative within and across sectors. There are other implications of healthcare facility closures on the community, including economic impacts, such as income, poverty, unemployment rate, the size of labor force, and declines in population. 57
Rural communities are characterized by a lower population density and often cannot support specialized healthcare facilities under funding models that depend on payments from individual patient care. 58 Probst et al. define the paradigm of “structural urbanism” under which healthcare policy systematically favors urban communities due to “market orientation in healthcare,” funding mechanisms favoring large population reach, and the innate nonscalability in rural areas. 58 Consequently, urban communities can have service delivery organizations with higher quality services due to economies of scale, especially among specialty providers. 59 Nearly 20% of people in rural Kentucky fall below the poverty line, 60 potentially limiting their ability to travel for needed services. While travel times and geographic proximity to SUD treatment facilities are well‐documented barriers to care, 32 , 33 , 34 , 35 there are other design complexities to consider when estimating the adverse effects of distance to SUD treatment facilities. For example, while quality of care may be improved by coordinating specialized SUD treatment for pregnant and parenting women in locales who benefit from economies of scale, this disadvantages those with fewer resources to travel to distant facilities and removes families from social support systems.
Policymakers should consider supportive policies and interventions that aim to increase access and quality for rural populations without reducing the advantages in quality observed in larger urban markets. Leaders should consider the entire network of organizations participating in service delivery, and whose relationships potentially strengthen alignment, in efforts to support local communities. Further, it is important to balance the benefits of centralized networks on resource and information dissemination while considering the risks associated with delivery disruptions and network alignment that impact services across sectors. Policies should include mechanisms to strengthen social services and public health organizations in rural networks supporting women in recovery, where resources, services, and funding are limited.
This study had several limitations. The SHERO study focused on two Kentucky communities that may not be representative of other urban or rural communities or rural counties without healthcare facilities. The study was conducted during the height of the COVID‐19 pandemic; responses and services were likely impacted by restrictions on in‐person events and communication. Questions were included to assess how the pandemic impacted each organization's work with other organizations in the community. Nearly all organizations responded affirmatively, indicating an interruption in community programs followed by a pivot to virtual services. In addition, organizations in both communities indicated that referrals declined. While the pandemic may have affected the urban and rural communities differently, the results of the study point to the strength of redundancy in the urban community where multiple organizations can shoulder the impact of a major event but also the culture of rural communities where informal ties among people may tie organizations together. The pandemic also created staffing demands and institutional pressures that likely led to a lower response rate than expected. Where possible, we symmetrized all data under the assumption that if one organization reported a tie, it was present regardless of whether the other organization confirmed the tie. Finally, this analysis does not examine any causal pathways between system and cross‐sector alignment and outcomes for pregnant and parenting women. This is an important area for future research.
Despite these limitations, this analysis presents a significant difference in the alignment and structure of a rural and urban network of organizations serving pregnant and parenting women in recovery. The study illustrates the dependency of the rural network on the healthcare sector and one healthcare facility in particular. The recent trends in rural healthcare facility closures suggest that loss of these organizations can have significant consequences for patient care and community well‐being.
The Framework for Aligning Sectors suggests that stronger alignment between organizations may facilitate better service delivery across sectors and enhance individual, family, and community health. Both the urban and rural communities in this study had strengths and challenges that can inform resource investment and policymaking to incentivize alignment and improve service delivery for pregnant and parenting women and their families. Although the community networks in our study were limited to organizations that serve pregnant and parenting women in recovery, to our knowledge, none served only pregnant and parenting women. Therefore, the structures and alignment within these networks have the potential to impact service delivery and outcomes for other populations.
Establishing and sustaining interorganizational collaboration and cross‐sector alignment has functional and technical challenges. Disparate outcome metrics and reporting, limited data system integration, competing organizational incentives, and lack of innovative financing mechanisms present challenges to organizational alignment. 61 , 62 Standing governance structures such as boards of health can contribute to stronger systems of care. 63 Understanding where alignment exists and how it is structured can inform community‐based organizations in each sector to better align and maximize outcomes while minimizing resource utilization and duplication of services. Emphasis should be placed on the importance of flexibility in policymaking that builds on strengths of local systems of care but allows for innovation in design of local or regional interventions to fill services gaps and address barriers that prevent pregnant and parenting women from accessing SUD treatment and maintaining recovery.
FUNDING INFORMATION
This project was supported by the Robert Wood Johnson Foundation Aligning Systems for Health Program (No. 77407).
Supporting information
Data S1. Supplement 1: Survey Items, by Construct.
Supplement 2. Overall Density and Centralization, Urban Jefferson County Compared to Rural Clay County.
Supplement 3. Cross‐Sector Alignment, Between Group Network Density, Urban Jefferson County Compared to Rural Clay County.
Supplement 4. Organizations and sectors with largest degree centrality and effective size by construct item.
ACKNOWLEDGMENTS
This manuscript represents the combination of two original papers, each with separate first authors (Creel and Feygin). Liza M. Creel and Madeline Shipley were formerly affiliated with the University of Louisville School of Public Health and Information Sciences. Tiffany Cole Hall was formerly affiliated with Volunteers of America Mid‐States. Scott D. Duncan also serves as a volunteer on the Board of Directors for Volunteers of America Mid‐States. This work was previously presented at the 2022 AcademyHealth Annual Research Meeting in the Public Health Services and Systems Research Interest Group, at the 2023 AcademyHealth Annual Research Meeting as a poster, and as a poster at the 2022 Pediatric Academic Societies Annual Meeting. We appreciate the valuable feedback in each of those venues. In addition, a broad summary of this study and high‐level preliminary findings are included as a chapter in the forthcoming book Aligning for Health: Research Learnings from Across the Nation, published by the Georgia Health Policy Center.
Creel LM, Feygin YB, Shipley M, et al. A case study on variations in network structure and cross‐sector alignment in two local systems serving pregnant and parenting women in recovery. Health Serv Res. 2024;59(Suppl. 1):e14251. doi: 10.1111/1475-6773.14251
REFERENCES
- 1. Drug Overdose Surveillance and Epidemiology (DOSE) System . Centers for Disease Control and Prevention, US Department of Health and Human Services. Accessed February 7, 2023 https://www.cdc.gov/drugoverdose/nonfatal/dashboard
- 2. State Unintentional Drug Overdose Reporting System (SUDORS) . Centers for Disease Control and Prevention, US Department of Health and Human Services. Accessed February 7, 2023 https://www.cdc.gov/drugoverdose/fatal/dashboard
- 3. Bruzelius E, Martins SS. US trends in drug overdose mortality among pregnant and postpartum persons, 2017–2020. JAMA. 2022;328(21):2159‐2161. doi: 10.1001/jama.2022.17045 [DOI] [PMC free article] [PubMed] [Google Scholar]
- 4. Logue TC, Wen T, Friedman AM. Demographic trends associated with substance use disorder and risk for adverse obstetric outcomes with cannabis and opioid use disorders. J Matern Fetal Neonatal Med. 2022;35(26):2128658. doi: 10.1080/14767058.2022.2128658 [DOI] [PubMed] [Google Scholar]
- 5. Quesada O, Gotman N, Howell HB, Funai EF, Rounsaville BJ, Yonkers KA. Prenatal hazardous substance use and adverse birth outcomes. J Matern‐Fetal Neonatal Med. 2012;25(8):1222‐1227. doi: 10.3109/14767058.2011.602143 [DOI] [PMC free article] [PubMed] [Google Scholar]
- 6. Gyllstrom ME, Hellerstedt WL, McGovern PM. Independent and interactive associations of prenatal mood and substance use with infant birth outcomes. Matern Child Health J. 2011;15(2):198‐204. doi: 10.1007/s10995-009-0558-y [DOI] [PubMed] [Google Scholar]
- 7. Hammoud AO, Bujold E, Sorokin Y, Schild C, Krapp M, Baumann P. Smoking in pregnancy revisited: findings from a large population‐based study. Am J Obstet Gynecol. 2005;192(6):1856‐1862; discussion 1862–1863. doi: 10.1016/j.ajog.2004.12.057 [DOI] [PubMed] [Google Scholar]
- 8. Luke S, Hobbs AJ, Smith M, et al. Cannabis use in pregnancy and maternal and infant outcomes: a Canadian cross‐jurisdictional population‐based cohort study. PLoS One. 2022;17(11):e0276824. doi: 10.1371/journal.pone.0276824 [DOI] [PMC free article] [PubMed] [Google Scholar]
- 9. Bada HS, Das A, Bauer CR, et al. Low birth weight and preterm births: etiologic fraction attributable to prenatal drug exposure. J Perinatol. 2005;25(10):631‐637. doi: 10.1038/sj.jp.7211378 [DOI] [PubMed] [Google Scholar]
- 10. Patrick SW, Barfield WD, Poindexter BB. Committee on fetus and newborn, committee on substance use and prevention. Neonatal opioid withdrawal syndrome. Pediatrics. 2020;146(5):e2020029074. doi: 10.1542/peds.2020-029074 [DOI] [PubMed] [Google Scholar]
- 11. Trost S, Beauregard J, Chandra G, et al. Pregnancy‐Related Deaths: Data from Maternal Mortality Review Committees in 36 US States, 2017–2019. Centers for Disease Control and Prevention, US Department of Health and Human Services; 2022. [Google Scholar]
- 12. Chapman SLC, Wu LT. Postpartum substance use and depressive symptoms: a review. Women Health. 2013;53(5):479‐503. doi: 10.1080/03630242.2013.804025 [DOI] [PMC free article] [PubMed] [Google Scholar]
- 13. Kornfield SL, White LK, Waller R, et al. Risk and resilience factors underlying postpartum depression and impaired mother‐infant bonding during COVID‐19. Health Aff Proj Hope. 2021;40(10):1566‐1574. doi: 10.1377/hlthaff.2021.00803 [DOI] [PMC free article] [PubMed] [Google Scholar]
- 14. Stone R. Pregnant women and substance use: fear, stigma, and barriers to care. Health Justice. 2015;3(1):2. doi: 10.1186/s40352-015-0015-5 [DOI] [Google Scholar]
- 15. Salameh TN, Hall LA, Crawford TN, Staten RR, Hall MT. Trends in mental health and substance use disorders and treatment receipt among pregnant and nonpregnant women in the United States, 2008–2014. J Psychosom Obstet Gynaecol. 2020;41(4):298‐307. doi: 10.1080/0167482X.2019.1689949 [DOI] [PubMed] [Google Scholar]
- 16. Choi S, Rosenbloom D, Stein MD, Raifman J, Clark JA. Differential gateways, facilitators, and barriers to substance use disorder treatment for pregnant women and mothers: a scoping systematic review. J Addict Med. 2022;16(3):e185‐e196. doi: 10.1097/ADM.0000000000000909 [DOI] [PMC free article] [PubMed] [Google Scholar]
- 17. Bright V, Riddle J, Kerver J. Stigma experienced by rural pregnant women with substance use disorder: a scoping review and qualitative synthesis. Int J Environ Res Public Health. 2022;19(22):15065. doi: 10.3390/ijerph192215065 [DOI] [PMC free article] [PubMed] [Google Scholar]
- 18. Racine E, Bell E, Zizzo N, Green C. Public discourse on the biology of alcohol addiction: implications for stigma, self‐control, essentialism, and coercive policies in pregnancy. Neuroethics. 2015;8(2):177‐186. doi: 10.1007/s12152-014-9228-x [DOI] [Google Scholar]
- 19. Angelotta C, Appelbaum PS. Criminal charges for child harm from substance use in pregnancy. J Am Acad Psychiatry Law. 2017;45(2):193‐203. [PubMed] [Google Scholar]
- 20. Heil SH, Sigmon SC, Jones HE, Wagner M. Comparison of characteristics of opioid‐using pregnant women in rural and urban settings. Am J Drug Alcohol Abuse. 2008;34(4):463‐471. doi: 10.1080/00952990802122358 [DOI] [PMC free article] [PubMed] [Google Scholar]
- 21. Shaw MR, Grant T, Barbosa‐Leiker C, Fleming SE, Henley S, Graham JC. Intervention with substance‐abusing mothers: are there rural–urban differences? Am J Addict. 2015;24(2):144‐152. doi: 10.1111/ajad.12155 [DOI] [PubMed] [Google Scholar]
- 22. Jackson A, Shannon L. Barriers to receiving substance abuse treatment among rural pregnant women in Kentucky. Matern Child Health J. 2012;16(9):1762‐1770. doi: 10.1007/s10995-011-0923-5 [DOI] [PubMed] [Google Scholar]
- 23. Hardcastle VG. The critical role of care coordinators for persons with substance use disorder in rural settings: a case study. Soc Work Health Care. 2021;60(8–9):561‐580. doi: 10.1080/00981389.2021.1986456 [DOI] [PubMed] [Google Scholar]
- 24. Sen. Whitehouse S [D R. Text – S.524 – 114th Congress (2015–2016): Comprehensive Addiction and Recovery Act of 2016. Published July 22, 2016. Accessed March 13, 2023 http://www.congress.gov/
- 25. Section 1115 waivers for substance use disorder treatment. MACPAC. Accessed February 27, 2023 https://www.macpac.gov/subtopic/section-1115-waivers-for-substance-use-disorder-treatment/
- 26. Louis CS. Despite successes, addiction treatment programs for families struggle to stay open KFF health news. Published September 13, 2023. Accessed September 18, 2023 https://kffhealthnews.org/news/article/family‐addiction‐treatment‐centers‐scarce‐rural‐minnesota‐north‐dakota/
- 27. Bouchery E. Examining substance use disorder treatment demand and provider capacity in a changing health care system: Final report. US Department of Health and Human Services, Office of the Assistance Secretary for Planning and Evaluation. 2016. Accessed February 27, 2023 http://www.congress.gov/
- 28. Blevins CE, Rawat N, Stein MD. Gaps in the substance use disorder treatment referral process: provider perceptions. J Addict Med. 2018;12(4):273‐277. doi: 10.1097/ADM.0000000000000400 [DOI] [PMC free article] [PubMed] [Google Scholar]
- 29. Green B. A tool for assessing a Community's capacity for substance abuse care. Prev Chronic Dis. 2016;13:13. doi: 10.5888/pcd13.160190 [DOI] [PMC free article] [PubMed] [Google Scholar]
- 30. Poverty Rate by State [Updated January 2023]. Accessed August 17, 2023 https://worldpopulationreview.com/state-rankings/poverty-rate-by-state
- 31. McCarthy S, Moore D, Smedley WA, et al. Impact of rural hospital closures on health‐care access. J Surg Res. 2021;258:170‐178. doi: 10.1016/j.jss.2020.08.055 [DOI] [PubMed] [Google Scholar]
- 32. Garnick DW, Horgan CM, Acevedo A, et al. Rural Clients' continuity into follow‐up substance use disorder treatment: impacts of travel time, incentives and alerts. J Rural Health. 2020;36(2):196‐207. doi: 10.1111/jrh.12375 [DOI] [PMC free article] [PubMed] [Google Scholar]
- 33. Amiri S, Lutz RB, McDonell MG, Roll JM, Amram O. Spatial access to opioid treatment program and alcohol and cannabis outlets: analysis of missed doses of methadone during the first, second, and third 90 days of treatment. Am J Drug Alcohol Abuse. 2020;46(1):78‐87. doi: 10.1080/00952990.2019.1620261 [DOI] [PubMed] [Google Scholar]
- 34. Amiri S, Lutz R, Socías ME, McDonell MG, Roll JM, Amram O. Increased distance was associated with lower daily attendance to an opioid treatment program in Spokane County Washington. J Subst Abus Treat. 2018;93:26‐30. doi: 10.1016/j.jsat.2018.07.006 [DOI] [PubMed] [Google Scholar]
- 35. Saloner B, Landis RK, Jayakrishnan R, Stein BD, Barry CL. A bridge too far? Distance to waivered physicians and utilization of buprenorphine treatment for opioid use disorder in West Virginia Medicaid. Subst Abus. 2022;43(1):682‐690. doi: 10.1080/08897077.2021.1986882 [DOI] [PMC free article] [PubMed] [Google Scholar]
- 36. Alderwick H, Hutchings A, Briggs A, Mays N. The impacts of collaboration between local health care and non‐health care organizations and factors shaping how they work: a systematic review of reviews. BMC Public Health. 2021;21(1):753. doi: 10.1186/s12889-021-10630-1 [DOI] [PMC free article] [PubMed] [Google Scholar]
- 37. Landers G, Minyard KJ, Heishman H. How aligning sectors builds resilient, equitable communities. J Public Health Manag Pract. 2022;28(Supplement 4):S118‐S121. doi: 10.1097/PHH.0000000000001454 [DOI] [PubMed] [Google Scholar]
- 38. Jones CM, McCance‐Katz EF. Co‐occurring substance use and mental disorders among adults with opioid use disorder. Drug Alcohol Depend. 2019;197:78‐82. doi: 10.1016/j.drugalcdep.2018.12.030 [DOI] [PubMed] [Google Scholar]
- 39. Krans EE, Bobby S, England M, et al. The pregnancy recovery center: a women‐centered treatment program for pregnant and postpartum women with opioid use disorder. Addict Behav. 2018;86:124‐129. doi: 10.1016/j.addbeh.2018.05.016 [DOI] [PubMed] [Google Scholar]
- 40. Urbanoski K, Joordens C, Kolla G, Milligan K. Community networks of services for pregnant and parenting women with problematic substance use. PLoS One. 2018;13(11):e0206671. doi: 10.1371/journal.pone.0206671 [DOI] [PMC free article] [PubMed] [Google Scholar]
- 41. Yeager VA, Menachemi N, Savage GT, Ginter PM, Sen BP, Beitsch LM. Using resource dependency theory to measure the environment in health care organizational studies: a systematic review of the literature. Health Care Manag Rev. 2014;39(1):50‐65. doi: 10.1097/HMR.0b013e3182826624 [DOI] [PubMed] [Google Scholar]
- 42. U.S. Census Bureau QuickFacts: Jefferson County, Kentucky. Accessed March 11, 2023 https://www.census.gov/quickfacts/jeffersoncountykentucky
- 43. Flippen A. Where are the hardest places to live in the U.S.? The New York Times. https://www.nytimes.com/2014/06/26/upshot/where-are-the-hardest-places-to-live-in-the-us.html Published June 26, 2014. Accessed August 11, 2023.
- 44. U.S. Census Bureau QuickFacts: Clay County, Kentucky. Accessed March 11, 2023 https://www.census.gov/quickfacts/fact/table/claycountykentucky/PST045222
- 45. Surgo Ventures – The U.S. Maternal Vulnerability Index (MVI). Accessed March 11, 2023 https://mvi.surgoventures.org/
- 46. Borgatti SP, Everett MG, Johnson JC. Analyzing Social Networks. Sage; 2018. [Google Scholar]
- 47. Borgatti SP. Structural holes: unpacking Burt's redundancy measures. Connections. 1997;20(1):35‐38. [Google Scholar]
- 48. Freeman LC. Centrality in social networks conceptual clarification. Soc Networks. 1978;1(3):215‐239. doi: 10.1016/0378-8733(78)90021-7 [DOI] [Google Scholar]
- 49. Burt RS. Structural Holes: The Social Structure of Competition. Harvard University Press; 1992. Accessed July 26, 2023. https://www.jstor.org/stable/j.ctv1kz4h78 [Google Scholar]
- 50. Burt RS. The social capital of structural holes. New Econ Sociol Dev Emerg Field. 2002;148(90):122. [Google Scholar]
- 51. Borgatti SP, Everett MG, Freeman LC. Ucinet for Windows: Software for Social Network Analysis. 2002.
- 52. Trinh HQ. Strategic management in local hospital markets: service duplication or service differentiation. BMC Health Serv Res. 2020;20(1):880. doi: 10.1186/s12913-020-05728-y [DOI] [PMC free article] [PubMed] [Google Scholar]
- 53. Ghiasi A, Weech‐Maldonado R, Zengul F, Puro N. Contextual factors and business strategy choice: the case of us hospitals. Health Serv Manag Res. 2023;36(2):127‐136. doi: 10.1177/09514848221115093 [DOI] [PubMed] [Google Scholar]
- 54. Hogg RA, Mays GP, Mamaril CB. Hospital contributions to the delivery of public health activities in US metropolitan areas: national and longitudinal trends. Am J Public Health. 2015;105(8):1646‐1652. doi: 10.2105/AJPH.2015.302563 [DOI] [PMC free article] [PubMed] [Google Scholar]
- 55. Hogg‐Graham R, Mamaril CB, Benitez JA, Gatton K, Mays GP. Impact of state Medicaid expansion on cross‐sector health and social service networks: evidence from a longitudinal cohort study. Health Serv Res. 2023;58(3):634‐641. doi: 10.1111/1475-6773.14144 [DOI] [PMC free article] [PubMed] [Google Scholar]
- 56. Owsley KM, Hamer MK, Mays GP. The growing divide in the composition of public health delivery systems in US rural and urban communities, 2014–2018. Am J Public Health. 2020;110(S2):S204‐S210. doi: 10.2105/AJPH.2020.305801 [DOI] [PMC free article] [PubMed] [Google Scholar]
- 57. Malone TL, Planey AM, Bozovich LB, Thompson KW, Holmes GM. The economic effects of rural hospital closures. Health Serv Res. 2022;57(3):614‐623. doi: 10.1111/1475-6773.13965 [DOI] [PMC free article] [PubMed] [Google Scholar]
- 58. Probst J, Eberth JM, Crouch E. Structural urbanism contributes to poorer health outcomes for rural America. Health Aff (Millwood). 2019;38(12):1976‐1984. doi: 10.1377/hlthaff.2019.00914 [DOI] [PubMed] [Google Scholar]
- 59. Dingel JI, Gottlieb JD, Lozinski M, Mourot P. Market size and trade in medical services. Published online March 2023. doi: 10.3386/w31030 [DOI]
- 60. Rural health for Kentucky Overview – Rural Health Information Hub. Accessed August 17, 2023 https://www.ruralhealthinfo.org/states/kentucky
- 61. Amarashingham R, Xie B, Karam A, Nguyen N, Kapoor B. Using community partnerships to integrate health and social services for high‐need, high‐cost patients. Issue Brief (Commonw Fund). 2018;2018:1‐11. [PubMed] [Google Scholar]
- 62. Riley WJ, Love K, Runger G, Shafer MS, Pine K, Mays G. Framework for multisector alignment research. J Public Health Manag Pract. 2021;27(5):E205‐E209. doi: 10.1097/PHH.0000000000001275 [DOI] [PMC free article] [PubMed] [Google Scholar]
- 63. Smith SA, Mays GP, Felix HC, Tilford JM, Curran GM, Preston MA. Impact of economic constraints on public health delivery systems structures. Am J Public Health. 2015;105(9):e48‐e53. doi: 10.2105/AJPH.2015.302769 [DOI] [PMC free article] [PubMed] [Google Scholar]
Associated Data
This section collects any data citations, data availability statements, or supplementary materials included in this article.
Supplementary Materials
Data S1. Supplement 1: Survey Items, by Construct.
Supplement 2. Overall Density and Centralization, Urban Jefferson County Compared to Rural Clay County.
Supplement 3. Cross‐Sector Alignment, Between Group Network Density, Urban Jefferson County Compared to Rural Clay County.
Supplement 4. Organizations and sectors with largest degree centrality and effective size by construct item.