Abstract
Innate lymphoid cells (ILCs) can quickly switch from a quiescent state to an active state and rapidly produce effector molecules that provide critical early immune protection. How the post-transcriptional machinery processes different stimuli and initiates robust gene expression in ILCs is poorly understood. Here, we show that deletion of the N6-methyladenosine (m6A) writer protein METTL3 has little impact on ILC homeostasis or cytokine-induced ILC1 or ILC3 responses but significantly diminishes ILC2 proliferation, migration and effector cytokine production and results in impaired antihelminth immunity. m6A RNA modification supports an increase in cell size and transcriptional activity in activated ILC2s but not in ILC1s or ILC3s. Among other transcripts, the gene encoding the transcription factor GATA3 is highly m6A methylated in ILC2s. Targeted m6A demethylation destabilizes nascent Gata3 mRNA and abolishes the upregulation of GATA3 and ILC2 activation. Our study suggests a lineage-specific requirement of m6A for ILC2 responses.
Innate lymphoid cells (ILCs) directly respond to alarmin cytokine signals released from inflamed or injured tissues, rapidly produce an array of ‘effector’ molecules and play important roles in host defense, allergic inflammation, autoimmune disorders, tissue remolding, metabolic homeostasis and tumor immunity1. Mature ILCs are largely quiescent in the steady state, but during infection or inflammation, they can swiftly switch to an active state2. Tissue- or myeloid cell-derived alarmins interleukin-25 (IL-25) and IL-33 are the major activators for group 2 ILCs (ILC2s)3,4. Cytokines such as TSLP, IL-7 and IL-2, which activate the transcription factor STAT, neuropeptides such as NMU, VIP and CGRP, lipid mediators such as PGD2, LTD4 and LXA4 and surface receptors such as PD-1, ICOS and KLRG1, serve as co-stimulatory or co-inhibitor signals and strongly influence ILC2 responses5–16. However, how the cellular post-transcriptional machinery processes extracellular stimuli and triggers rapid proliferation and robust cytokine production in ILCs is not yet understood.
N6-methyladenosine (m6A) is the most prevalent and abundant post-transcriptional modification on eukaryotic mRNAs and contributes to fundamental aspects of RNA metabolism, including pre-mRNA splicing, nuclear transport, stability and translation17. The m6A writer complex, which comprises the core methyltransferase METTL3 and its adaptors, adds m6A on adenine in a conserved consensus sequence RRACH (R = G or A; H: U > A > C). m6A erasers, such as ALKBH5 and FTO, remove m6A from mRNA. m6A can bind specific nuclear reader proteins, mainly YTHDC1, which affect splicing and other nuclear processes, such as mRNA export. After mRNA export to the cytoplasm, m6A binds to specific reader proteins, including YTHDF1, YTHDF2 and YTHDF3, that affect the stability, translation and/or localization of the mRNA18. m6A plays a critical role in many biological processes, in particular cell fate decisions and response to stimuli18,19, and is critical for hematopoietic stem cell differentiation, T cell homeostasis, B cell development and immunoglobulin class switching20–24. However, the role of m6A in ILCs is still unknown.
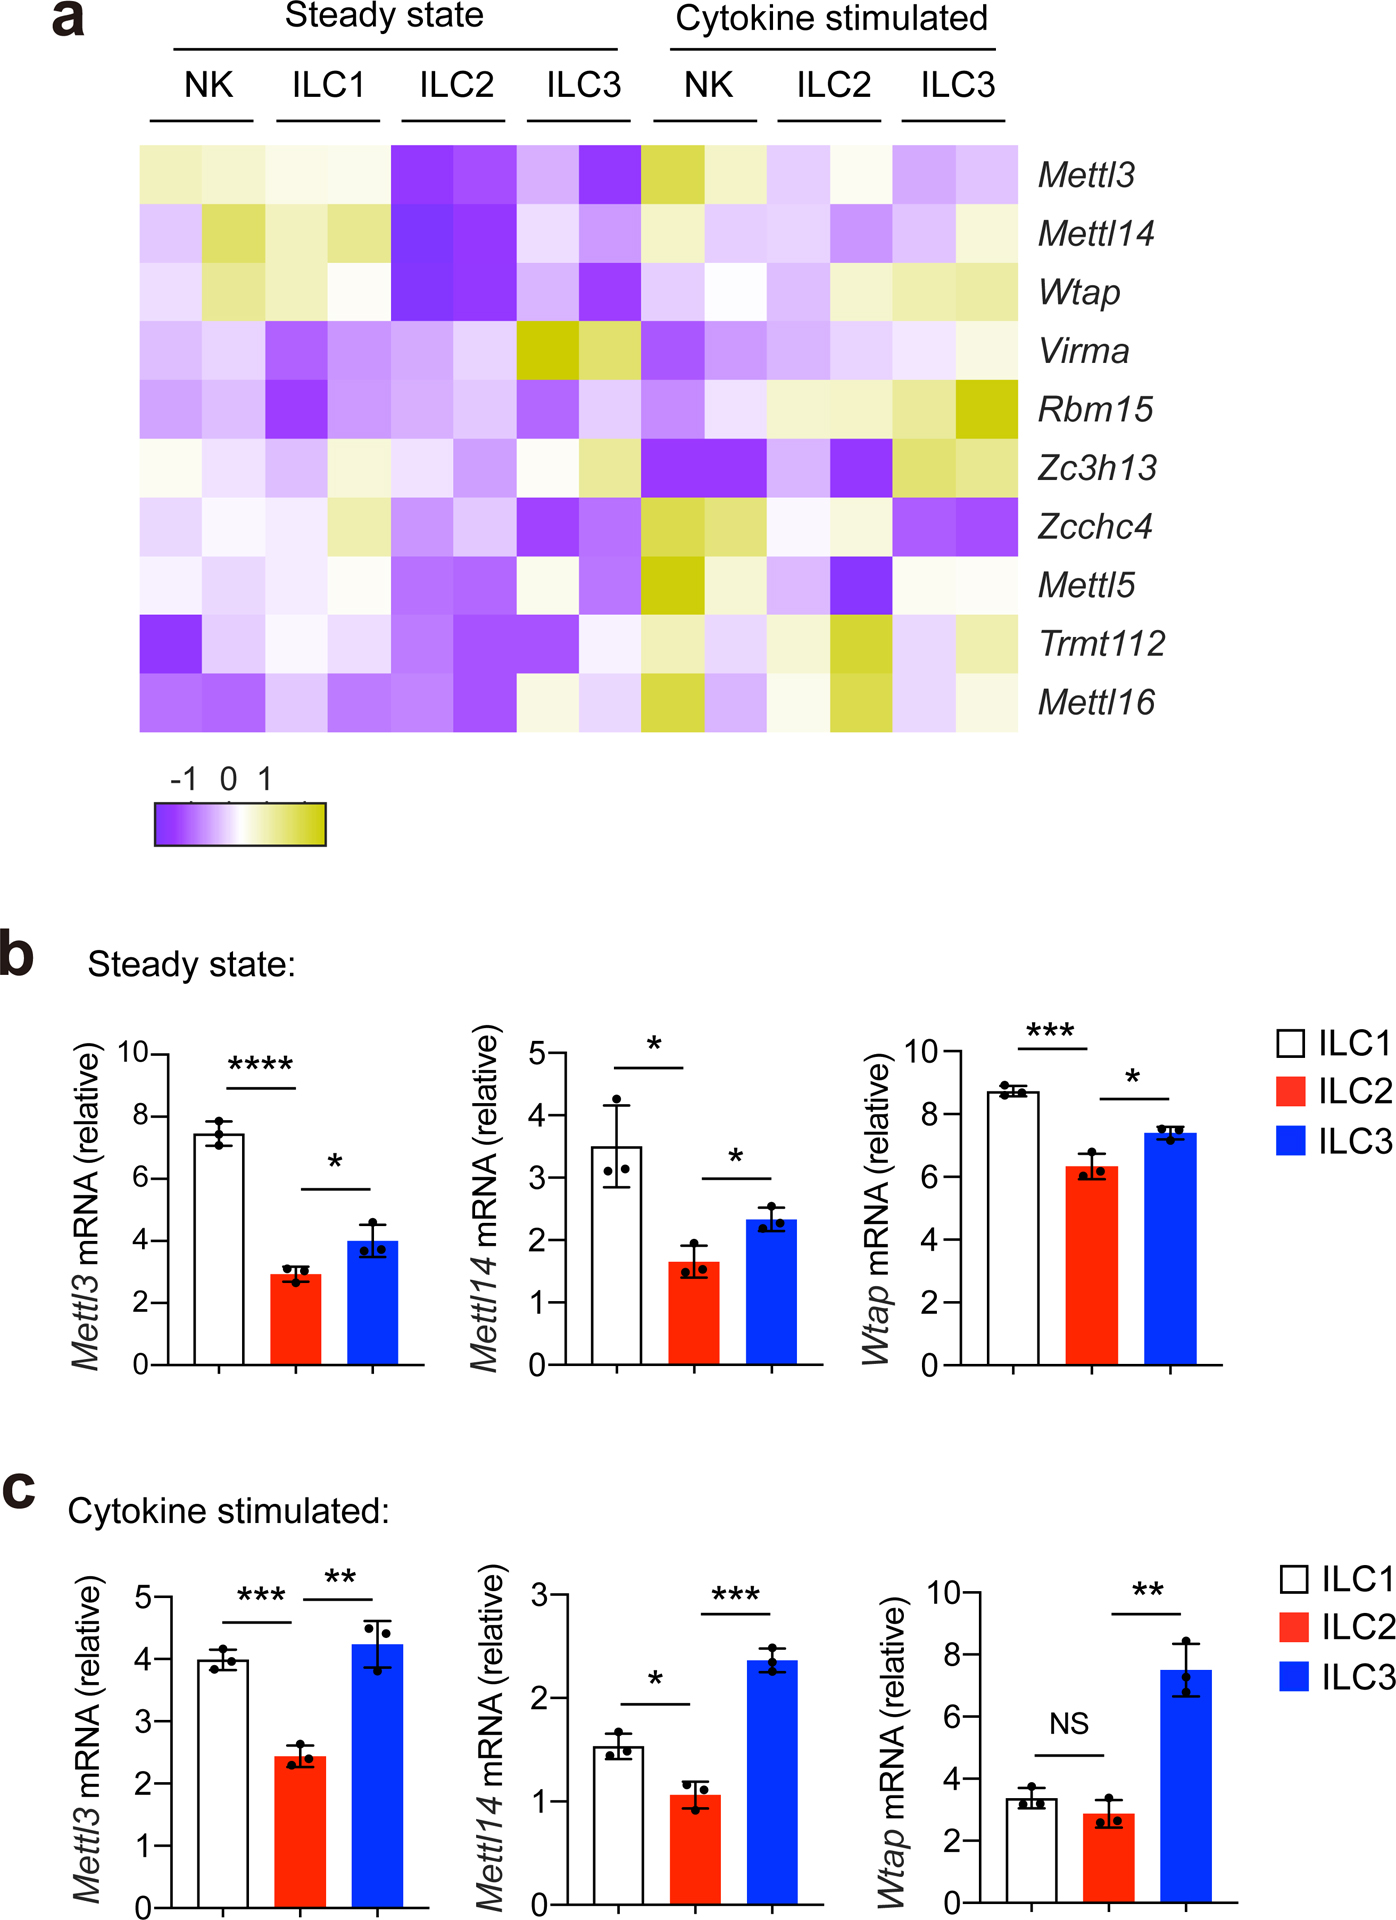
To investigate the role of m6A in regulating homeostasis and immune responses in ILCs, we first examined the expression of m6A-associated genes in ILC1s, ILC2s and ILC3s. METTL3, METTL14 and WTAP are generally considered as the three key components of the m6A writer complex that adds m6A modifications on mRNAs. METTL3 represents the catalytic subunit with methyltransferase activity, METTL14 acts as the RNA-binding platform, and WTAP is a regulator of complex assembly25. Analysis of published ILC RNA-sequencing data26 indicated that at steady state, natural killer (NK) cells and ILC1s expressed slightly more Mettl3, Mettl14 and Wtap than ILC2s or ILC3s (Extended Data Fig. 1a), which was confirmed by real-time quantitative PCR with reverse transcription (RT–qPCR) in liver DX5−NK1.1+ ILC1s, intestinal KLRG1+ ILC2s sorted from naive C57BL/6 (B6) mice and RORγt+ ILC3s sorted from Rorc-egfp mice (Extended Data Fig. 1b). There was no notable difference in the expression of mRNAs encoding the ribosomal RNA m6A writers METTL5 and TRMT112 or the U6 small nuclear RNA methyltransferase METTL16 among ILC1s, ILC2s and ILC3s (Extended Data Fig. 1a). RT–qPCR indicated comparable expression of Mettl3, Mettl14 and Wtap mRNA in liver DX5−NK1.1+ ILC1s, intestinal KLRG1+ ILC2s sorted from B6 mice that had received intraperitoneal (i.p.) injections of IL-12 + IL-18 or IL-25, respectively, and RORγt+ ILC3s sorted from Rorc-egfp mice that had received i.p. injections of IL-1β + IL-23 (Extended Data Fig. 1c), although levels of Mettl3, Mettl14 and Wtap mRNA were slightly lower in IL-25-activated intestinal KLRG1+ ILC2s than in activated liver DX5−NK1.1+ ILC1s and intestinal RORγt+ ILC3s (Extended Data Fig. 1c).
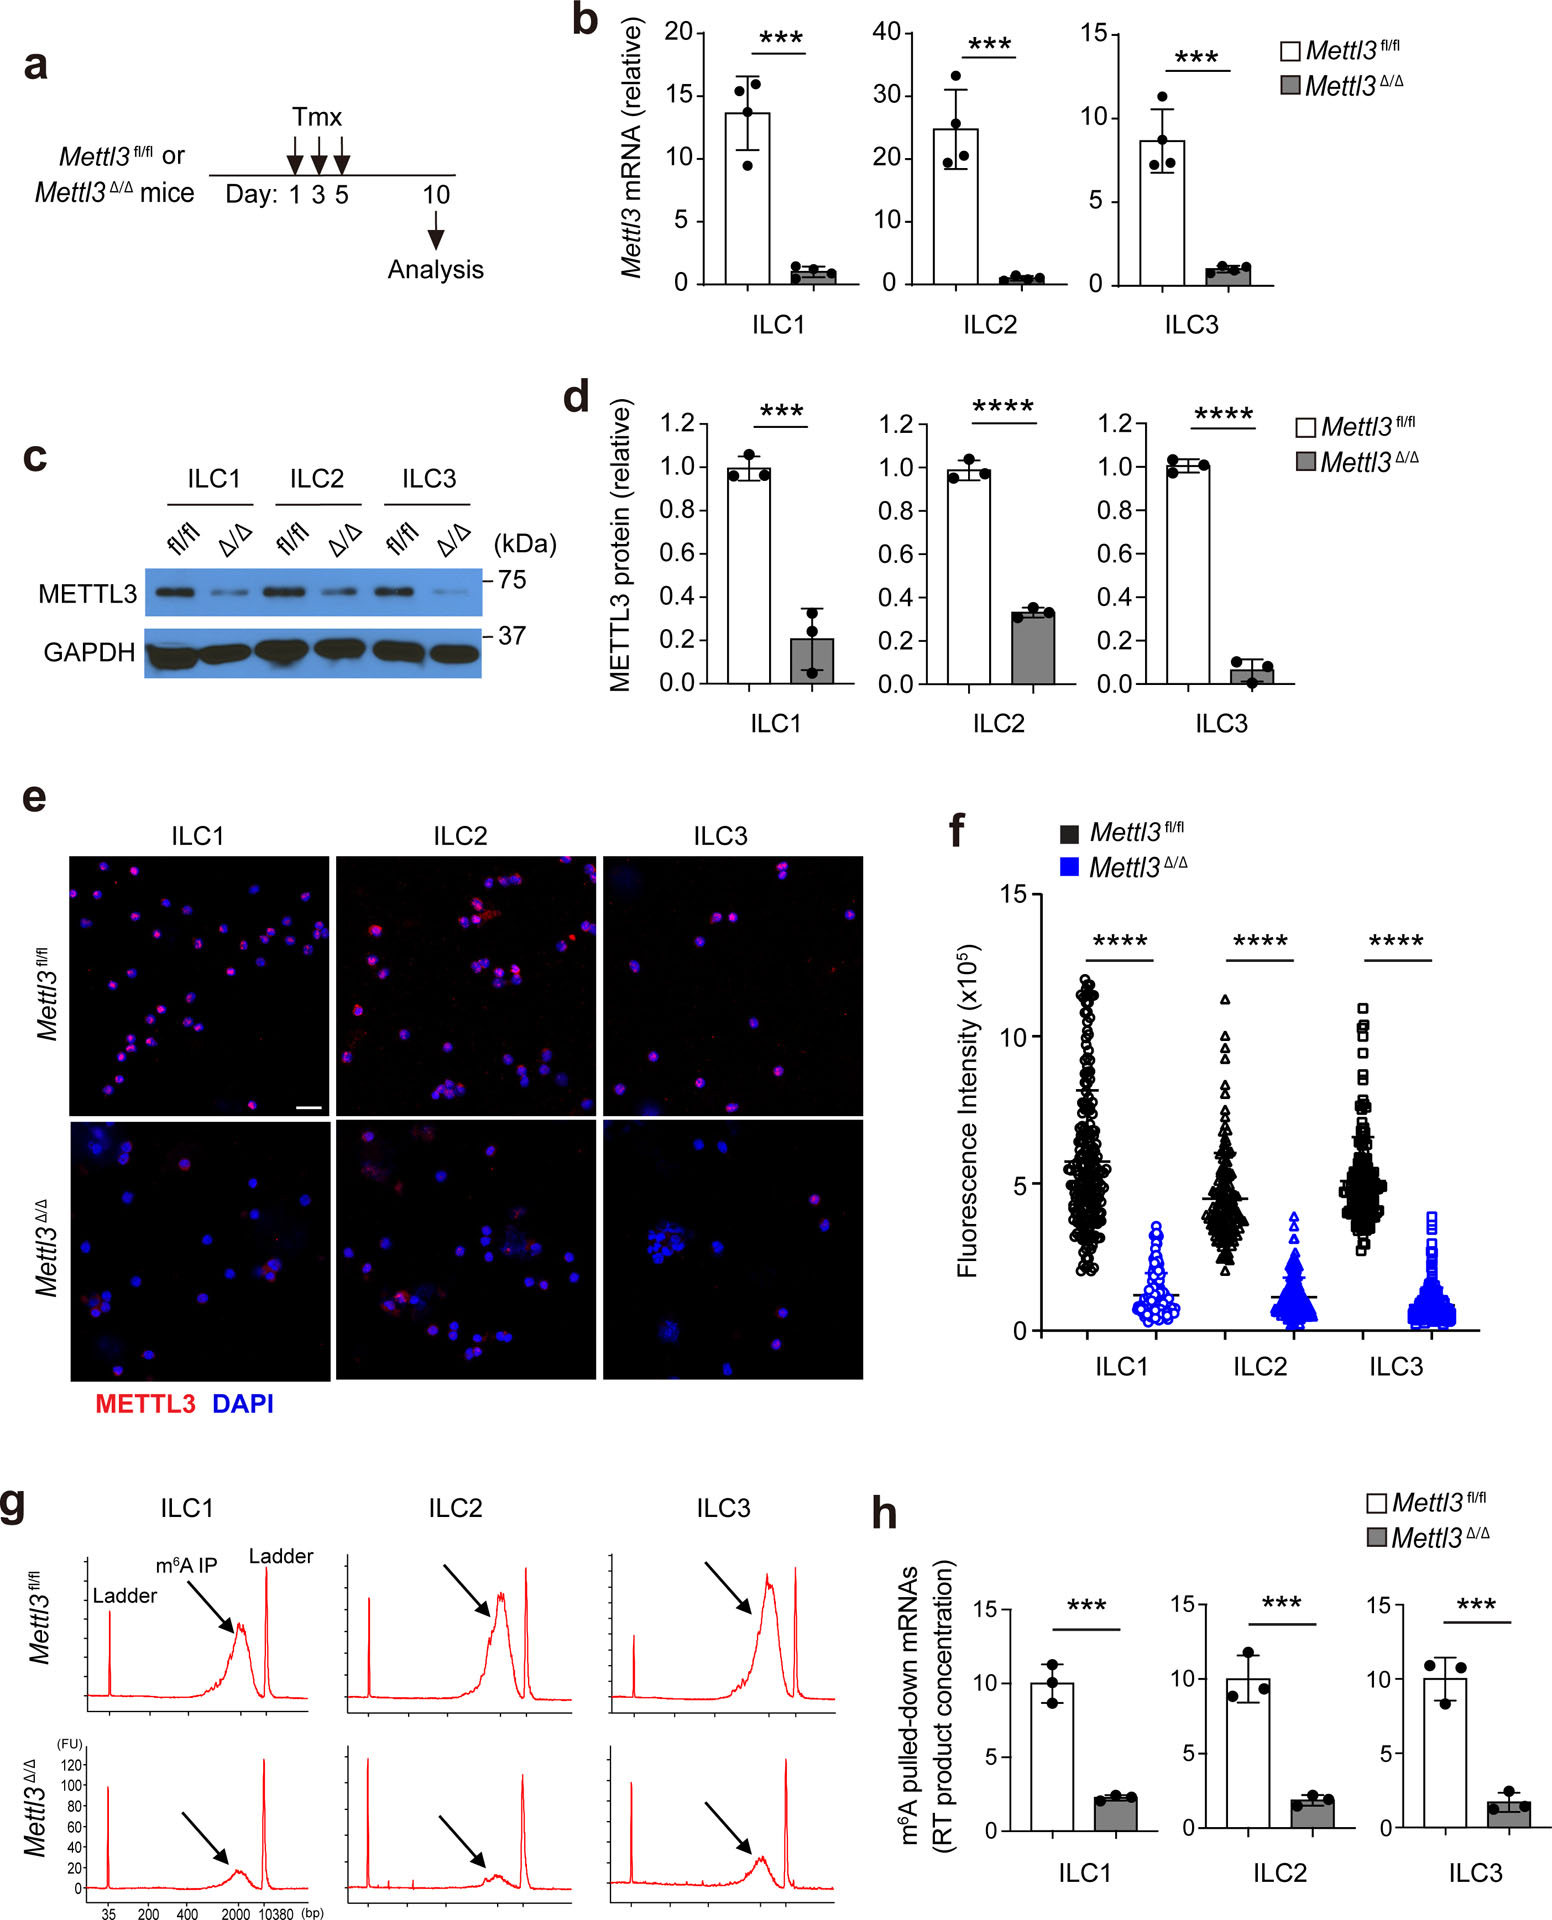
Because the expression of these m6A writers in ILCs suggested a potential regulatory role for m6A modification, R26CreERMettl3fl/fl mice (referred to hereafter as Mettl3Δ/Δ mice) were treated with three 2-μg doses of tamoxifen i.p. to delete Mettl3 (Extended Data Fig. 2a). RT–qPCR analysis of bulk mRNA isolated from sorted small intestine NK1.1+ ILC1s, KLRG1+ ILC2s and Thy1+NK1.1–KLRG1– ILC3s indicated loss of 93% of Mettl3 mRNAs in NK1.1+ ILC1s, 96% of Mettl3 mRNAs in KLRG1+ ILC2s and 88% of Mettl3 mRNAs in Thy1+NK1.1−KLRG1− ILC3s in Mettl3Δ/Δ mice compared to in Mettl3fl/fl littermates (Extended Data Fig. 2b). Immunoblotting analysis indicated an 80% decrease in METTL3 protein expression in NK1.1+ ILC1s, a 70% decrease in KLRG1+ ILC2s and a more than 90% decrease in Thy1+NK1.1−KLRG1− ILC3s isolated from the intestines of Mettl3Δ/Δ mice compared to in Mettl3fl/fl mice (Extended Data Fig. 2c,d). Next, we used immunofluorescence staining to assess the depletion of METTL3 protein in sorted ILC1s, ILC2s and ILC3s at the single-cell level. Compared to the corresponding Mettl3fl/fl ILC subsets, the vast majority of ILC1s, ILC2s and ILC3s sorted from small intestines of Mettl3Δ/Δ mice showed a significant loss of METTL3 protein (Extended Data Fig. 2e,f). Mettl3 deletion leads to a near-complete depletion of m6A on mRNAs19. Immunoprecipitation with an antibody to m6A indicated that 75% of m6A modifications on bulk mRNA from sorted NK1.1+ ILC1s and 80% of m6A modifications on bulk mRNA from sorted KLRG1+ ILC2s and Thy1+NK1.1−KLRG1− ILC3s was lost in Mettl3Δ/Δ mice compared to in Mettl3fl/fl littermates (Extended Data Fig. 2g,h).
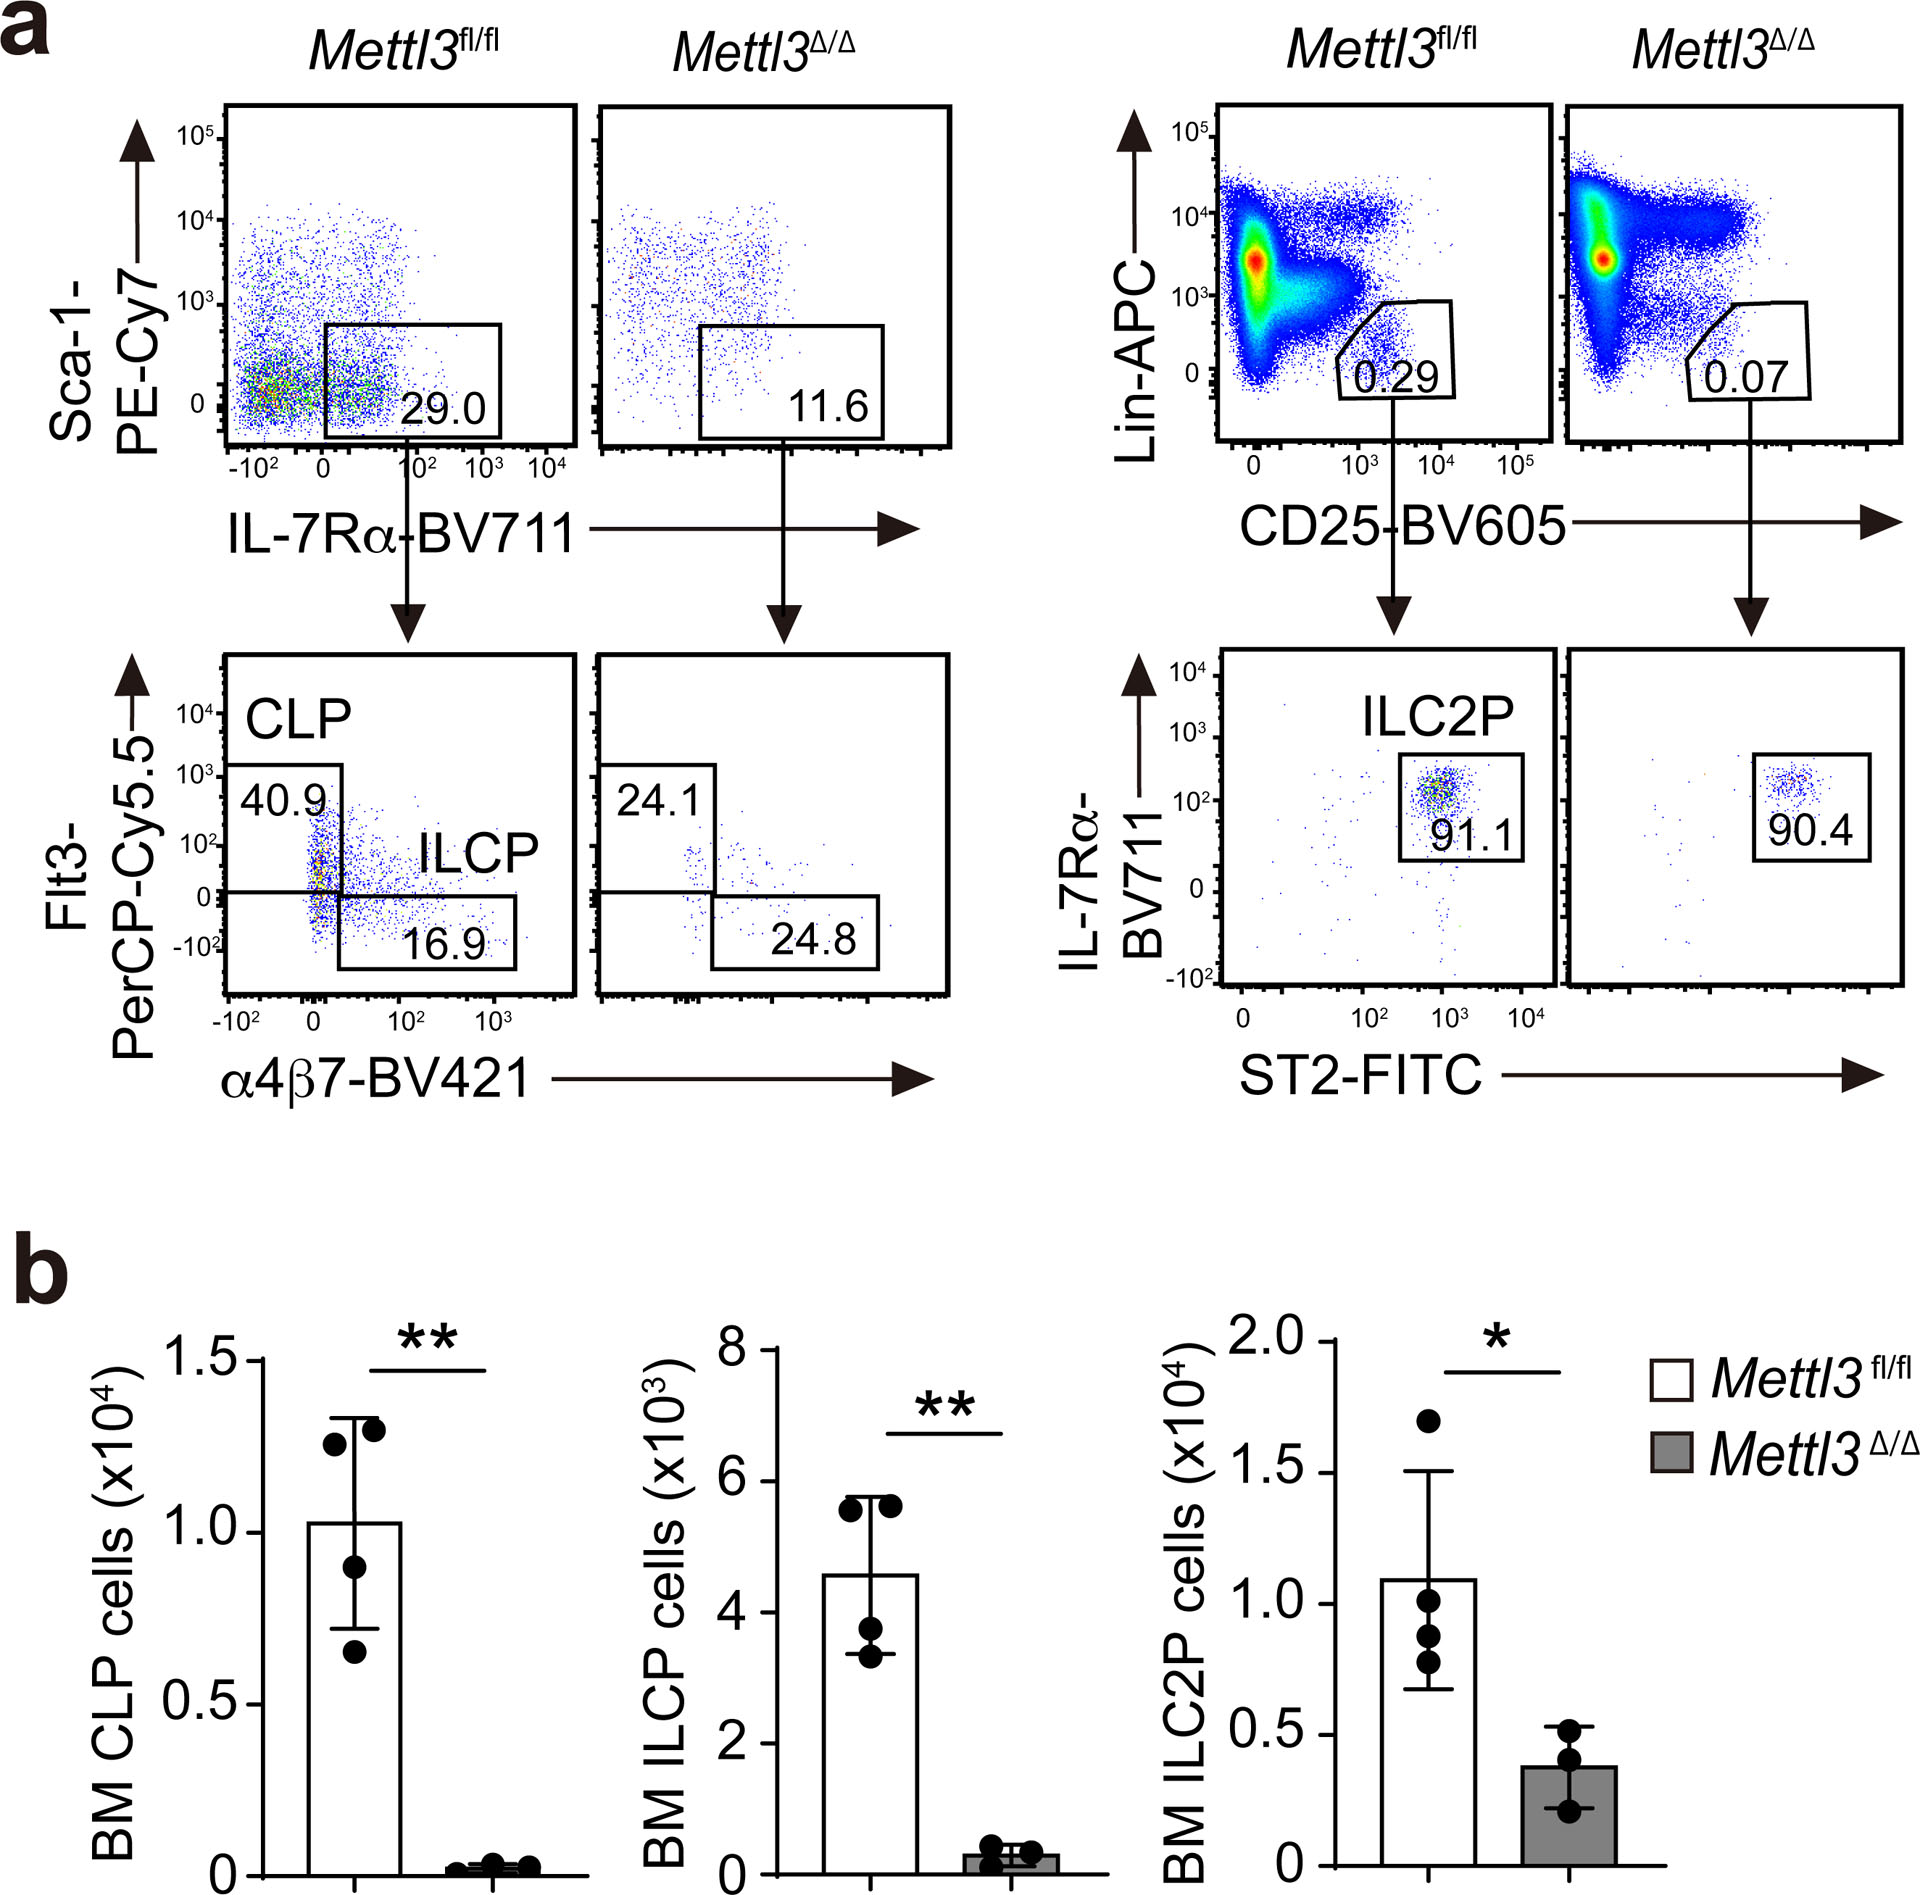
Inducible deletion of Mettl3 in Mettl3Δ/Δ mice did not affect the number of mature NK1.1+ ILC1s, KLRG1+ ILC2s or RORγt+ ILC3s at steady state in the small intestine (Fig. 1a,b) or in the lungs (Fig. 1c,d). To test whether m6A modifications regulated ILC maintenance cell intrinsically, we intravenously (i.v.) transferred an equal mix of total bone marrow (BM) cells from Mettl3Δ/Δ and wild-type mice into Rag2−/−Il2rg−/− mice, followed by deletion of Mettl3 in the Mettl3Δ/Δ donor cells by i.p. injection of tamoxifen 1 month after transfer, a period in which BM progenitors populate the tissues with mature ILCs. Four weeks after tamoxifen treatment, the ratio of wild-type to Mettl3Δ/Δ donor NK1.1+ ILC1s, KLRG1+ ILC2s or RORγt+ ILC3s was 1:1 (Fig. 1e), suggesting that m6A was dispensable for the maintenance of ILCs at steady state. In the BM, at steady state, Mettl3Δ/Δ mice had a 95–99% decrease in the number of common lymphoid progenitors, ILC common progenitors and ILC2 progenitors compared to Mettl3fl/fl littermates (Extended Data Fig. 3). These results indicated that tamoxifen-induced deletion of Mettl3 markedly affected ILC development but not the maintenance of mature ILCs at steady state, consistent with previous reports that mature ILCs are largely self-maintained, and BM ILC progenitors have little contribution to ILC homeostasis in adult animals2,27,28.
Fig. 1. m6A is dispensable for mature ILC maintenance at steady state.
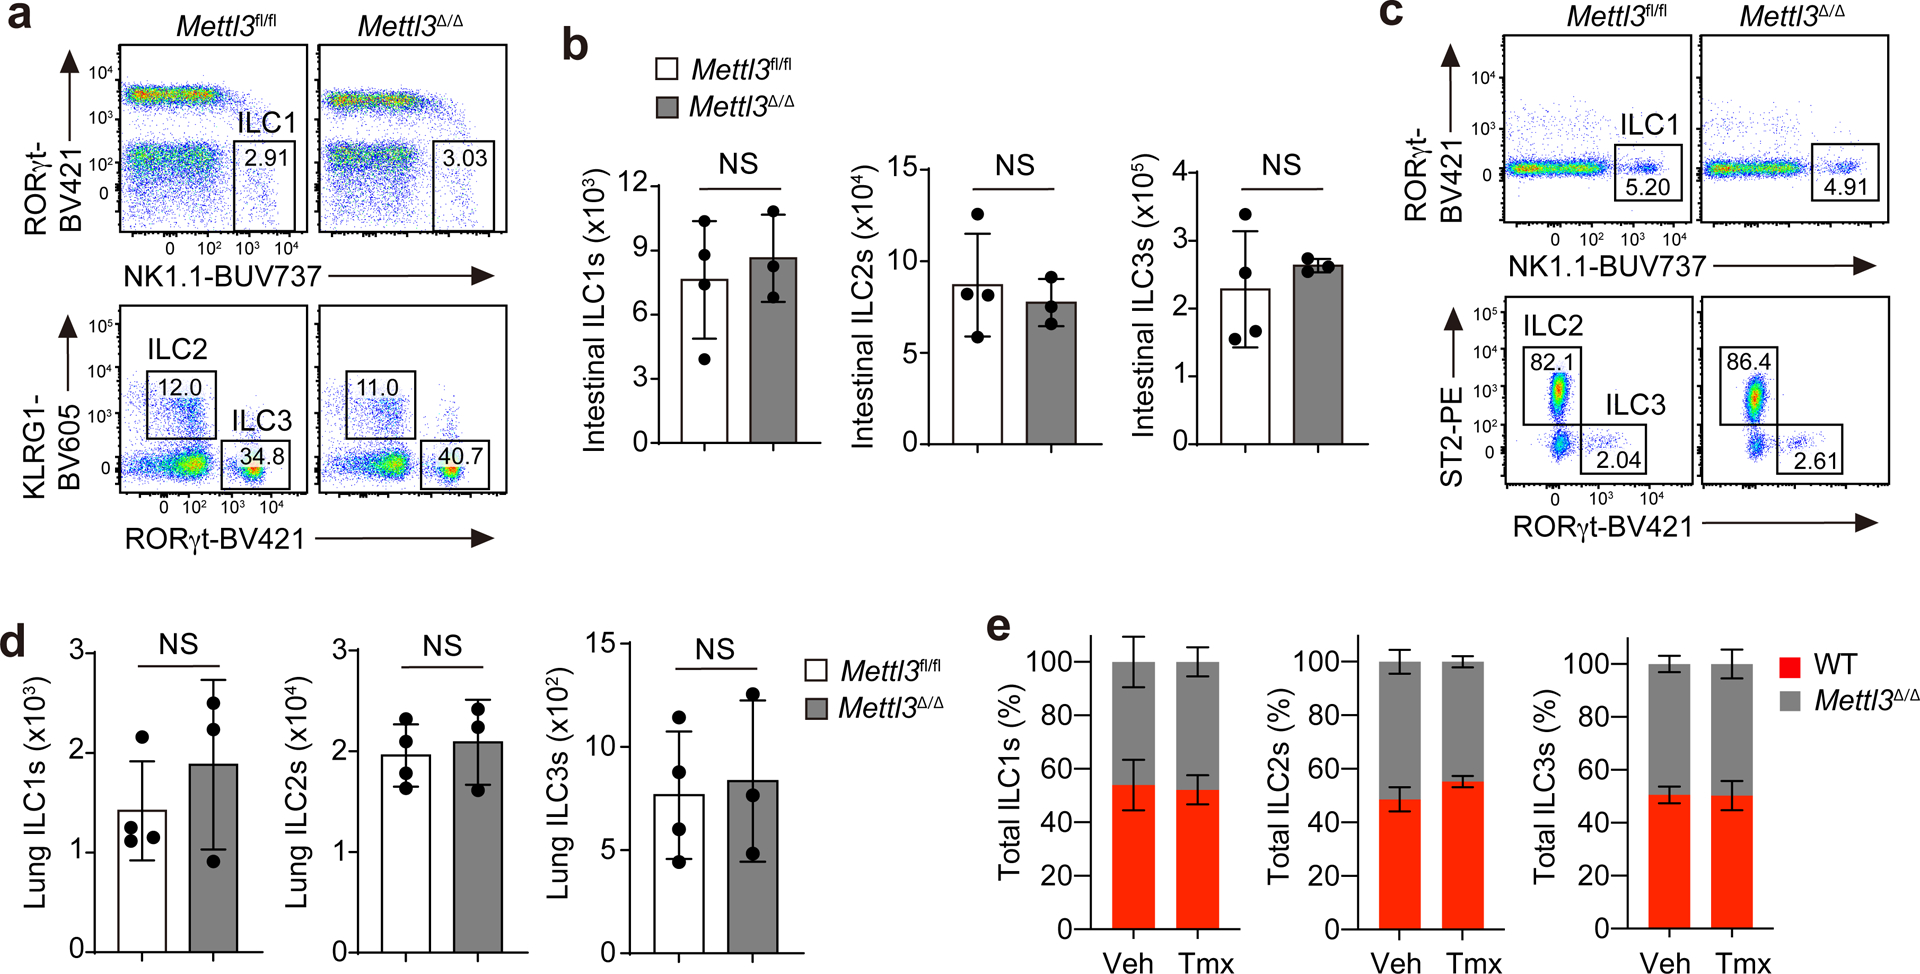
a,b, Representative flow cytometry (a) and quantification (b) of intestinal ILCs pregated as live CD45+Lin−Thy1+ and further gated as RORγt−NK1.1+ ILC1s, KLRG1+ ILC2s and RORγt+ ILC3s on day 5 after the last tamoxifen (Tmx) dose in Mettl3Δ/Δ mice or Mettl3fl/fl littermate controls treated i.p. with tamoxifen every other day for three doses; not significant (NS) P = 0.6189 (left), NS P = 0.6149 (middle), NS P = 0.5229 (right; b). c,d, Representative flow cytometry (c) and quantification (d) of lung ILCs in mice as in a; NS P = 0.4020 (left), NS P = 0.6529 (middle), NS P = 0.8045 (right; d). e, Ratios of wild-type B6.SJL (WT) and Mettl3Δ/Δ ILCs on day 60 after a mixed transfer of total wild-type and Mettl3Δ/Δ BM cells at a ratio of 1:1 into Rag2−/−Il2rg−/− recipient mice that received three doses of tamoxifen from days 28 to 32 after transfer. Veh, vehicle. Data were analyzed by unpaired two-tailed t-test; n = 3 or 4 in each group in b, d and e. Data are shown as mean ± s.d. Results are representative of three independent experiments.
We next tested whether m6A was required for ILC activation. Injection of IL-12 + IL-18 or IL-1β + IL-23 i.p. daily for 3 d induced the proliferation of liver NK1.1+ ILC1s or intestinal RORγt+ ILC3s, respectively, according to elevated expression of Ki-67, with similar percentages of Ki-67+ liver NK1.1+ ILC1s or intestinal RORγt+ ILC3s in Mettl3fl/fl and Mettl3Δ/Δ mice (Fig. 2a–d). In response to i.p. injection of IL-25, intestinal KLRG1+ ILC2s in Mettl3Δ/Δ mice showed reduced expression of Ki-67 (Fig. 2e) and reduced expression of Il5 and Il13 mRNA compared to those observed in Mettl3fl/fl littermates (Fig. 2f), indicating that Mettl3 deletion significantly attenuated IL-25-induced ILC2 responses.
Fig. 2. m6A is required for cytokine-induced ILC2 responses.
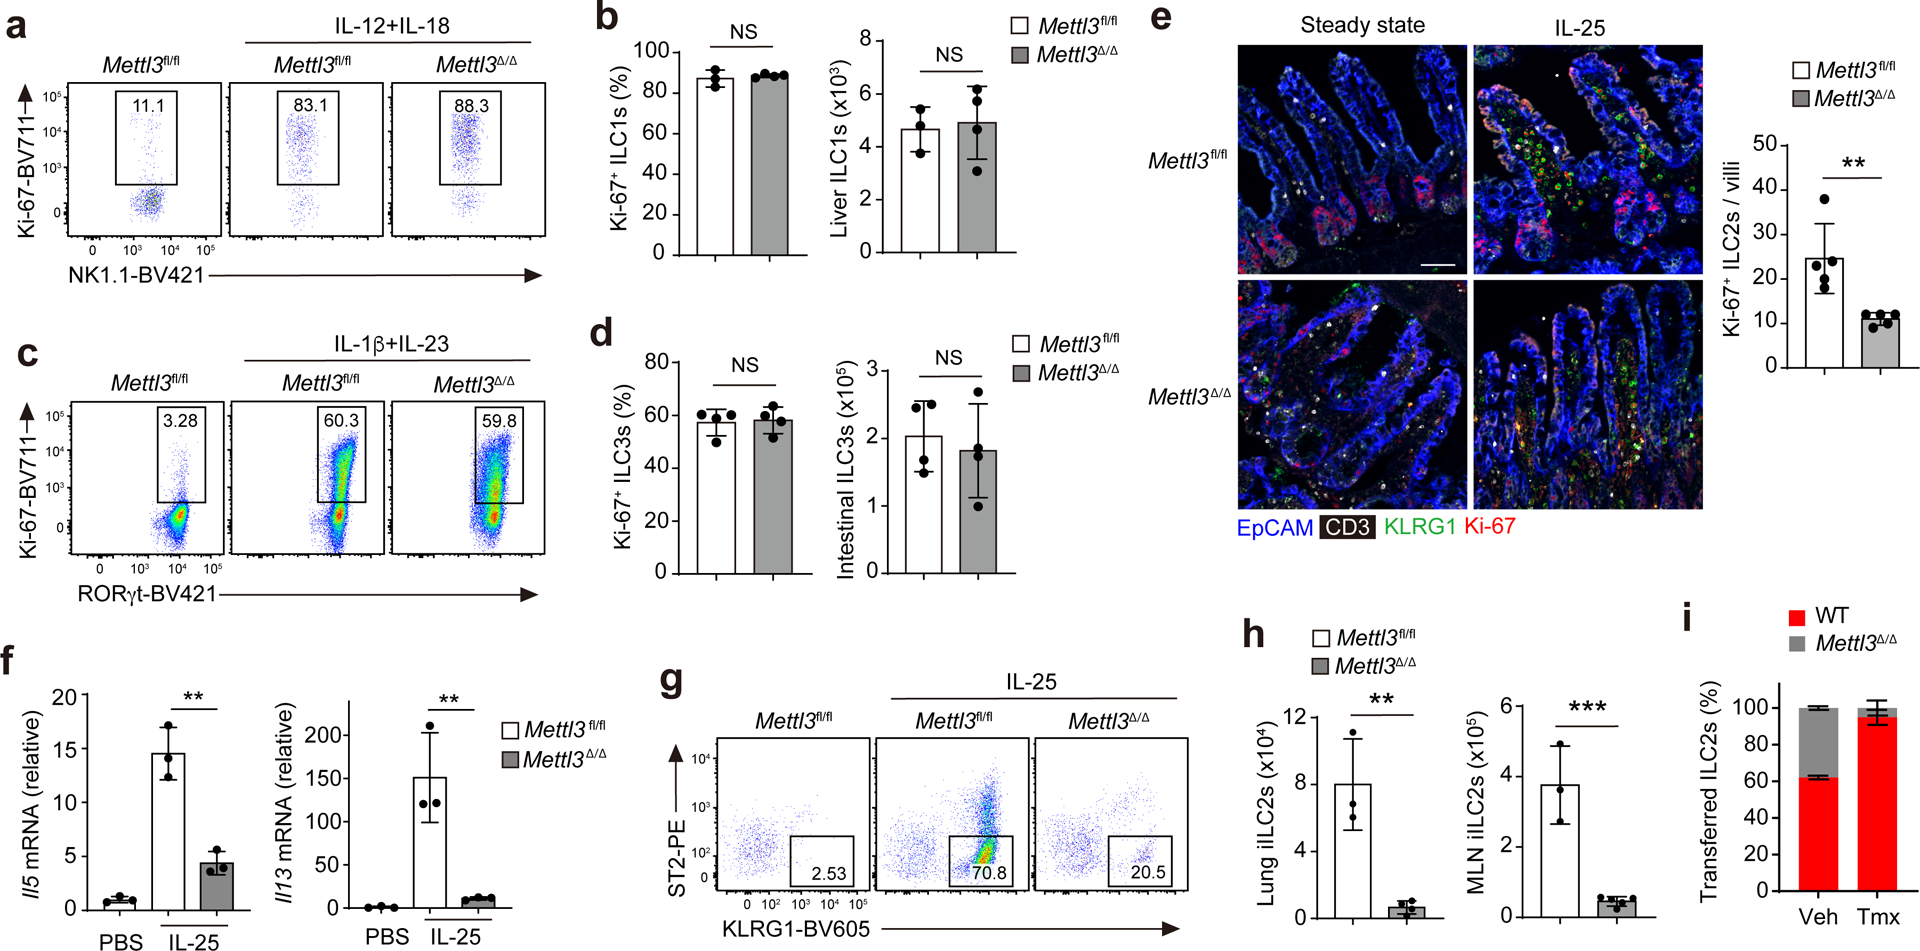
a,b, Representative flow cytometry (a) and quantification (b) of the percentage of Ki-67+ cells and total cell number of liver CD45+Lin−Thy1+NK1.1+ ILC1s after 3 d of IL-12 + IL-18 treatment in Mettl3Δ/Δ and Mettl3fl/fl mice that received three doses of tamoxifen before cytokine treatment; NS P = 0.5363 (left) and NS P = 0.7907 (right; b). c,d, Representative flow cytometry (c) and quantification (d) of the percentage of Ki-67+ cells and total cell number of small intestine CD45+Lin−Thy1+RORγt+ ILC3s after 3 d of IL-1β + IL-23 treatment in Mettl3Δ/Δ and Mettl3fl/fl mice that received three doses of tamoxifen before cytokine treatment; NS P = 0.8134 (left) and NS P = 0.6416 (right; d). e, Representative immunofluorescence imaging and quantification of the percentage of Ki-67+ small intestine CD3−KLRG1+ ILC2s after 3 d of IL-25 treatment in Mettl3Δ/Δ and Mettl3fl/fl mice that received three doses of tamoxifen before cytokine treatment; **P = 0.0052; scale bar, 50 μm. f, RT–qPCR analysis of Il5 and Il13 mRNAs in tissue from the small intestine of mice as in e; ** P = 0.0027 (left) and **P = 0.0004 (right). g,h, Representative flow cytometry (lung; g) and quantification (lung and MLNs; h) of CD45+Lin−Thy1+ST2−KLRG1hi iILC2s of the mice as in e. In h, **P = 0.0027 (left) and ***P = 0.0096 (right). i, Ratios of wild-type B6.SJL (WT) and Mettl3Δ/Δ iILC2s in the lungs on day 16 after transfer of wild-type and Mettl3Δ/Δ intestinal ILC2s at a ratio of 1:1 into Rag2−/−Il2rg−/− recipient mice that received three doses of tamoxifen from days 5 to 9 and three injections of IL-25 from days 13 to 15 after transfer. Data were analyzed by unpaired two-tailed t-test; n = 3–5 in b, d, e, f, h and i. Data are shown as mean ± s.d. Results are representative of three independent experiments.
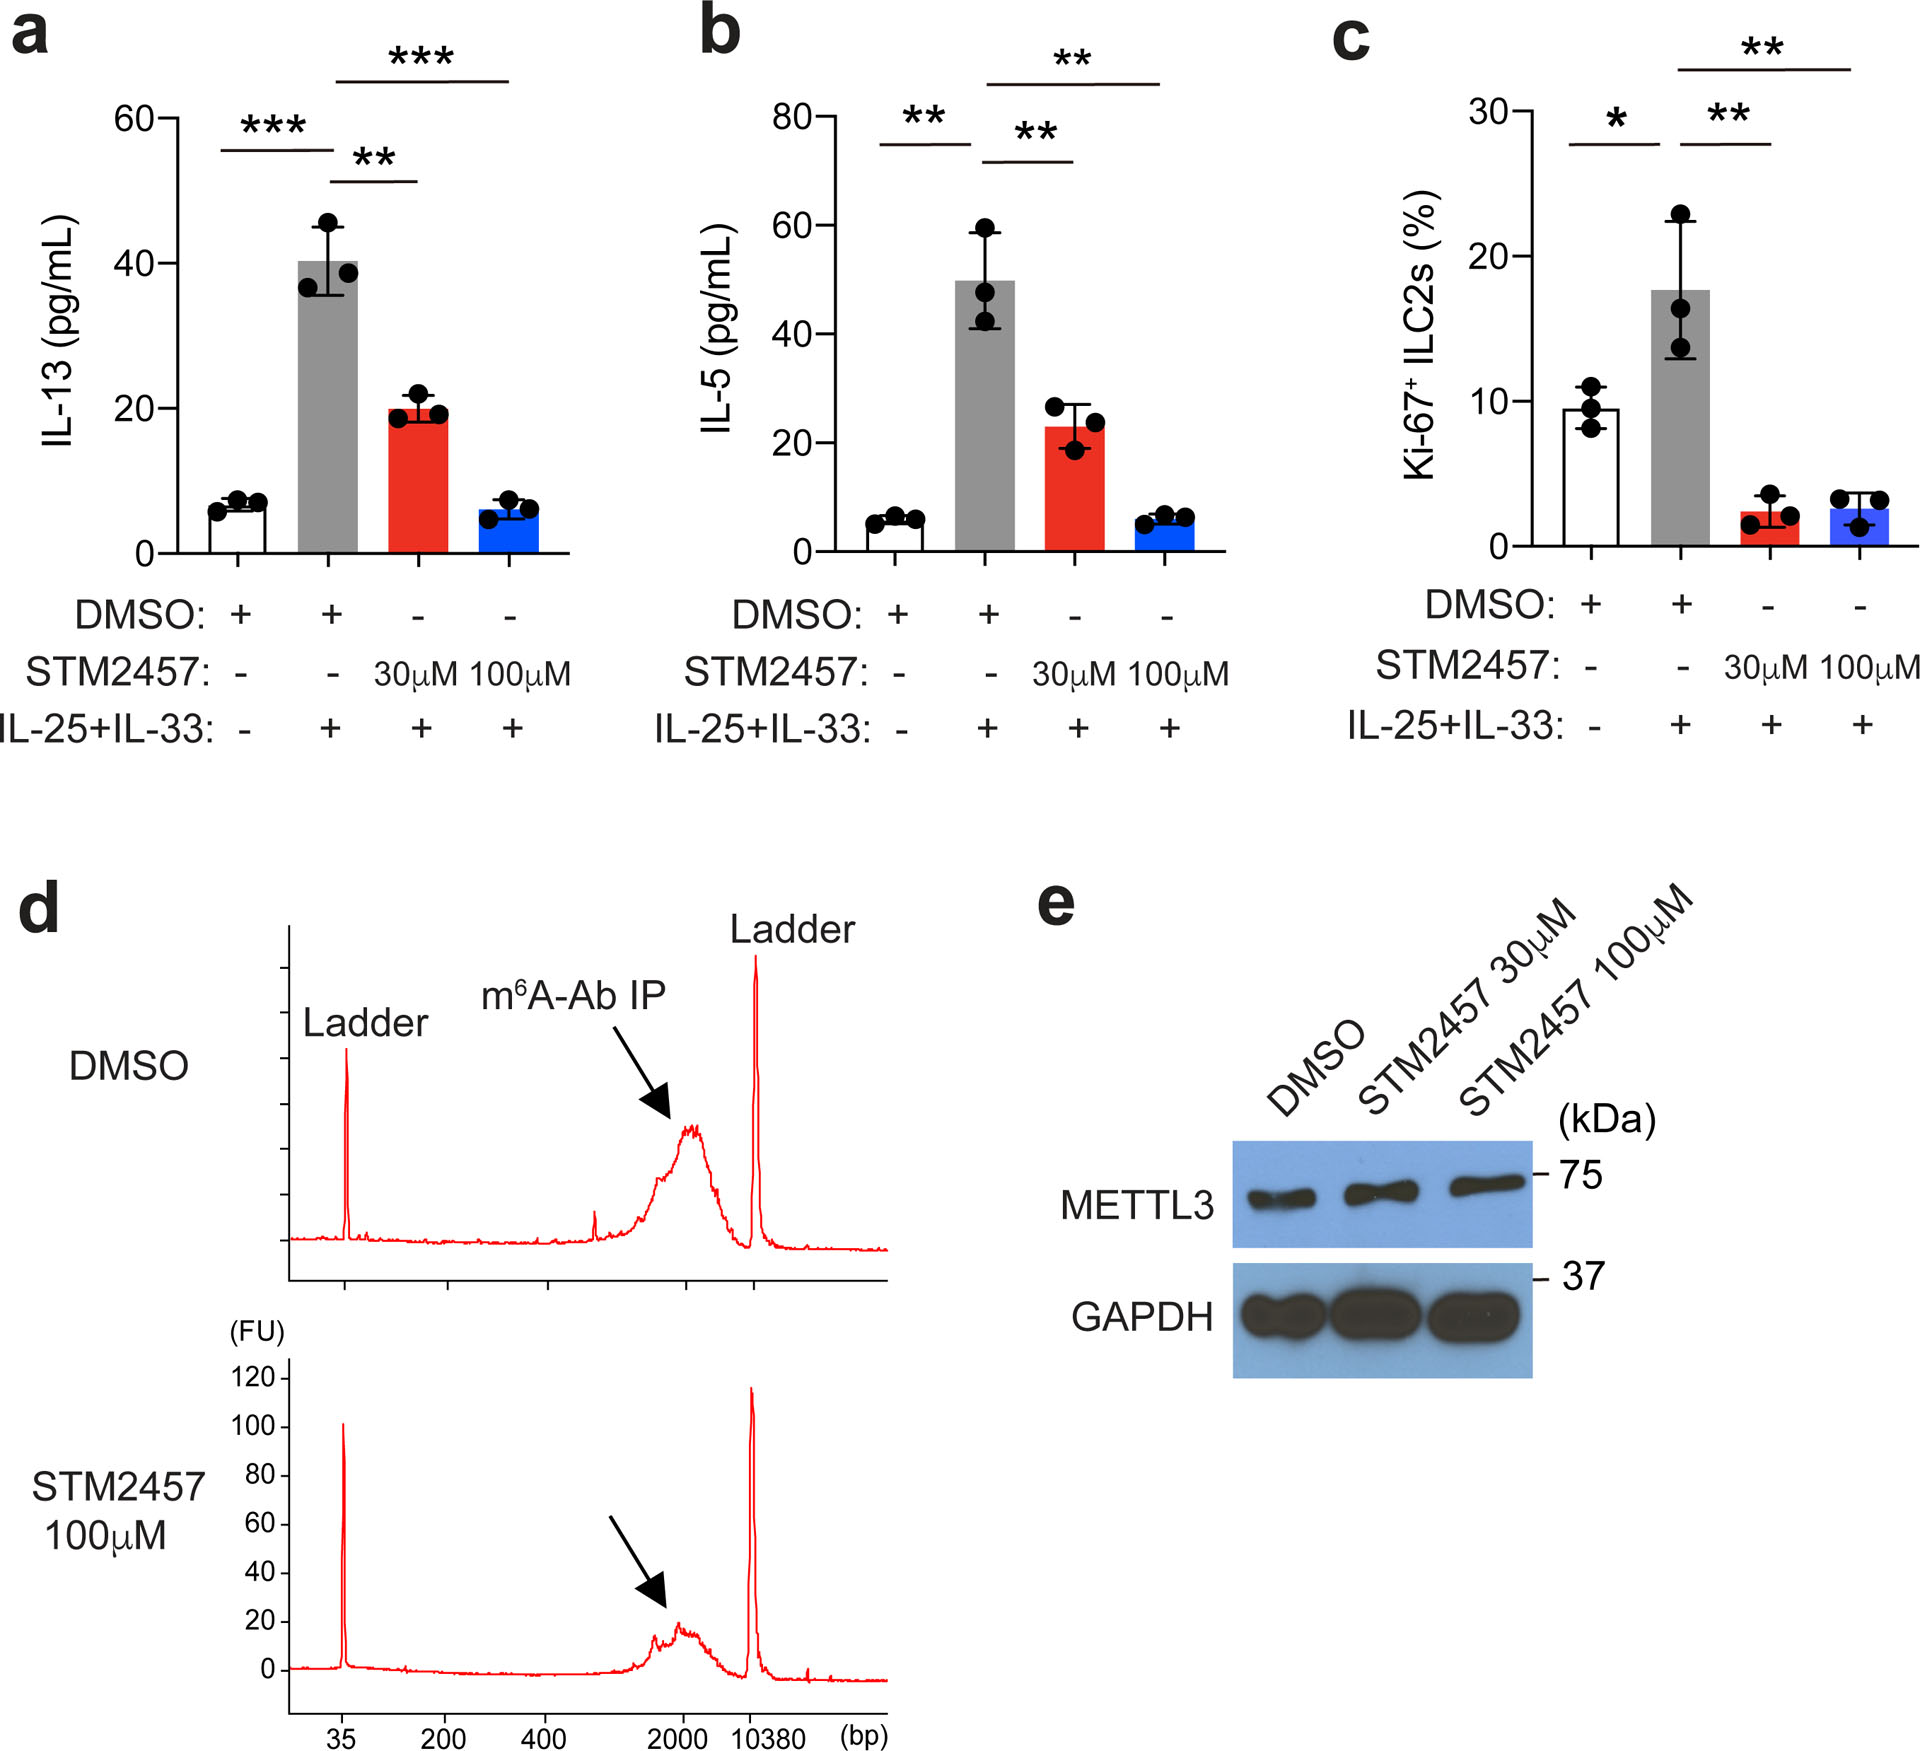
Treatment with IL-25 or helminth infection induces intestinal ILC2s to enter the lymphatics and migrate to mesenteric lymph nodes (MLNs), lungs and other tissue sites2,29. The IL-25-induced migration of ST2−KLRG1hi ILC2s, referred to as inflammatory or induced ILC2s (iILC2s)2,29, to the lung and MLNs was significantly inhibited in Mettl3Δ/Δ mice compared to in Mettl3fl/fl littermates (Fig. 2g,h). To determine whether m6A modifications regulated ILC2 activation in a cell-intrinsic manner, we i.v. transferred an equal mix of sorted intestinal KLRG1+ ILC2s from wild-type and Mettl3Δ/Δ mice into Rag2−/−Il2rg−/− mice, which were treated i.p. with tamoxifen for three doses starting at day 5 after cell transfer, and then treated with IL-25 for 3 d starting at day 4 after the last tamoxifen dose. Wild-type and Mettl3Δ/Δ ST2−KLRG1hi iILC2s were detected at a ratio of 87:13 in the lungs of recipient mice compared to at a ratio of 50:50 in the recipient mice that did not receive tamoxifen treatment (Fig. 2i). These results indicate that m6A modifications are essential for cytokine-induced ILC2 responses. m6A-independent roles of METTL3 have been reported30,31. To investigate whether METTL3 regulation of ILC2 activation depends on its methyltransferase enzyme activity, we used STM2457, a highly potent and selective catalytic inhibitor of METTL332. Treatment with STM2457 in vitro for 48 h impaired the production IL-13 and IL-5 (Extended Data Fig. 4a,b) and the proliferation (Extended Data Fig. 4c) of sorted wild-type intestinal KLRG1+ ILC2s from B6 mice in a dose-dependent manner. STM2457 induced an 80% decrease in the m6A modification in KLRG1+ intestinal ILC2s compared to in DMSO-treated KLRG1+ intestinal ILC2s (Extended Data Fig. 4d), while the expression of METTL3 protein was not affected (Extended Data Fig. 4e). Together, these observations suggest that METTL3-dependent m6A methylation is required for ILC2 activation.
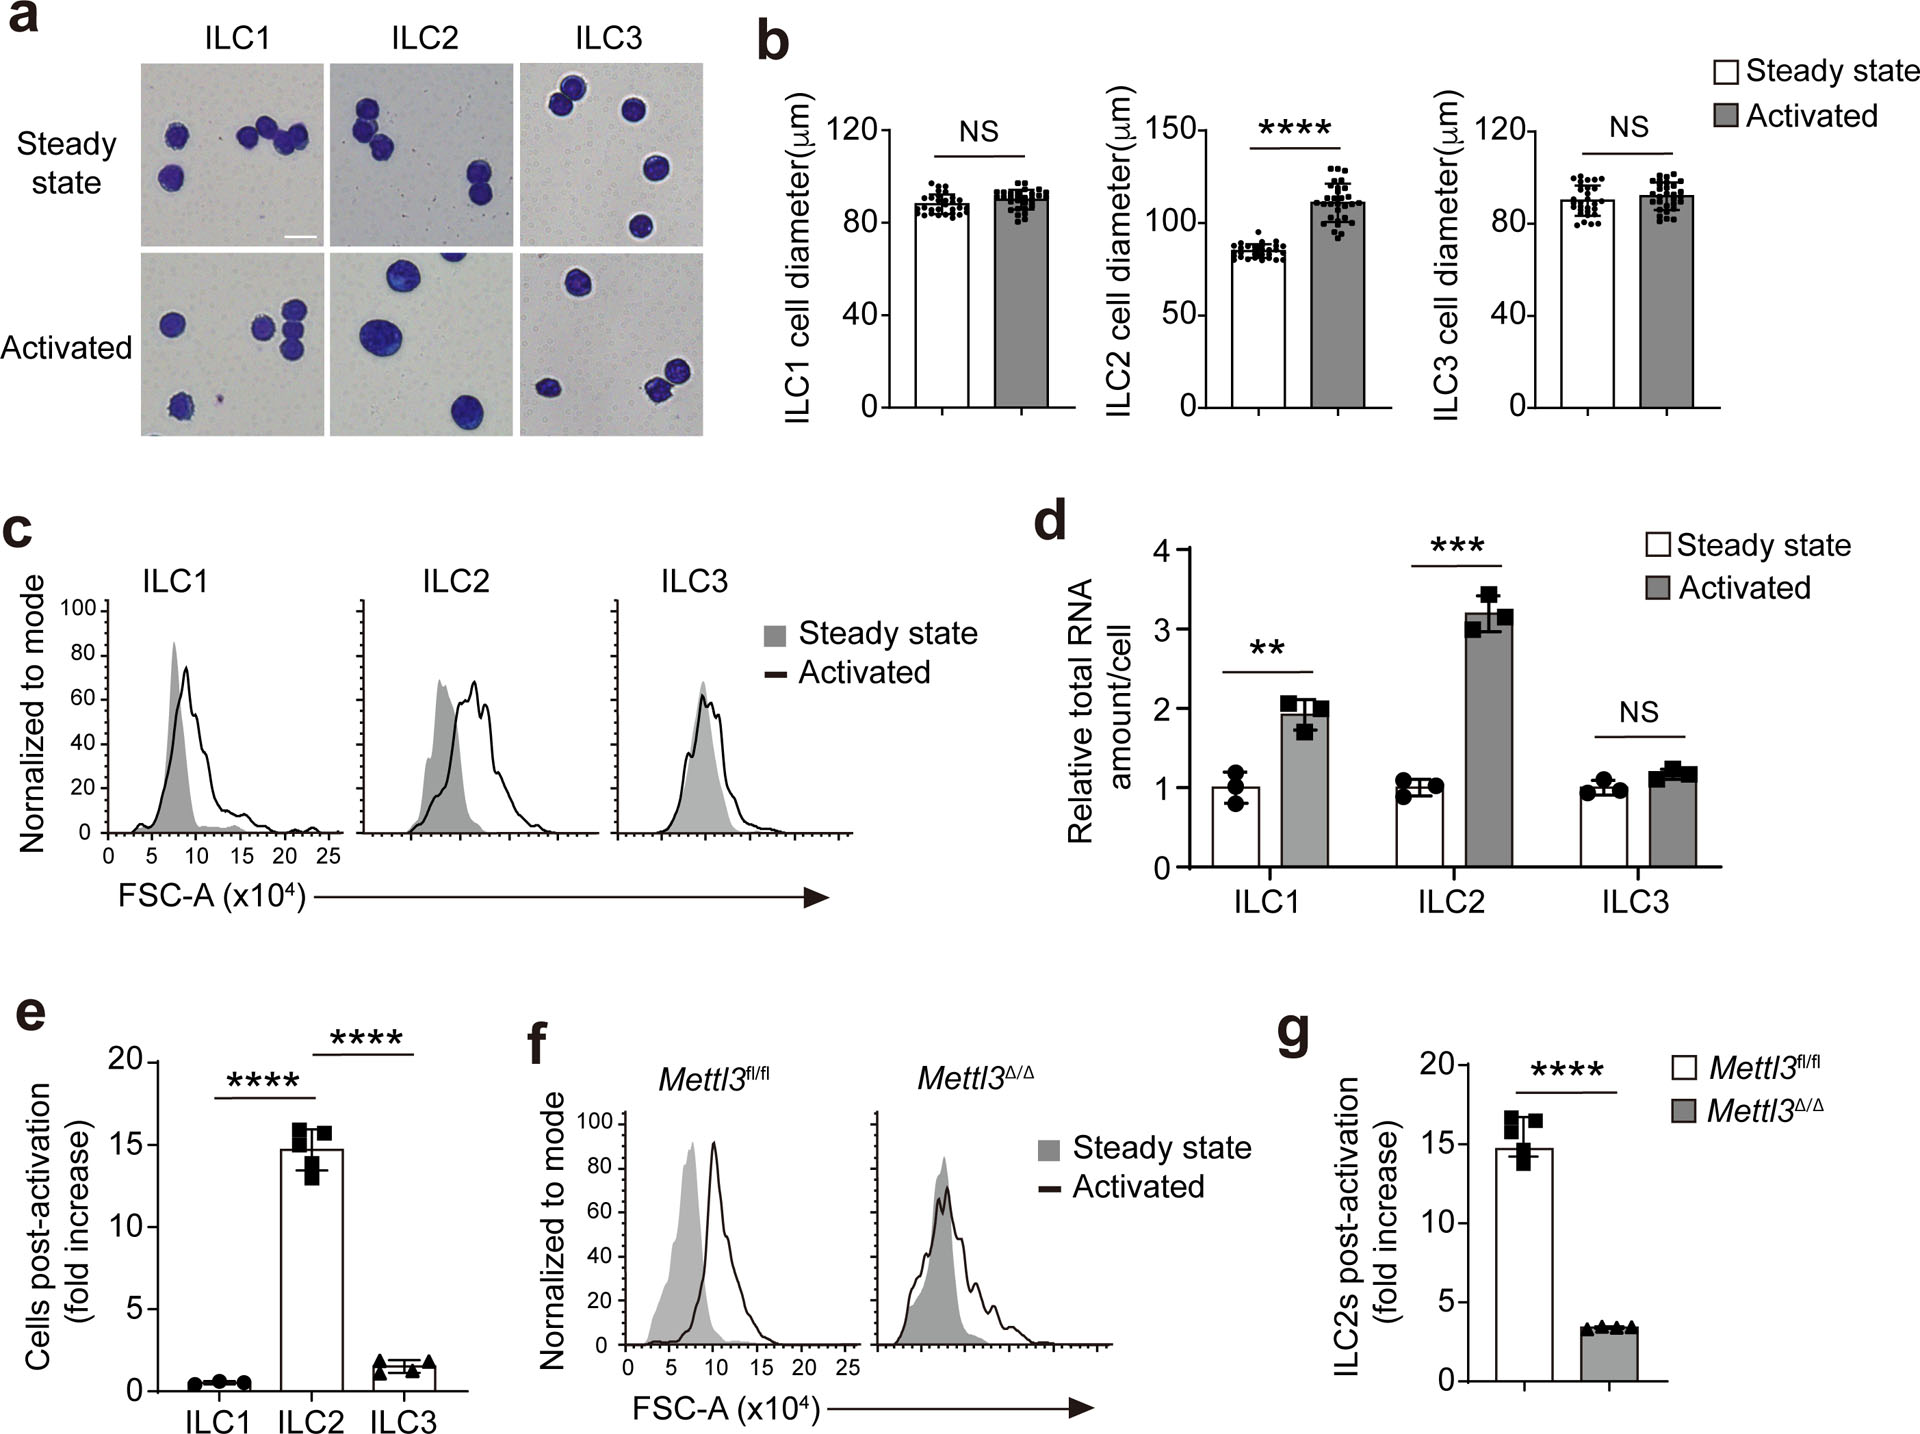
Cell size coordinates with gene expression to maintain biomolecule concentrations during responses to external stimuli, a homeostatic mechanism referred to as ‘scaling’33,34. This process relies on the coordination of mRNA transcription rate and half-life, two biological processes essentially regulated by m6A RNA methylation. Intestinal KLRG1+ ILC2s showed a significant increase in cell size on day 3 after i.p. injection of IL-25 compared to intestinal KLRG1+ ILC2s from naïve mice, whereas the cell size of liver NK1.1+ ILC1s or intestinal RORγt+ ILC3s did not change on day 3 after injection of IL-12 + IL-18 or IL-1β + IL-23, respectively (Extended Data Fig. 5a–c). The amount of total RNA per cell was threefold higher in IL-25-activated intestinal KLRG1+ ILC2s, twofold higher in activated liver NK1.1+ ILC1s and unchanged in activated intestinal RORγt+ ILC3s compared to the respective ILCs from naive mice (Extended Data Fig. 5d). IL-25 stimulation induced a 15-fold increase in the number of KLRG1+ ILC2s compared to untreated mice, while IL-12 + IL-18 or IL-1β + IL-23 stimulation induced a 0.5-fold and 1.5-fold increase in the number of liver NK1.1+ ILC1s and intestinal RORγt+ ILC3s, respectively (Extended Data Fig. 5e). The IL-25-induced increase in cell size and cell number of intestinal KLRG1+ ILC2s was lost in Mettl3Δ/Δ mice compared to in Mettl3fl/fl littermates (Extended Data Fig. 5f,g). Thus, Mettl3 is required for mRNA transcription during ILC2 activation.
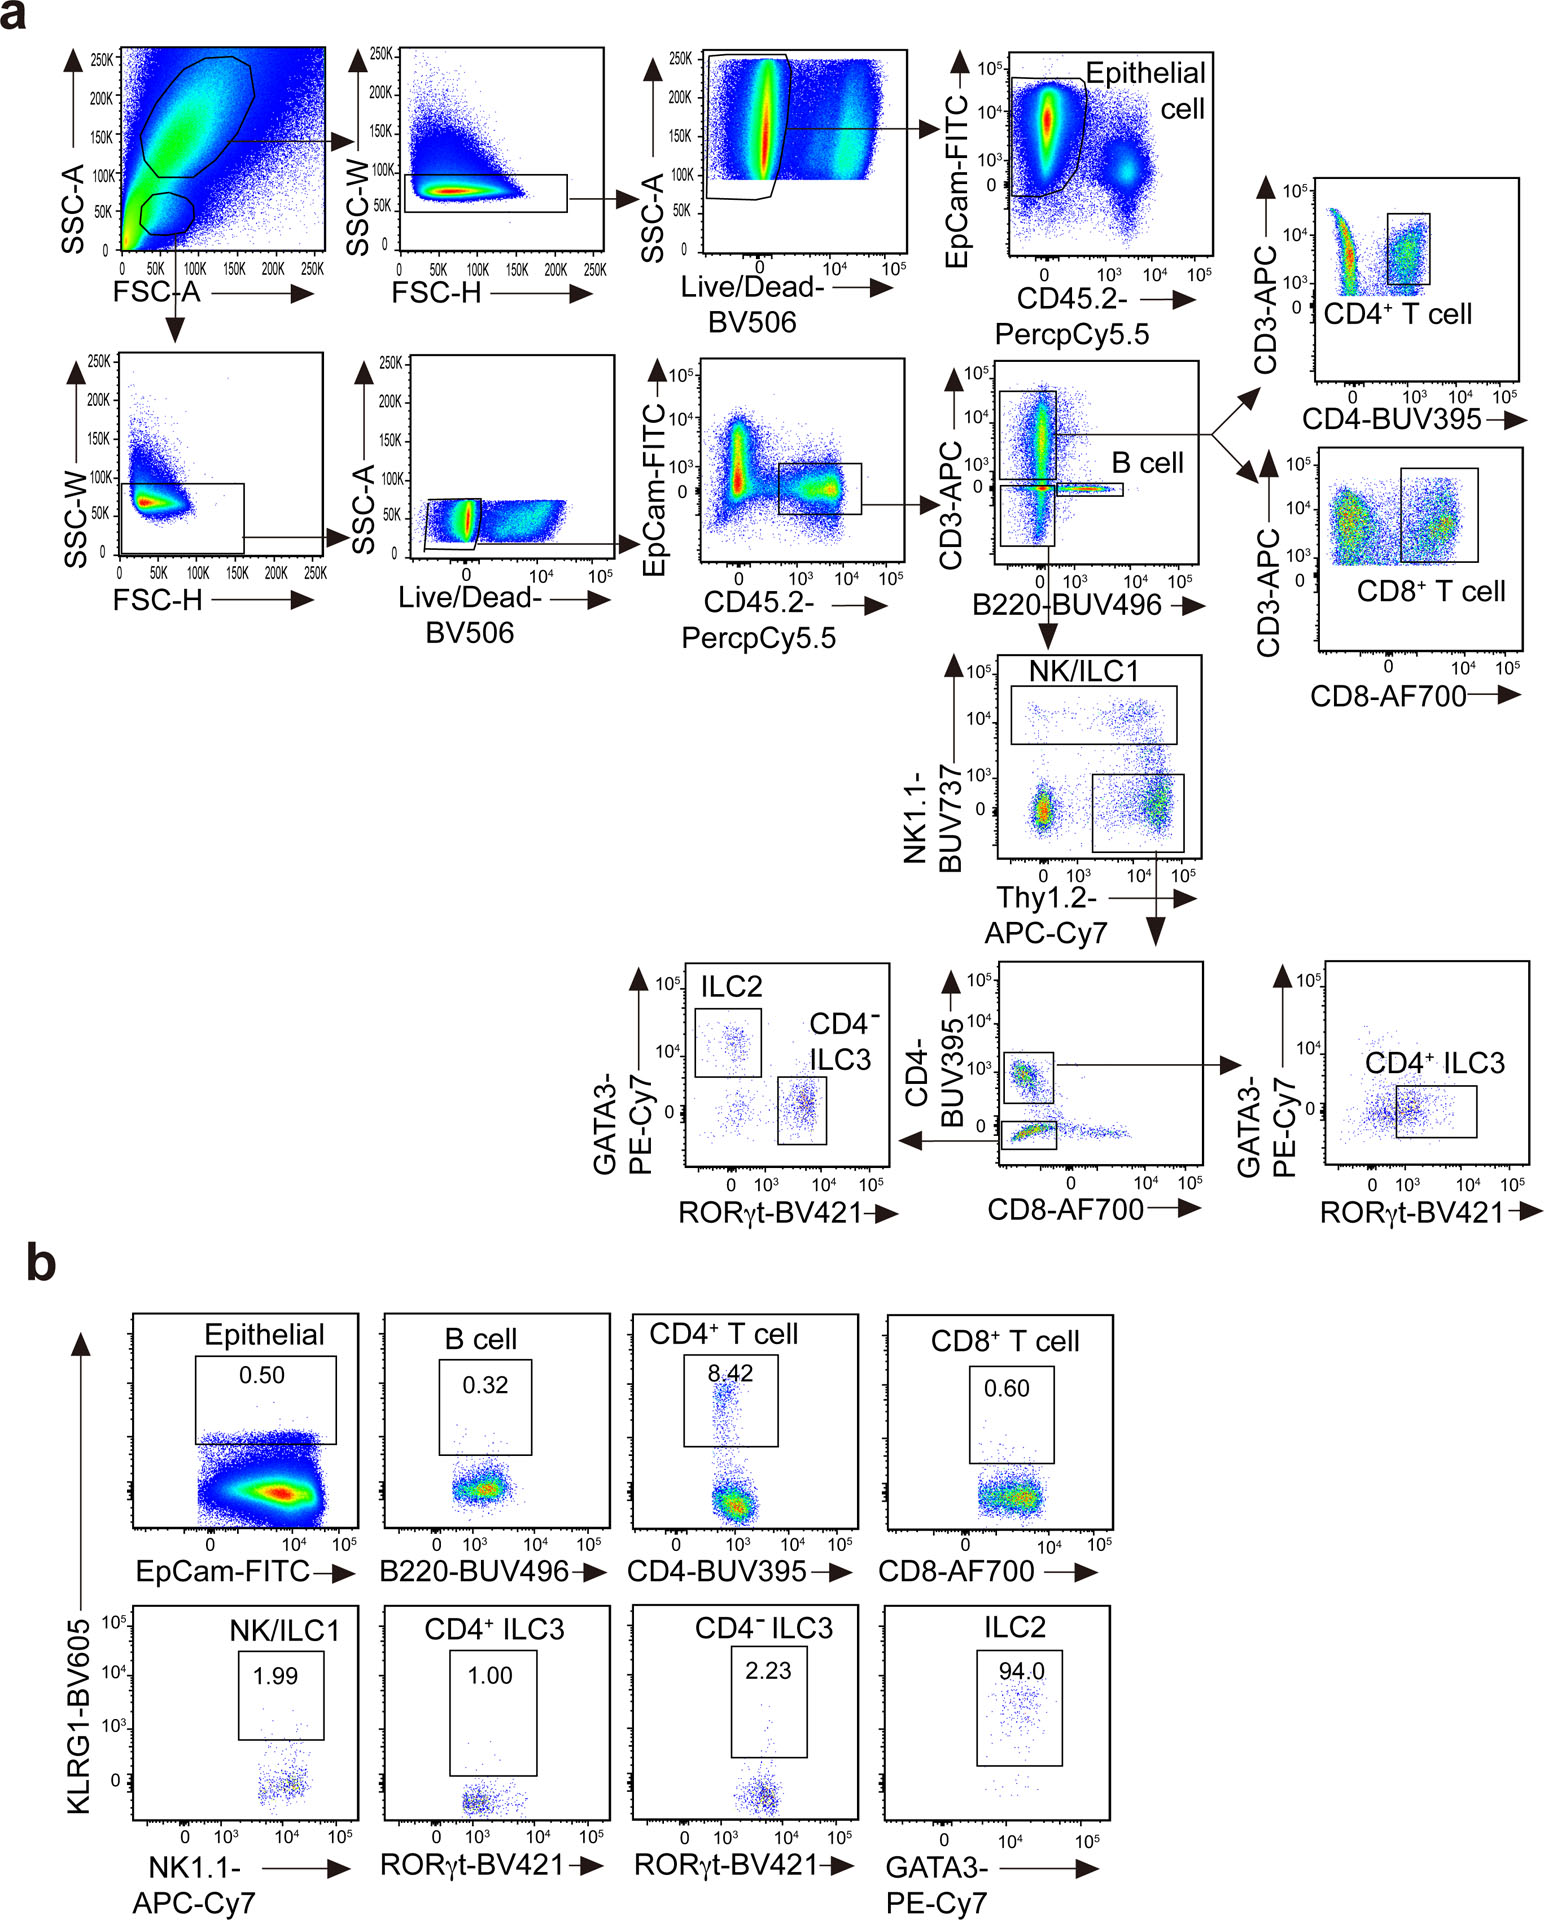
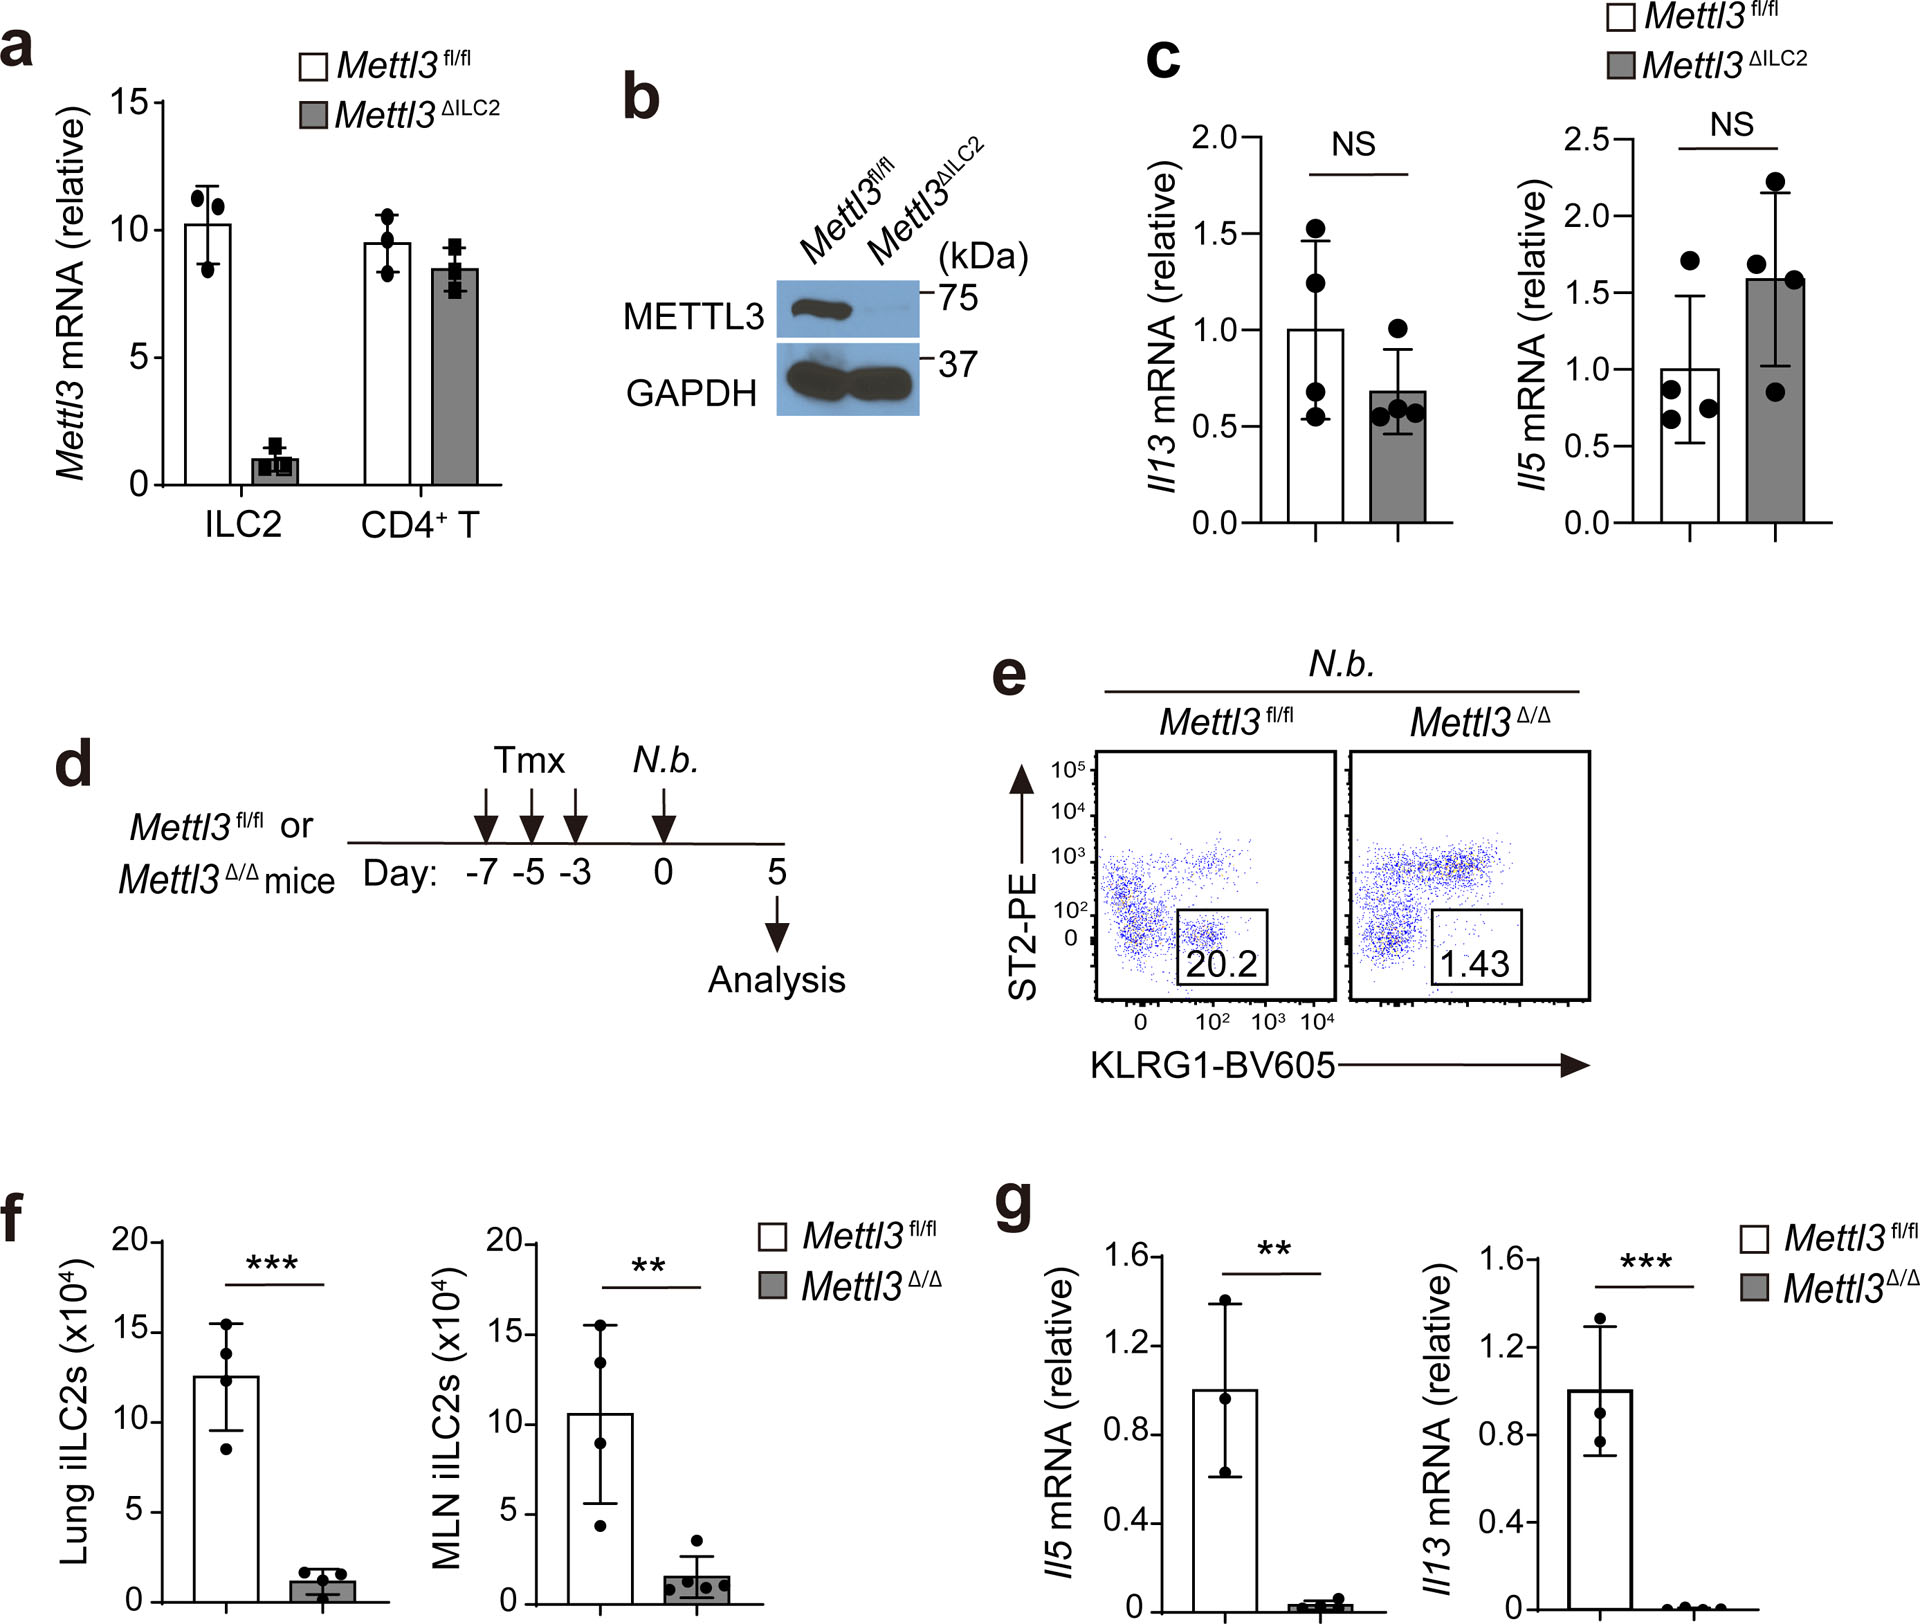
The inhibitory receptor KLRG1 is not expressed in BM ILC2 progenitors or immature ILC2s and is widely used as a marker of mature ILC2s35. In the small intestine, more than 96% of GATA3+ ILC2s were KLRG1+, while only 3% of CD4+ T cells, 2% of NK1.1+ ILC1s/NK cells and 1% of RORγt+ ILC3s expressed KLRG1 (Fig. 3a and Extended Data Fig. 6). To investigate the cell-intrinsic role of METTL3 in ILC2s, we crossed Klrg1Cre mice36 with Mettl3fl/fl mice to generate Klrg1CreMettl3fl/fl mice (hereafter Mettl3ΔILC2 mice). The deletion of Mettl3 in mature ILC2s was confirmed by RT–qPCR and immunoblotting (Extended Data Fig. 7a,b), while m6A immunoprecipitation indicated the loss of more than 90% of m6A from total mRNA in mature ILC2s from Mettl3ΔILC2 mice compared to those from Mettl3fl/fl littermates (Fig. 3b). Numbers of intestinal KLRG1+ ILC2s and basal IL-13 or IL-5 production were similar in Mettl3ΔILC2 and Mettl3fl/fl mice at steady state (Fig. 3c and Extended Data Fig. 7c), while the numbers of ST2−KLRG1hi iILC2s in the lung and KLRG1+ ILC2s in the small intestine and amounts of intestinal Il5 and Il13 mRNA were decreased by 60–70% in Mettl3ΔILC2 mice compared to in Mettl3fl/fl littermates on day 3 after i.p. injection of IL-25 (Fig. 3d–g), suggesting that expression of METTL3 in ILC2s was required for IL-25-induced cell proliferation, gut-to-lung migration and type 2 cytokine production. Following subcutaneous injection with 300 Nippostrongylus brasiliensis stage-three larvae, Mettl3ΔILC2 mice had increased numbers of eggs in feces on day 10, increased worm burden in the small intestine on day 14 and reduced accumulation of ST2−KLRG1hi iILC2s in the lung on day 5 after inoculation compared to that observed in Mettl3fl/fl littermates (Fig. 3h), indicating that Mettl3 deletion in ILC2s impacts antihelminth immunity. Similarly, ST2−KLRG1hi iILC2 migration to the lung and Il13 and Il5 mRNA induction in the small intestine were barely detectable in Mettl3Δ/Δ mice compared to in Mettl3fl/fl littermates on day 5 after N. brasiliensis infection (Extended Data Fig. 7d–g). In addition, Rag2−/−Il2rg−/− mice that were adoptively transferred with ST2−KLRG1hi iILC2s sorted from the MLNs and lungs of IL-25-treated Mettl3Δ/Δ mice and infected with N. brasiliensis on the same day (day 0) followed by three doses of i.p. tamoxifen on days 1, 3 and 5 after transfer had 50% higher numbers of eggs in feces on day 11 and higher worm burden in the small intestine on day 15 after infection than Rag2−/−Il2rg−/− mice that received Mettl3fl/fl iILC2s (Fig. 3i), indicating that METTL3 is required in ILC2s for efficient worm expulsion.
Fig. 3. m6A is critical for ILC2-mediated antihelminth immunity.
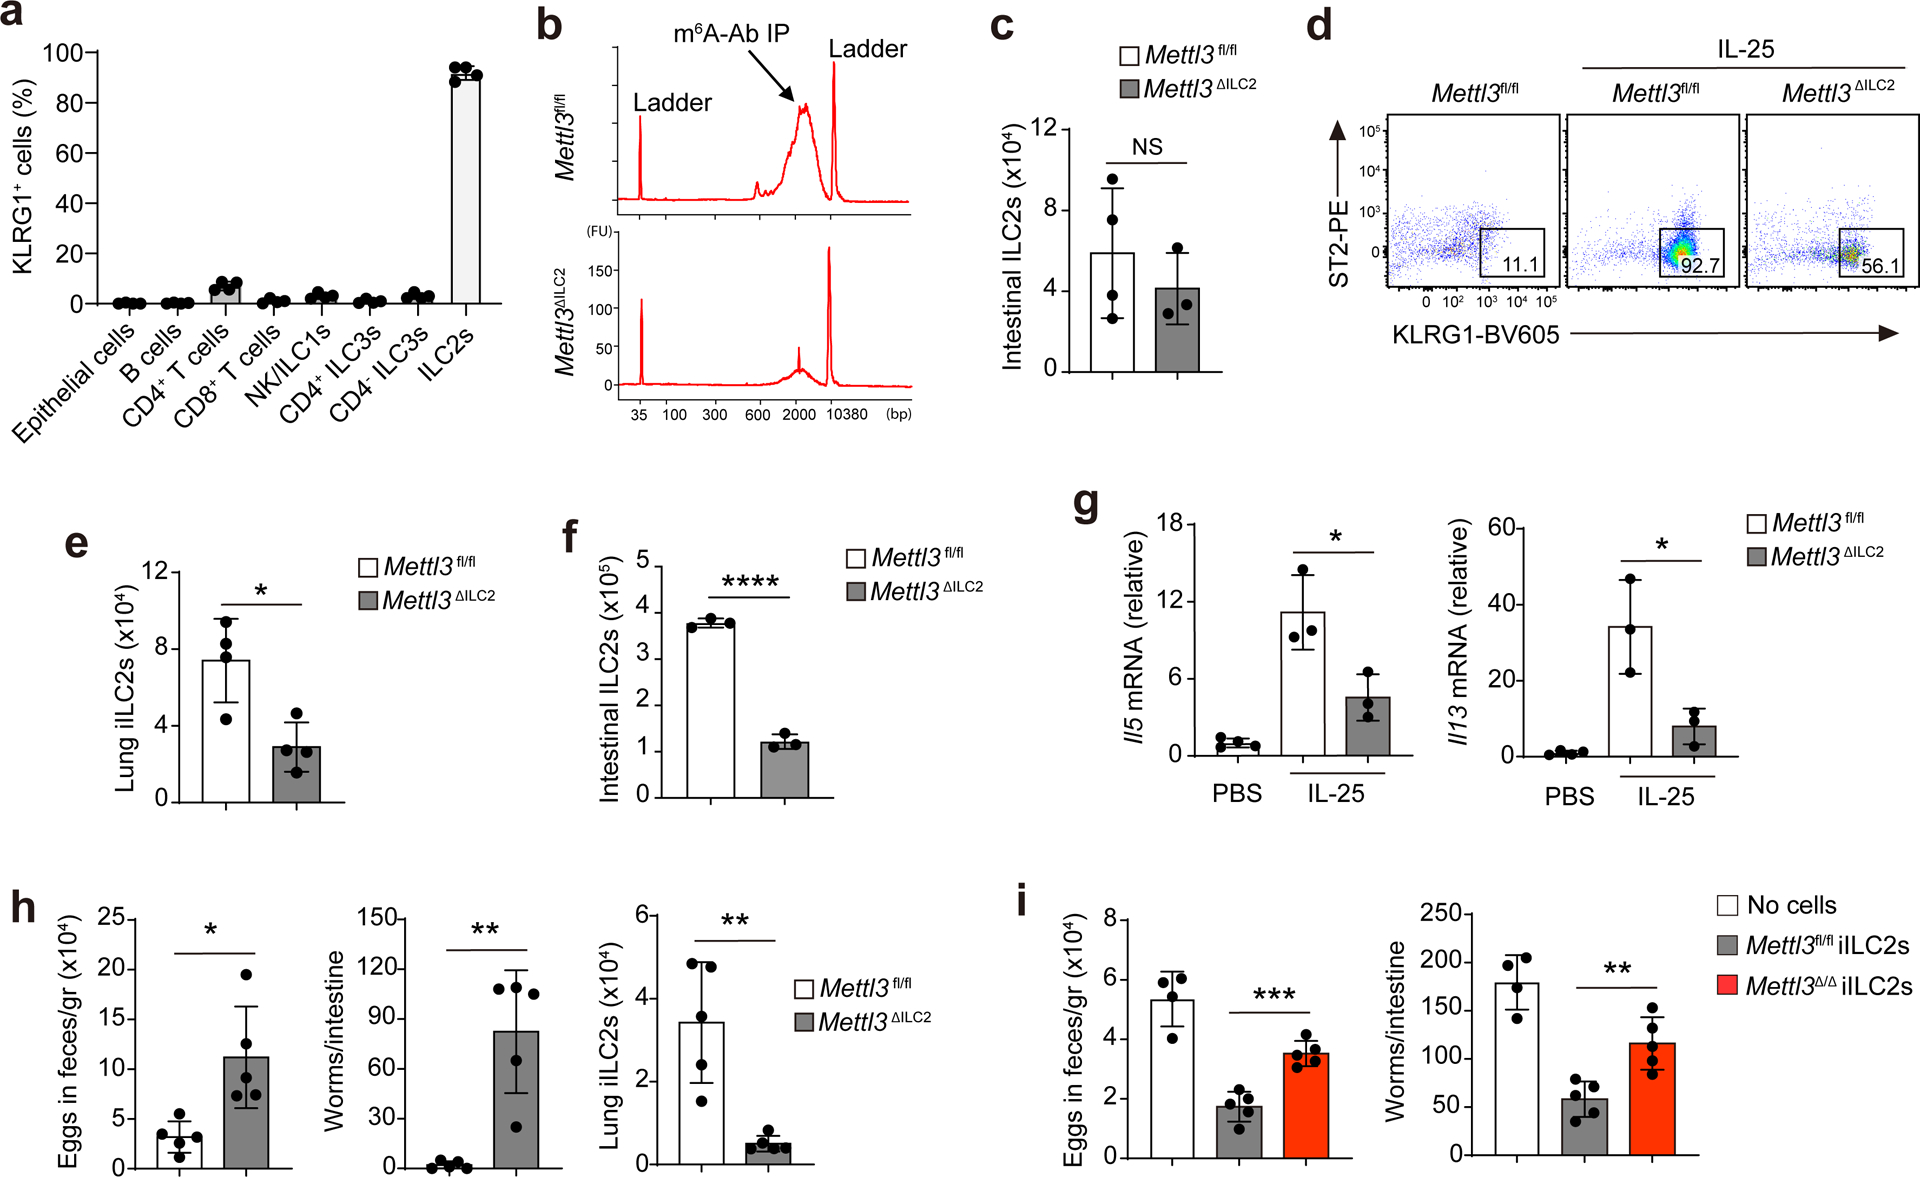
a, Quantification of KLRG1+ frequency of different cell populations in the small intestine of B6 mice as assessed by flow cytometry. b, Bioanalyzer measurement of the reverse transcripts of mRNAs pulled down by anti-m6A antibody in intestinal ILC2s of Mettl3fl/fl and Mettl3ΔILC2 mice; IP, immunoprecipitation; FU, fluorescence units; bp, base pairs. c, Quantification of intestinal ILC2s of Mettl3fl/fl and Mettl3ΔILC2 mice by flow cytometry; NS P = 0.4378. d,e, Representative flow cytometry (d) and quantification (e) of ST2−KLRG1hi iILC2s in the lungs of Mettl3fl/fl and Mettl3ΔILC2 mice that received 3 d of IL-25 injection; *P = 0.0118 (e). f, Quantification of intestinal KLRG1+ ILC2s in mice as in d; ****P < 0.0001. g, RT–qPCR of Il5 and Il13 mRNA in the small intestines of mice as in d; *P = 0.0282 (left); *P = 0.0264 (right). h, Quantification of eggs in feces on day 10, worms in the small intestine on day 14 and iILC2s in the lungs on day 5 after inoculation of 300 N. brasiliensis stage-three larvae in Mettl3fl/fl and Mettl3ΔILC2 mice; *P = 0.0101 (left); **P = 0.0013 (middle); **P = 0.0021 (right). i, Quantification of eggs in feces on day 11 and worms in the small intestine on day 15 after N. brasiliensis inoculation in Rag2−/−Il2rg−/− recipient mice that received cell transfers of ST2−KLRG1hi iILC2s from IL-25-treated Mettl3fl/fl or Mettl3Δ/Δ mice. Cell transfers were performed on the same day as N. brasiliensis inoculation, and the recipient mice also received three doses of tamoxifen every other day from days 1 to 5; ***P = 0.0003 (left); **P = 0.0044 (right). Data were analyzed by unpaired two-tailed t-test; n = 3–5 in a, c and e–i. Data are shown as mean ± s.d. Results are representative of three independent experiments.
IL-25-elicited iILC2s can convert to RORγt-expressing ILC3-like cells29, but lung ST2−KLRG1hi iILC2s in IL-25-treated Mettl3ΔILC2 mice had similar expression of RORγt protein as their Mettl3fl/fl counterparts (Extended Data Fig. 8a), indicating that Mettl3 deletion does not affect ILC2 conversion into ILC3-like cells. In T cells, m6A targets the IL-7–STAT5–SOCS pathway to modulate T cell homeostasis22. However, IL-7-triggered phosphorylation of STAT5 was similar in in vitro-cultured Mettl3ΔILC2 and Mettl3fl/fl KLRG1+ ILC2s isolated from the small intestine (Extended Data Fig. 8b), suggesting that m6A regulates ILC2 and T cell responses through different mechanisms. To gain insight into m6A regulation of ILC2s and to identify direct m6A methylation targets, we performed m6A-tagged mRNA immunoprecipitation sequencing (meRIP–seq)21 in ST2−KLRG1hi iILC2s sorted from the MLNs of IL-25-treated B6 mice. A cluster of 3,990 transcripts (false discovery rate P value of <0.05 and fold change of >2) was significantly enriched in the m6A-bound fraction relative to the transcripts enriched in the unbound fraction (Fig. 4a). We also performed meRIP–seq in steady-state KLRG1+ ILC2s sorted from the small intestines of Mettl3ΔILC2 and Mettl3fl/fl mice. Only eight transcripts were enriched in the m6A-bound fraction of Mettl3ΔILC2 steady-state ILC2s compared to 2,116 transcripts enriched in the m6A-bound fraction of Mettl3fl/fl steady-state ILC2s (Fig. 4b), confirming the loss of the m6A modification in Mettl3ΔILC2 ILC2 mRNA. Gene ontology analysis indicated that in the IL-25-activated ST2−KLRG1hi iILC2s, the transcripts enriched in the m6A-bound fraction compared to those in the unbound fraction were related to RNA metabolic processes, response to stimulus, regulation of cell cycle and cell migration (Fig. 4c). Metascape analysis showed that transcripts related to signaling networks, including chromatin organization, histone modification, protein modification and JNK cascade, were also enriched in the m6A-bound fraction of IL-25-activated ST2−KLRG1hi iILC2s (Fig. 4d), suggesting that m6A regulates a broad range of cellular biological processes. Gene set enrichment analysis indicated that transcription factor-associated transcripts were highly m6A methylated (Fig. 4e), suggesting that m6A modulates ILC2s at the level of transcriptional control.
Fig. 4. m6A targets Gata3 in activated ILC2s.
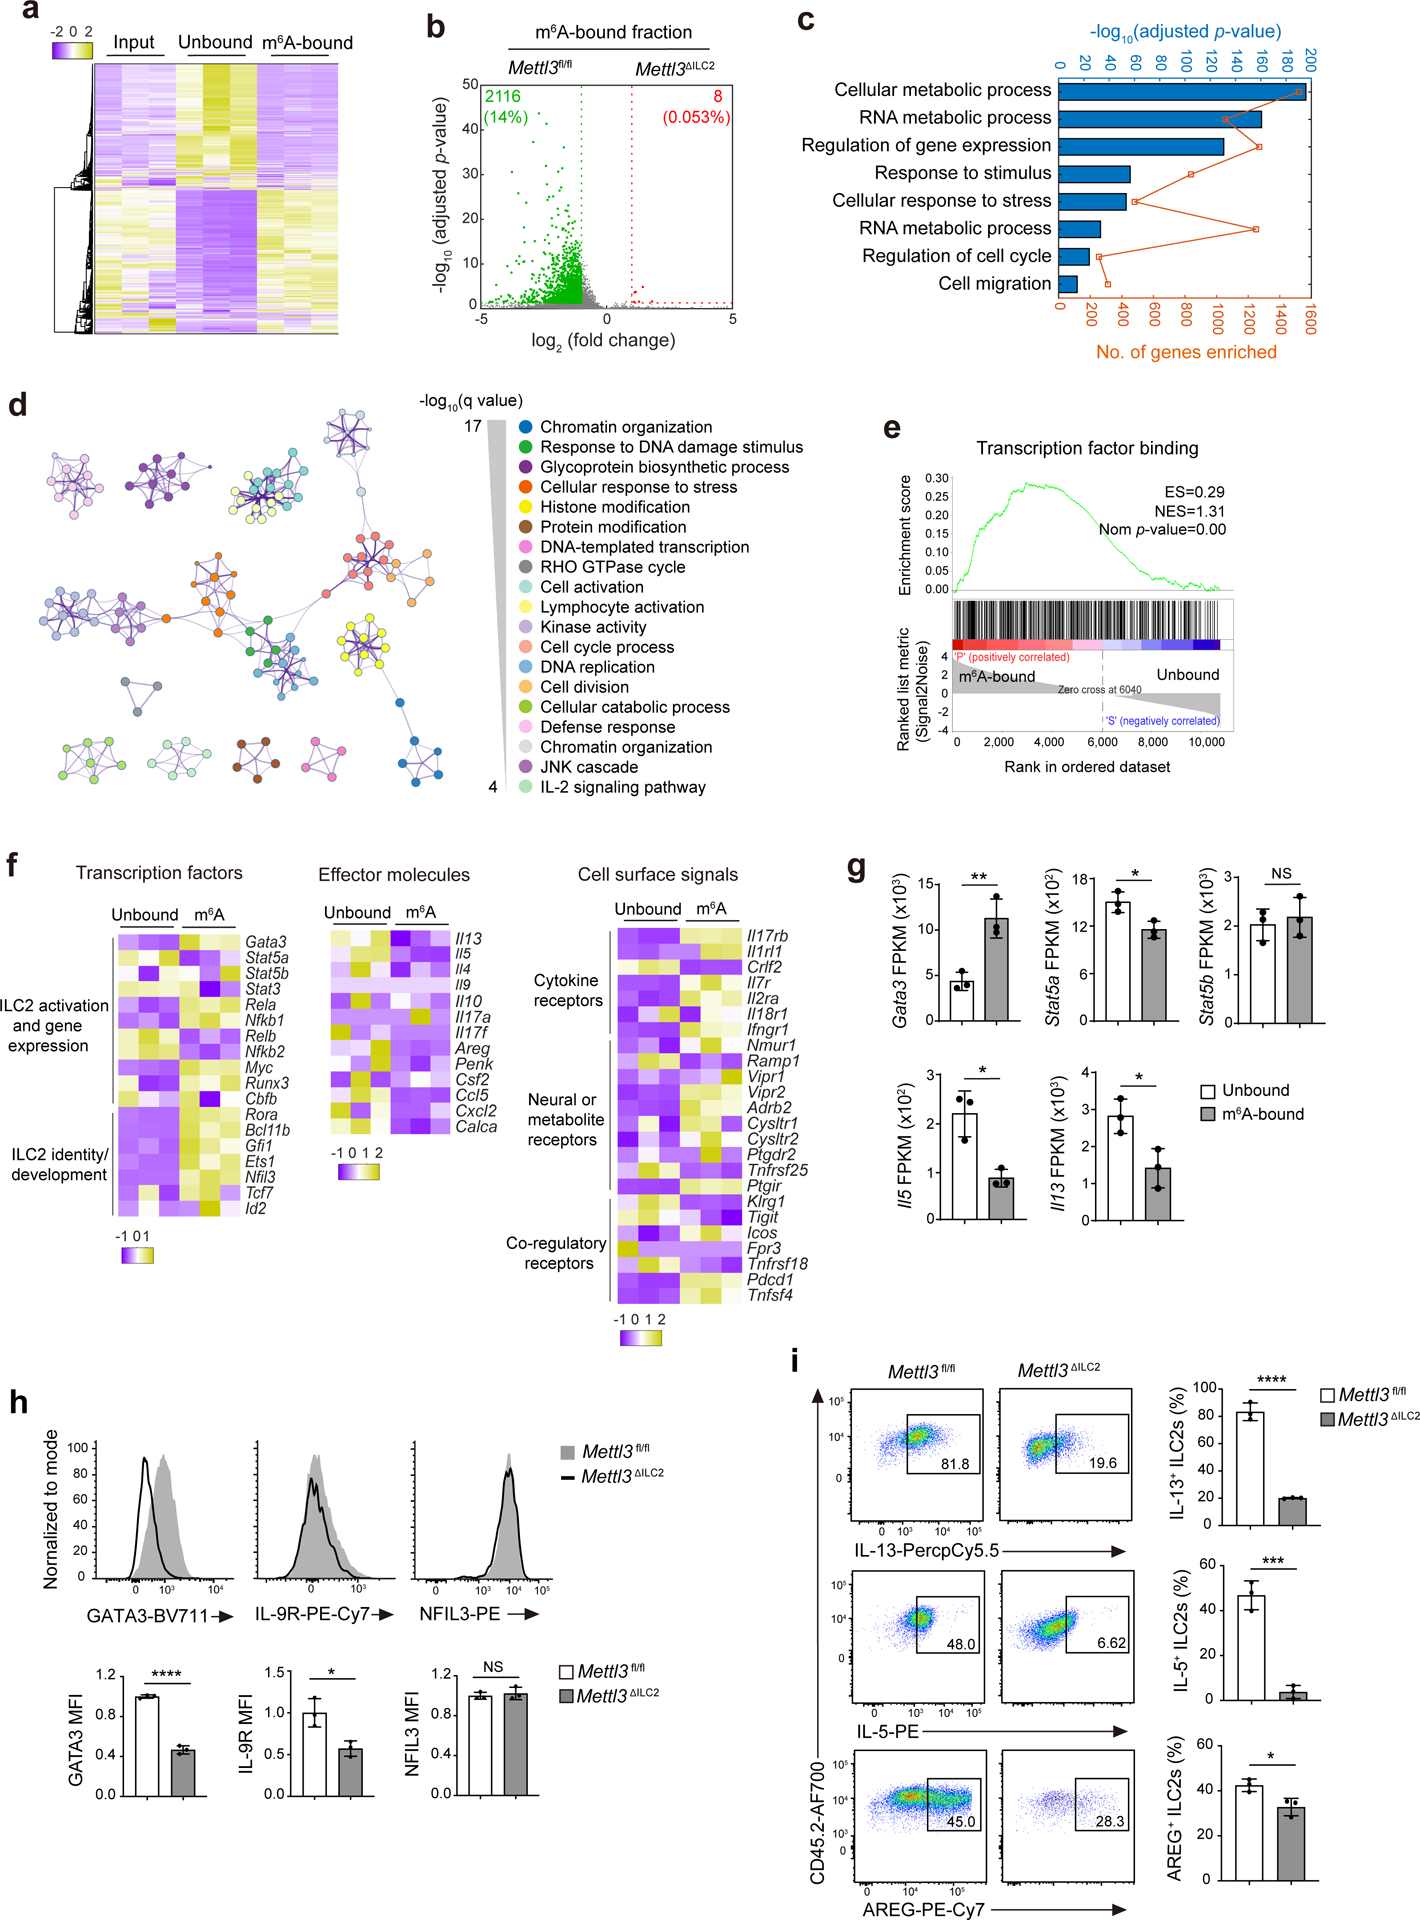
a, Heat map of DEseq2-normalized read counts of meRIP–seq data from iILC2s sorted from MLNs of IL-25-treated B6 mice. Input, total mRNA; unbound, unmethylated; m6A bound, m6A methylated. b, Volcano plot for the comparison of genes enriched in the m6A-bound fraction between Mettl3fl/fl ILC2s and Mettl3ΔILC2 ILC2s from the small intestine of untreated mice. c, Functional enrichment analysis on the m6A-bound fraction in a as assessed by gProfiler. d, Metascape analysis of the m6A-bound fraction in a. Each node represents a functional term. The size of the node is proportional to the number of m6A-bound genes that fall into the corresponding term, and the color reflects its cluster identity. The edge represents the similarity between the two terms. e, Enrichment plot of gene sets that were enriched in the m6A-bound fraction in a; ES, enrichment score; NES, normalized enrichment score; Nom, nominal. f,g, Heat map (f) and fragments per kilobase per million (FPKM; g) of selected genes between unbound and m6A-bound fractions as in a. In g, **P = 0.0071 (Gata3), *P = 0.0237 (Stat5a), NS P = 0.6370 (Stat5b), *P = 0.0106 (Il5) and *P = 0.0259 (Il13). h, Representative flow cytometry and mean fluorescence intensity (MFI) quantification of GATA3, IL-9R and NFIL3 in small intestine ILC2s from Mettl3fl/fl and Mettl3ΔILC2 mice that received 2 d of IL-25 treatment; ****P < 0.0001 (GATA3); *P = 0.0185 (IL-9R); NS P = 0.6008 (NFIL3). i, Representative flow cytometry and quantification of the percentage of IL-13+, IL-5+ and AREG+ ILC2s as in h; ****P < 0.0001 (IL-13); ***P = 0.0005 (IL-5); *P = 0.0244 (AREG). Data were analyzed by unpaired two-tailed t-test; n = 3 in g–i. Data are shown as mean ± s.d. Results are representative of two independent experiments in h and i.
meRIP–seq in liver NK1.1+ ILC1s isolated from B6 mice injected i.p. with IL-12 + IL-18 identified a cluster of 4,043 transcripts enriched in the m6A-bound fraction compared to in the unbound fraction (Extended Data Fig. 9a). Gene ontology analysis indicated that transcripts related to the positive regulation of interferon-γ and tumor necrosis factor production and the negative regulation of innate immune responses and NF-κB signaling were enriched in the m6A-bound fraction of IL-12 + IL-18-activated NK1.1+ ILC1s (Extended Data Fig. 9b). Metascape analysis identified an array of m6A-regulated signaling networks, including leukocyte activation, inflammatory response, negative regulation of immune system process and negative regulation of cytokine production in IL-12 + IL-18-activated NK1.1+ ILC1s (Extended Data Fig. 9c), suggesting that m6A modifications both positively and negatively regulate NK1.1+ ILC1 activation. Similarly, meRIP–seq of activated RORγt+ ILC3s isolated from the small intestine of Rorc-egfp mice i.p. injected with IL-1β + IL-23 identified 4,395 transcripts enriched in the m6A-bound fraction compared to in the unbound fraction (Extended Data Fig. 9e). Gene ontology and metascape analyses indicated that transcripts related to NF-κB signaling, the transforming growth factor-β receptor pathway, cell cycle, GTPase activity and many other signaling pathways were regulated by m6A methylation in activated RORγt+ ILC3s (Extended Data Fig. 9f,g). Transcripts associated with apoptotic processes, necroptotic processes and negative regulation of DNA binding were also enriched in the m6A-bound fraction (Extended Data Fig. 9f,g), suggesting that m6A participates in regulating cell death.
Further analysis of meRIP–seq data in activated ILC1s, ILC2s and ILC3s, focusing specifically on transcripts encoding ILC-associated transcription factors, effector molecules and cell surface receptors37, indicated that in IL-25-activated KLRG1+ ILC2s, m6A modifications were specifically deposited on mRNAs of the ILC2 lineage-specific transcription factors Gata3, Rora, Bcl11b, Gfi1 and Ets1 and on the mRNAs of cell surface signaling receptors Il17rb, Il7r, Nmur1, Vipr2, Icos and Pdcd1 but not on the mRNAs of effector molecules such as Il13, Il5, Areg and Ccl5 or transcription factors such as Stat5a, Stat5b and Stat3 (Fig. 4f). Comparison of normalized sequencing reads between unbound and m6A-bound fractions of activated KLRG1+ ILC2s indicated that m6A modifications marked Gata3 but not Stat5a, Stat5b, Il13 or Il5 (Fig. 4g). By contrast, the mRNAs of ILC1-specific transcription factors T-bet (Tbx21) and Eomes were not enriched in the m6A-bound fraction of IL-12 + IL-18-activated NK1.1+ ILC1s (Extended Data Fig. 9a,d), and the mRNAs of ILC3-specific transcription factors Rorc and Ahr were not enriched in the m6A-bound fraction of activated RORγt+ ILC3s (Extended Data Fig. 9e,h). These data suggest that m6A selectively targets the transcripts of ILC2-associated transcription factors to modulate ILC2 responses. GATA3 is essential for ILC2 development and lineage commitment and also directly mediates the expression of functional genes such Il13, Il5, Areg and Il9r6,38,39. Intestinal KLRG1+ ILC2s isolated from Mettl3ΔILC2 mice on day 2 after i.p. injection of IL-25 showed reduced expression of GATA3, IL-9R, IL-13, IL-5 and AREG proteins but not NFIL3 protein compared to that observed in their Mettl3fl/fl counterparts (Fig. 4h,i). These results suggest that METTL3-mediated m6A orchestrates the GATA3-controlled ILC2 transcription program.
Next, we used a fusion protein consisting of a catalytically dead Cas13b (dCas13b) and the m6A RNA demethylase ALKBH524, 40 to specifically remove the m6A modifications from Gata3 mRNA. Four guide RNAs (4gRNA) were designed and mixed for optimal coverage of the Gata3 transcript. m6A-based immunoprecipitation coupled with Gata3 RT–qPCR in ILC2/b6 cells, which were derived from B6 mouse small intestine ILC2s by spontaneous mutation and selection41, indicated that 4gRNA-guided ALKBH5–dCas13b drove significant demethylation of Gata3 mRNA in these cells compared to in cells transduced with ALKBH5–dCas13b without 4gRNA (Fig. 5a). In primary iILC2s isolated from the MLNs of IL-25-treated B6 mice and transduced with ALKBH5–dCas13b and 4gRNA (ILC2Gata3−4gRNA), IL-25 + IL-33 stimulation in vitro reduced the expression of IL-13 and IL-5 compared to in primary iILC2s transduced with ALKBH5–dCas13b only (ILC2Ctr; Fig. 5b–f). Expression of Gata3 mRNA and protein was reduced in ILC2Gata3−4gRNA cells in response to IL-25 + IL-33 stimulation in vitro compared to in ILC2Ctr cells (Fig. 5g–i). Consistently, GATA3 protein was not upregulated in response to IL-25 stimulation in vivo in intestinal KLRG1+ ILC2s from Mettl3Δ/Δ mice compared to in Mettl3fl/fl littermates (Fig. 5j), suggesting that m6A modulates GATA3 expression during ILC2 activation.
Fig. 5. m6A modulates Gata3 mRNA stability to facilitate ILC2 activation.
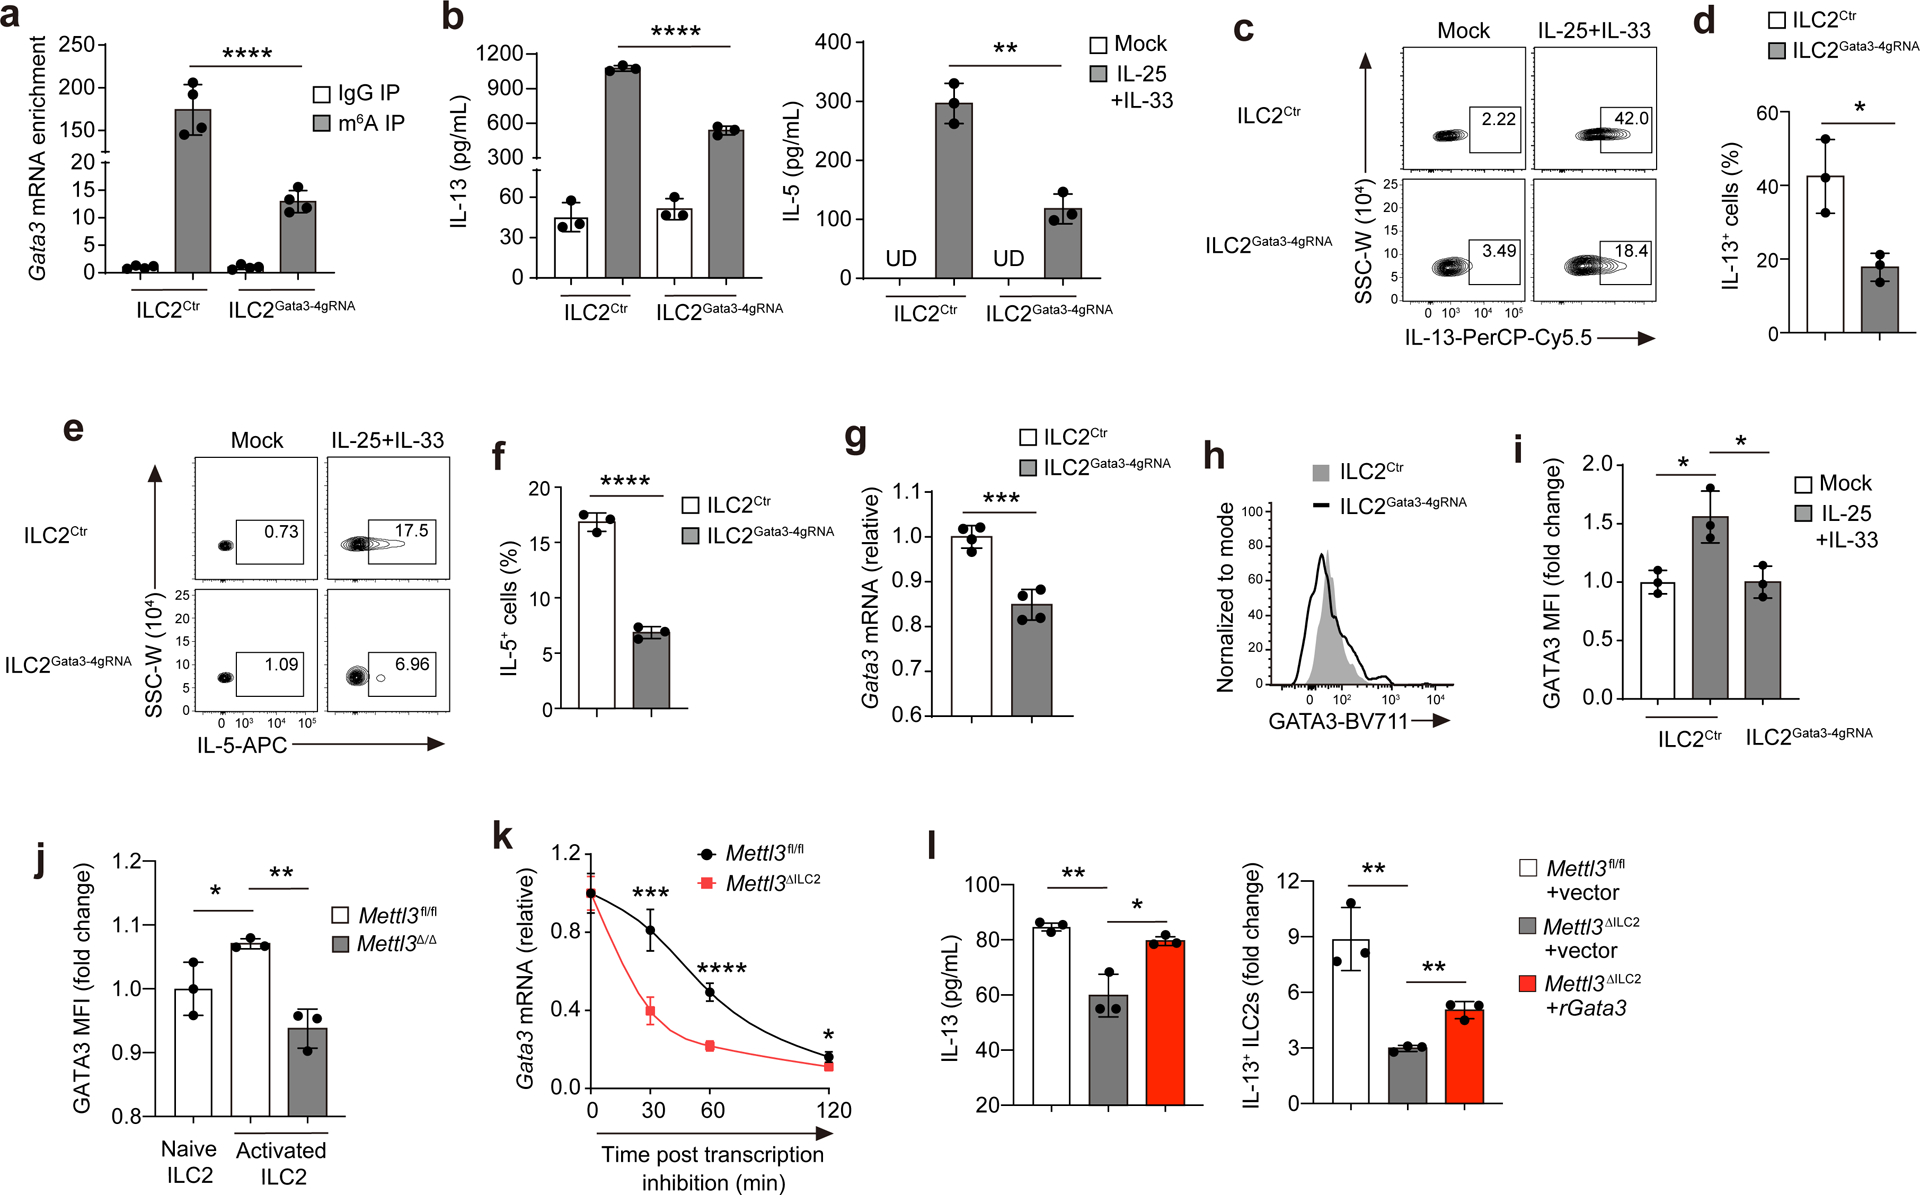
a, Quantification of m6A antibody- or normal IgG-immunoprecipitated Gata3 mRNAs from cultured ILC2/b6 cells that were transfected with dCas13b-Alkbh5 (carrying the enhanced green fluorescent protein (eGFP) reporter) plasmid plus a mixture of four Gata3 gRNAs (ILC2Gata3−4gRNA) or transfected with dCas13b-Alkbh5 plasmid alone (ILC2Ctr); ****P < 0.0001. b, Enzyme-linked immunosorbent assay (ELISA) analysis of IL-13 and IL-5 in the supernatant of cultured iILC2s that were transfected with dCas13b-Alkbh5 and 4gRNA or control plasmids. iILC2s were sorted from MLNs of IL-25-treated B6 mice. Forty-eight hours after transfection, eGFP+ cells were sorted and subjected to a 16-h IL-25 + IL-33 treatment before analysis; ****P < 0.0001(left); **P = 0.0019 (right); UD, undetected. c–f, Representative flow cytometry and quantification of IL-13+ and IL-5+ frequency in ILC2s transfected with dCas13b-Alkbh5 and 4gRNA or control plasmids as in b; *P = 0.0163 (d); ****P < 0.0001 (f). g, RT–qPCR of Gata3 mRNA in ILC2s as in b; ***P = 0.0004. h,i, Representative flow cytometry histogram (g) and quantification of GATA3 MFI in ILC2s as in b. In i, *P = 0.0166 (left) and *P = 0.0208 (right). j, Quantification of GATA3 MFI of intestinal ILC2s from 3-d IL-25-treated Mettl3fl/fl or Mettl3Δ/Δ mice that received three doses of tamoxifen before IL-25 treatment; *P = 0.0448 (left); **P = 0.0019 (right). k, RT–qPCR of Gata3 mRNA in Mettl3fl/fl or Mettl3ΔILC2 intestinal ILC2s that were stimulated in vitro with IL-25 + IL-33 for 4 h followed by actinomycin D treatment for 0, 30, 60 and 120 min; ***P = 0.0006 (30 min); ****P < 0.0001 (60 min); *P = 0.0157 (120 min). l, ELISA analysis of supernatant IL-13 (left) and flow cytometry quantification (right) of the fold increase of IL-13+ cells for Mettl3fl/fl or Mettl3ΔILC2 intestinal ILC2s that were transduced with mouse Gata3-NGFR-RV (rGata3) or control retrovirus (vector), followed by IL-25 + IL-33 treatment for 16 h; ELISA: **P = 0.0055 (left) and *P = 0.0125 (right); FACS: **P = 0.0040 (left) and **P = 0.0020 (right). Data were analyzed by unpaired two-tailed t-test; n = 3–5 in a, b, d and f–l. Data are shown as mean ± s.d. Results are representative of three independent experiments.
To test whether m6A regulated Gata3 mRNA stability, we performed an RNA half-life assay in intestinal KLRG1+ ILC2s sorted from Mettl3ΔILC2 or Mettl3fl/fl mice. Cells were cultured in vitro and stimulated with IL-25 + IL-33 to induce nascent Gata3 mRNA transcription. Thirty minutes after actinomycin D-mediated inhibition of transcription42, Mettl3ΔILC2 KLRG1+ ILC2s lost 60% of the total Gata3 mRNA compared to Mettl3fl/fl KLRG1+ ILC2s, which lost 20% (Fig. 5k). Sixty minutes after transcription inhibition, ~80% of the Gata3 mRNA had decayed in Mettl3ΔILC2 KLRG1+ ILC2s compared to only 50% in Mettl3fl/fl KLRG1+ ILC2s (Fig. 5k). These results suggest that m6A is essential for sustaining the stability of nascent Gata3 mRNA. In addition, retroviral transduction of GATA3 in intestinal KLRG1+ ILC2s sorted from Mettl3ΔILC2 mice significantly rescued the production of IL-13 in these cells in response to IL-25 + IL-33 stimulation in vitro compared to Mettl3ΔILC2 KLRG1+ ILC2s transduced with empty retroviral vector (Fig. 5l). Thus, Gata3 represents a major functional target of m6A modification in activated ILC2s.
Here, we showed that m6A is required for ILC2 activation in response to cytokine stimulation and helminth infection but is dispensable for ILC1, ILC2 and ILC3 maintenance at steady state or the activation of ILC1s or ILC3s. In contrast to Tbx21 in ILC1s and Rorc in ILC3s, which are poorly m6A methylated, m6A regulates the stability of Gata3 mRNA and a Gata3-mediated transcriptional program in activated ILC2s.
In the absence of ILC1- or ILC3-specific Cre mouse lines, we used tamoxifen-mediated inducible deletion of Mettl3, which resulted in a 75–80% loss of m6A modifications on total mRNA in all three ILC subsets. Although the vast majority of m6A mRNA modifications are modulated by the METTL3–METTL14 complex, the m6A writers for other RNA species, such as the U6 small nuclear RNA methyltransferase METTL16, can add m6A on mRNAs17. It is thus possible that m6A methylation of certain transcripts mediated by other m6A writer proteins compensated for the deletion of Mettl3 in ILC1s and ILC3s. The role of other m6A writers in ILCs needs to be investigated.
m6A is generally considered to prompt mRNA decay primarily through the m6A reader YTHDF243, but increasing evidence suggests that m6A can also stabilize mRNA through different reader proteins, such as IGF2BPs and PRRC2C44,45, or by directly modulating RNA structure46. Our targeted demethylation experiments showed that the removal of m6A destabilizes Gata3 mRNA and results in loss of GATA3 upregulation during ILC2 activation. By contrast, the mRNA for Nfil3, a GATA3 transcriptional target, was highly m6A methylated, while the expression of NFIL3 protein was not affected by deletion of Mettl3 in ILC2s, suggesting that m6A modification might prompt Nfil3 mRNA decay, and loss of m6A potentially results in the accumulation of Nfil3 mRNAs despite the downregulation of GATA3. Future investigation into the m6A reader proteins that recognize m6A on mRNAs of Gata3, Nfil3 and other essential genes and m6A modulation of the secondary structure of those mRNAs will be of importance to understand the mechanisms by which m6A regulates mRNA metabolism and ILC2 activation. Collectively, our results report a cell type- and cell state-specific regulation of METTL3-induced m6A RNA modification in the ILC system and reveal how ILC2 activation is controlled at the epitranscriptional level.
Methods
Mice
B6, B6/SJL (CD45.1+ congenic) and Rag2–/–Il2rg–/– mice were from Taconic. Mettl3fl/fl mice were generated by J. H. Hanna at Weizmann Institute of Science. Klrg1Cre mice were generated and provided by R. Flavell at Yale University. Rorc-egfp reporter mice were provided by I. Ivanov at Columbia University. Rosa26CreERT2 mice were from Jackson Laboratories. To induce Cre expression in Mettl3Δ/Δ mice, the recipients were given 2 μg of tamoxifen in 100 μl of corn oil i.p. every other day for three doses. Mice used for experiments were females between 6 and 18 weeks of age, unless otherwise specifically indicated. All animal experiments were performed under the approval by the Institute Animal Care and Use Committee of Columbia University.
Antibodies and reagents
The following fluorochrome-conjugated antibodies were used for flow cytometry: anti-CD3ε (145–2C11), anti-CD5 (53–7.3), anti-CD19 (1D3), anti-B220 (RA3–6B2), anti-CD11b (M1/70), anti-CD11c (N418), anti-NK1.1 (PK136), anti-TCRγδ (eBioGL3), anti-Gr-1 (RB6–8C5), anti-FcεR1 (MAR-1), anti-CD4 (RM4–5), anti-CD8a (53–6.7), anti-CD49b (DX5), anti-TER119 (TER-119), anti-IL-7Rα (A7R34), anti-Thy1.2 (30-H12), anti-c-Kit (2B8), anti-Sca-1 (D7), anti-CD45.1 (A20), anti-CD45.2 (104), anti-IL-13 (eBio13A), anti-IL-5 (TRFK5), anti-T-bet (4B10), anti-Flt3 (A2F10) and anti-NFIL3 (S2M-E19) from eBioscience; anti-Thy1.1 (HIS51) from Thermo Fisher; anti-RORγt (AFKJS-9), anti-α4β7 (DATK32), anti-KLRG1 (2F1), anti-Ki-67 (B56), anti-GATA3 (L50–823) and anti-Stat5 (pY694) from BD Biosciences; anti-CD25 (PC61), anti-NGFR (ME20.4), anti-EpCAM (G8.8) and anti-IL-9R (S18011D) from BioLegend; anti-ST2 (DJ8) from MD Bioproducts and anti-IL-17RB (752101) and biotinylated anti-amphiregulin (AREG) from R&D Systems. Recombinant IL-2, IL-7 IL-25, IL-33, IL-12, IL-18, IL-1β and IL-23 were from R&D Systems, PeproTech or MBL. The LIVE/DEAD fixable dead cell stain kit was from Life Technologies. Anti-METTL3 (EPR18810) for western blotting and immunofluorescence staining was from Abcam. Anti-EpCAM (G8.8) and anti-CD3 (17A2) for immunofluorescence staining were from BioLegend. Anti-KLRG1 (2F1) and anti-Ki-67 (B56) for immunofluorescence staining were from BD Biosciences. Monoclonal antibody to GAPDH (6C5) for western blotting was from ThermoFisher (AM4300). Anti-m6A for meRIP was from Synaptic Systems. Streptavidin was from eBioscience. STM2457 was from Cayman Chemical (34280). Giemsa stain was from Sigma (GS500) and actinomycin D was from Sigma (A9415).
Cell culture
The ILC2/b6 cell line was provided by Q. Yang at Rutgers Institute for Translational Medicine and Science and was cultured in vitro with complete RPMI 1640 medium containing 10 ng ml–1 IL-2, IL-7 and IL-3341.
Isolation leukocytes from lung, MLN, small intestine, liver and bone marrow
Lung tissues were collected after perfusion, disrupted into small pieces and digested for 20 min at 37 °C with Liberase (Roche) plus DNase I (Roche). Tissue pieces were strained into single cells followed by treatment with ACK solution (Life Technologies).
MLN tissues were collected and strained into single cells.
Small intestines were collected, and the contents were emptied. Peyer’s patches were removed, and small intestines were opened longitudinally, cut into small pieces and shaken at 37 °C for 40 min in PBS media containing 10% fetal bovine serum (FBS), 5 mM EDTA and 1 mM dithiothreitol to dissociate intraepithelial leukocytes. The remaining fragments were washed twice with PBS and digested at 37 °C for 45 min in HBSS media containing Liberase and DNase I. The digested tissues were strained to yield a single-cell suspension, which was followed by treatment with ACK solution.
Liver tissues were collected after perfusion and were strained into single cells. Hepatocytes were removed by centrifugation at 30 g for 3 min, and leukocytes in the supernatant were purified by centrifugation with 33% Percoll in PBS solution, followed by treatment with ACK solution.
BM cells were obtained by flushing tibias and femurs, followed by treatment with ACK solution.
Flow cytometry and cell sorting
Cells in PBS solution with 3% FBS were blocked with anti-CD16/CD32 (2.4G2, Harlan Laboratories) and incubated with fluorochromeconjugated antibodies with LIVE/DEAD fixable dead cell stain. Staining and washing were performed at 4 °C. CountBright Absolute Counting Beads (Life Technologies) were added into the cell suspensions before analysis. Cells were analyzed on an LSRII or LSR Fortessa flow cytometer (BD Biosciences), and data were analyzed with FlowJo software. ILCs were gated on live CD45+Lin−Thy1+ and were further gated on RORγt−NK1.1+ as ILC1s, NK1.1−KLRG1+ as ILC2s and RORγt+ as ILC3s. iILC2s were gated as live CD45+Lin−Thy1+/lowST2−KLRG1hi. Lin antibody cocktail included CD3, CD5, CD19, B220, CD11b, CD11c, TCRγδ, Gr-1, FcεR1, CD8α, DX5 and TER119. For cell sorting, cells were stained and washed in a PBS solution with 10% FBS, but LIVE/DEAD dye was omitted. Cells were purified on a FACS Aria cell sorter (BD Biosciences).
Western blotting
ILC1s, ILC2s and ILC3s were sorted from multiple mice and pooled together to obtain at least 100,000 cells for each population. Cells were then lysed in RIPA buffer. Equal amounts of protein from each sample were analyzed by SDS-PAGE, electrophoretic transfer, immunoblotting and chemiluminescent detection. Primary anti-METTL3 was used at a dilution of 1:1,000, and primary anti-GAPDH was used at a dilution of at 1:5,000.
Immunofluorescence staining and confocal imaging
For METTL3 immunofluorescence staining, sorted ILC1s, ILC2s and ILC3s were centrifuged at 500g for 5 min and resuspended in 20 μl of sorting buffer. Cells were dropped on Superfrost Plus microscope slides (Fisherbrand, 1255015) and were completely dried at room temperature. After fixation with 4% paraformaldehyde for 10 min, the cells were washed with PBS twice and permeabilized with 0.2% Triton X-100 for 10 min at room temperature. After washing with PBS twice, cells were blocked with blocking buffer (0.2% Triton X-100 and 5% normal donkey serum in PBS) for 1 h at room temperature. Cells were incubated with primary anti-METTL3 diluted in blocking buffer at 4 °C overnight. Following extensive washing with PBS three times, cells were incubated with fluorophore-conjugated secondary antibodies for 2 h at room temperature. DAPI was used to counterstain the nuclei. A Zeiss LSM T-PMT confocal laser-scanning microscope was used for obtaining the images, and ZEN software was used to quantify the fluorescence intensity.
For confocal imaging of ILC2s in gut tissue, the ileal portion of the small intestine was excised, and each was prepared as a ‘Swiss roll’ and incubated in a fixation and permeabilization solution (BD Biosciences, 554722) overnight, followed by dehydration in 30% sucrose before embedding in optimal cutting temperature freezing medium (Sakura Finetek). Eighteen-micron sections were cut on a CM3050S cryostat (Leica) and adhered to Superfrost Plus slides (VWR). Frozen sections were treated with methanol for 20 min at −20 °C, permeabilized and blocked in PBS containing 0.3% Triton X-100 (Sigma) and 10% normal mouse serum (Jackson Immunoresearch) and stained with antibodies diluted in blocking buffer. After staining, slides were mounted with Fluormount G (Southern Biotech) and examined on a Zeiss LSM-710 confocal microscope. Images were analyzed with Image J software.
RNA isolation and RT-qPCR
Small intestinal tissue pieces or sorted cells were disrupted in TRIZol Reagent, and total RNA was purified according to the manufacturer’s protocol (Life Technologies). Reverse transcription was performed by using a ProtoScript II First Strand cDNA synthesis kit (New England Biolabs) and Oligo (dT)20 primers. qPCR was performed using SYBR Green on a QuantStudio 3 (Applied Biosystems) system. Actb was used to normalize the RNA content of the samples. The following are the primer sequences for Actb, Il5 and Il13 (5’–3’):
| Actb forward | GACGGCCAGGTCATCACTATTG |
| Actb reverse | AGGAAGGCTGGAAAAGAGCC |
| Il5 forward | AGCAATGAGACGATGAGGCT |
| Il5 reverse | AGCATTTCCACAGTACCCCC |
| Il13 forward | GCCAAGATCTGTGTCTCTCCC |
| Il13 reverse | CCAGGTCCACACTCCATACC |
Giemsa staining
Cells were cytospun using Cytospin 4 (Thermo Scientific) at 1,900 r.p.m. for 5 min. Air-dried slides were fixed in methanol for 10 min and stained in 10% Giemsa stain (Sigma) diluted with deionized water for 10 min. The slides were then washed in deionized water and allowed to air dry before microscopic analysis. Cell size was measured by using the Image J software.
Nippostrongylus brasiliensis infection
Mice were inoculated subcutaneously with ~300 stage-three N. brasiliensis larvae. Lung, MLN small intestine tissues were collected on day 5 after inoculation for analysis. Mouse feces were collected from individual mice on days 10 to 11 after inoculation, and eggs in the feces were counted. Worm burden in small intestines was measured on days 14 to 15.
MeRIP-seq and data analysis
Total RNA was isolated from sorted iILC2s from the MLNs of IL-25-treated B6 mice, ILC1s from the liver of IL-12 + IL-18-treated B6 mice, ILC3s from the small intestine of IL-1β + IL-23-treated Rorc-egfp mice and sorted ILC2s from the small intestine of Mettl3ΔILC2 mice and littermate control mice by using an miRNeasy Micro Kit (Qiagen). A fraction of total RNA was set aside as input. Anti-m6A (1.25 μg; Synaptic Systems) was prebound to Protein A/Protein G magnetic beads (Millipore) in immunoprecipitation buffer for 1 h. The sample RNA was incubated with antibody-bound Protein A/Protein G beads for 2 h at 4 °C. The samples were washed twice in low-salt wash buffer, twice with high-salt wash buffer and twice with RIPA buffer. All solutions for each sample were collected as the ‘unbound’ fraction. The RNA pellet was eluted from the beads as the ‘m6A-bound’ fraction by incubating with 50 μl of 20 mM m6A 5-monophosphate sodium salt (Sigma) for 1 h at 4 °C. Following ethanol precipitation, RNAs from input, unbound and m6A-bound fractions were reverse transcribed, amplified, tagmented and indexed according to the NEBNext Single Cell/Low Input RNA Library Prep Kit for Illumina protocol. Three (for iILC2s) or two (for ILC1s, ILC3s, and intestinal ILC2s from Mettl3ΔILC2 mice and littermate controls) biological replicate samples were sequenced using an Illumina HiSeq 2500 with paired-end 150 bp read length.
For meRIP-seq data analysis, adapter sequences were trimmed using Cutadapt (v3.3)47 with default parameters. Reads were mapped to the mouse transcriptome (genome build: GRCm38/mm10; gene annotation: Gencode m25) using STAR aligner (v2.7.9a)48 with parameter ‘--quantMode GeneCounts’ to get the read counts of each gene. For differential transcript analysis, we filtered out low-count genes whose read count were less than 10 in more than half of the samples and identified the differentially methylated genes by comparing the unbound and m6A-bound groups using DESeq249 with default parameters and design formula ‘~ group’. For differential transcript analysis comparing ILC2s from small intestine of Mettl3ΔILC2 mice and littermate control mice, we used similar methods except that the total sequencing read counts of each fraction were normalized to RNA amounts that were subjected to library preparation. Specifically, we provided DESeq2 with following size factor when estimating the library size:
where Ni is the total number of mapped reads of sample i; Ri is the cDNA concentration of the sample, and r is the average cDNA concentration of all samples.
Volcano plots of log2(fold change) and -log10(p value) were generated, with differentially methylated genes highlighted in red (highly methylated) and green (lowly methylated). A heat map of DEseq2-normalized read counts was plotted for genes whose normalized counts were ≥2 in more than 3 samples and whose standard deviation of log2-normalized counts wass ≥0.6. FPKM values were calculated by multiplying the fragment counts, which were estimated by featureCounts50 with scaling factors 109/(L*S), where L is the gene length (exonic), and S is the total number of mapped fragments in the sequencing library. Functional enrichment analysis of highly methylated genes was performed by using gProfiler51 with default parameters. Some of the significantly (adjusted p value <0.05) enriched biological process Gene ontologies are shown, where the top x axis is -log10 (adjusted p value), and the bottom x axis is the number of highly methylated genes found in each Gene ontology term. Gene set enrichment analysis (GSEA)52 on normalized count tables of all genes was performed by using default parameters. The enrichment plots of gene sets that were significantly enriched in the supernatant (methylated RNA) group are presented. Metascape53 was applied on the m6A-bound genes with default parameters to construct the clusters and the network of significantly enriched functions. To meet the web tool’s restriction of the input gene number being less than 3,000, we used a more stringent threshold (fold change of > 3 and false discovery rate P value of < 0.005) to get the m6A-bound genes. For the resulting clusters, we removed those that had only one node and curated the representative functions so that the irrelevant functions were replaced by the second most significant function of that cluster.
MeRIP-RT-qPCR of Gata3
Total RNA was isolated from 200,000 in vitro cultured control (transfected with dPspCas13b-mAlkbh5 plasmid only) or targeted demethylated (transfected with dPspCas13b-mAlkbh5 plasmid plus four gRNAs that targeting Gata3 mRNA) ILC2/b6 cells by using an miRNeasy Micro Kit. m6A immunoprecipitation was performed by using anti-m6A or rabbit IgG (Jackson ImmunoResearch). The RNA eluted from anti-m6A-or rabbit IgG- prebound Protein A/Protein G beads (m6A-bound fraction) was reverse transcribed using a ProtoScript II First-Strand cDNA synthesis kit. Enrichment of m6A-containing transcripts was determined by qPCR.
The following primer sequences for Gata3 were used (5’–3’):
| Gata3 forward | GAGGAGGAACGCTAATGGGG |
| Gata3 reverse | CGGGTCTGGATGCCTTCTTT |
Targeted demethylation
The fusion protein construct (dPspCas13b-mAlkbh5) was designed and generated on the pcDNA3.1(+)-P2AeGFP vector backbone (GenScript) as previously described27. Four guide RNAs were designed to target the mouse Gata3 transcript. The gRNA sequences are provided below (5’−3’). For cell transfection, in vitro-cultured ILC2/b6 cells or IL-25-induced iILC2s sorted from B6 mice were electroporated with both the fusion protein construct and the gRNA construct by using a P3 Primary Cell 4D-Nucleofector X Kit S (Lonza V4XP-3032) and a 4D-Nucleofector system using the program DN-100. eGFP+ cells were sorted 24 h after transfection and cultured for another 2 d before stimulation or analysis.
| gRNA1-forward | caccAAAAAGTACGTCCACCTCTTCCGTCAGCGGATACTGAGCT |
| gRNA1-reverse | caacAGCTCAGTATCCGCTGACGGAAGAGGTGGACGTACTTTTT |
| gRNA2-forward | caccCTCCAGCTTCATGCTATCTGGCAGCTGCACCTGATACTTG |
| gRNA2-reverse | caacCAAGTATCAGGTGCAGCTGCCAGATAGCATGAAGCTGGAG |
| gRNA3-forward | caccAGTCCAGAGCTGTACTCGGGCACATAGGGCGGATAGGTGG |
| gRNA3-reverse | caacCCACCTATCCGCCCTATGTGCCCGAGTACAGCTCTGGACT |
| gRNA4-forward | caccATATTATGAAGCTTGTAGTACAGCCCACAGGCATTGCAGA |
| gRNA4-reverse | caacTCTGCAATGCCTGTGGGCTGTACTACAAGCTTCATAATAT |
Retroviral transduction
The NGFR-RV empty vector and mouse Gata3-NGFR-RV plasmids were provided by J. Zhu at NIAID, NIH. Retroviruses were produced by transfecting 293T cells with plasmids along with pCL-Eco and collecting culture medium at 48 h and 72 h. Sorted intestinal ILC2s were transduced with retrovirus particles in the presence of 8 μg ml−1 polybrene and centrifuged at 1,400 g for 90 min at 20 °C. The cells were then collected and cultured with completed RPMI1640 containing 10 ng ml−1 of IL-2 and IL-7. Forty-eight hours after transduction, NGFR+ cells were sorted and treated with or without IL-25 + IL-33 for 16 h for further analysis.
STM2457 treatment
Sorted intestinal ILC2s from B6 mice were cultured with completed RPMI1640 containing 10 ng ml−1 of IL-2 and IL-7. Cultured cells were treated with either DMSO as a mock control or STM2457 (30 μM or 100 μM) for 48 h, and treated with IL-25 + IL-33 for 16 h for further analysis.
ELISA
Cells were cultured in 96-well plates with ~2 × 10³ cells per well, and supernatants were collected and diluted. The concentration of secreted IL-13 protein was determined with a mouse IL-13 uncoated ELISA kit (Invitrogen) by using Synergy 2 Microplate reader (BioTek). The concentration of secreted IL-5 protein was determined with a mouse IL-5 ELISA MAX™ Deluxe Set kit (BioLegend).
Statistical analysis
Sample and experiment sizes were determined empirically for sufficient statistical power. No statistical tests were used to predetermine the size of experiments. No samples were excluded specifically from analysis, and no randomization or blinding protocol were used. Data distribution was assumed to be normal, but this was not formally tested. GraphPad Prism software was used for statistical analysis. Statistical differences for experiments were determined by unpaired two-tailed t-test. A p value of ≤ 0.05 was considered to represent means that were statistically different. Statistical analysis was performed on groups with similar variance. Limited variance was observed within sample groups.
Extended Data
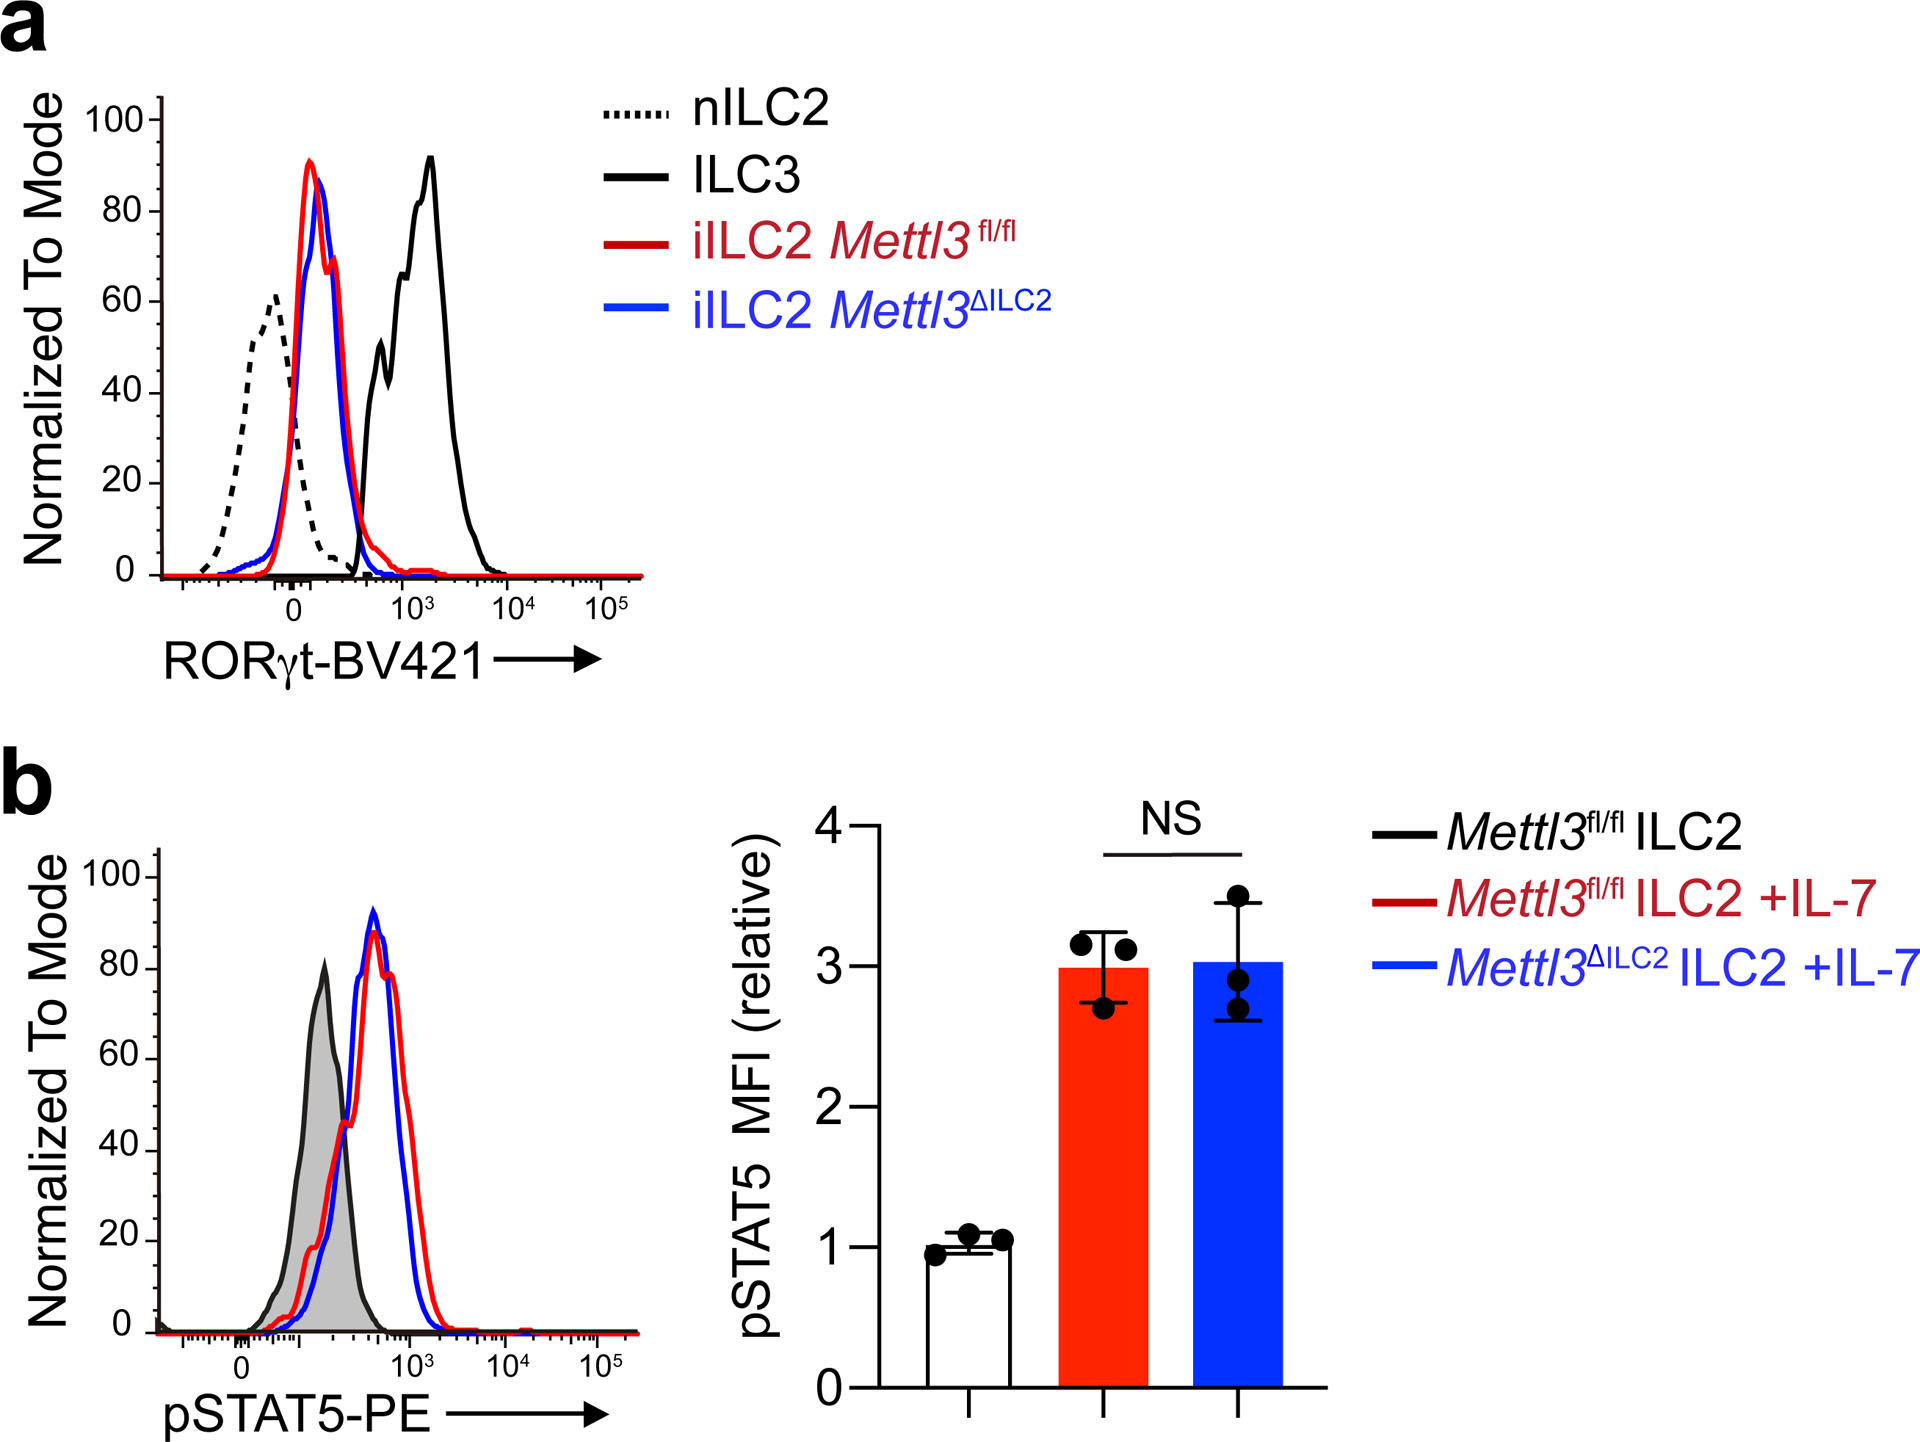
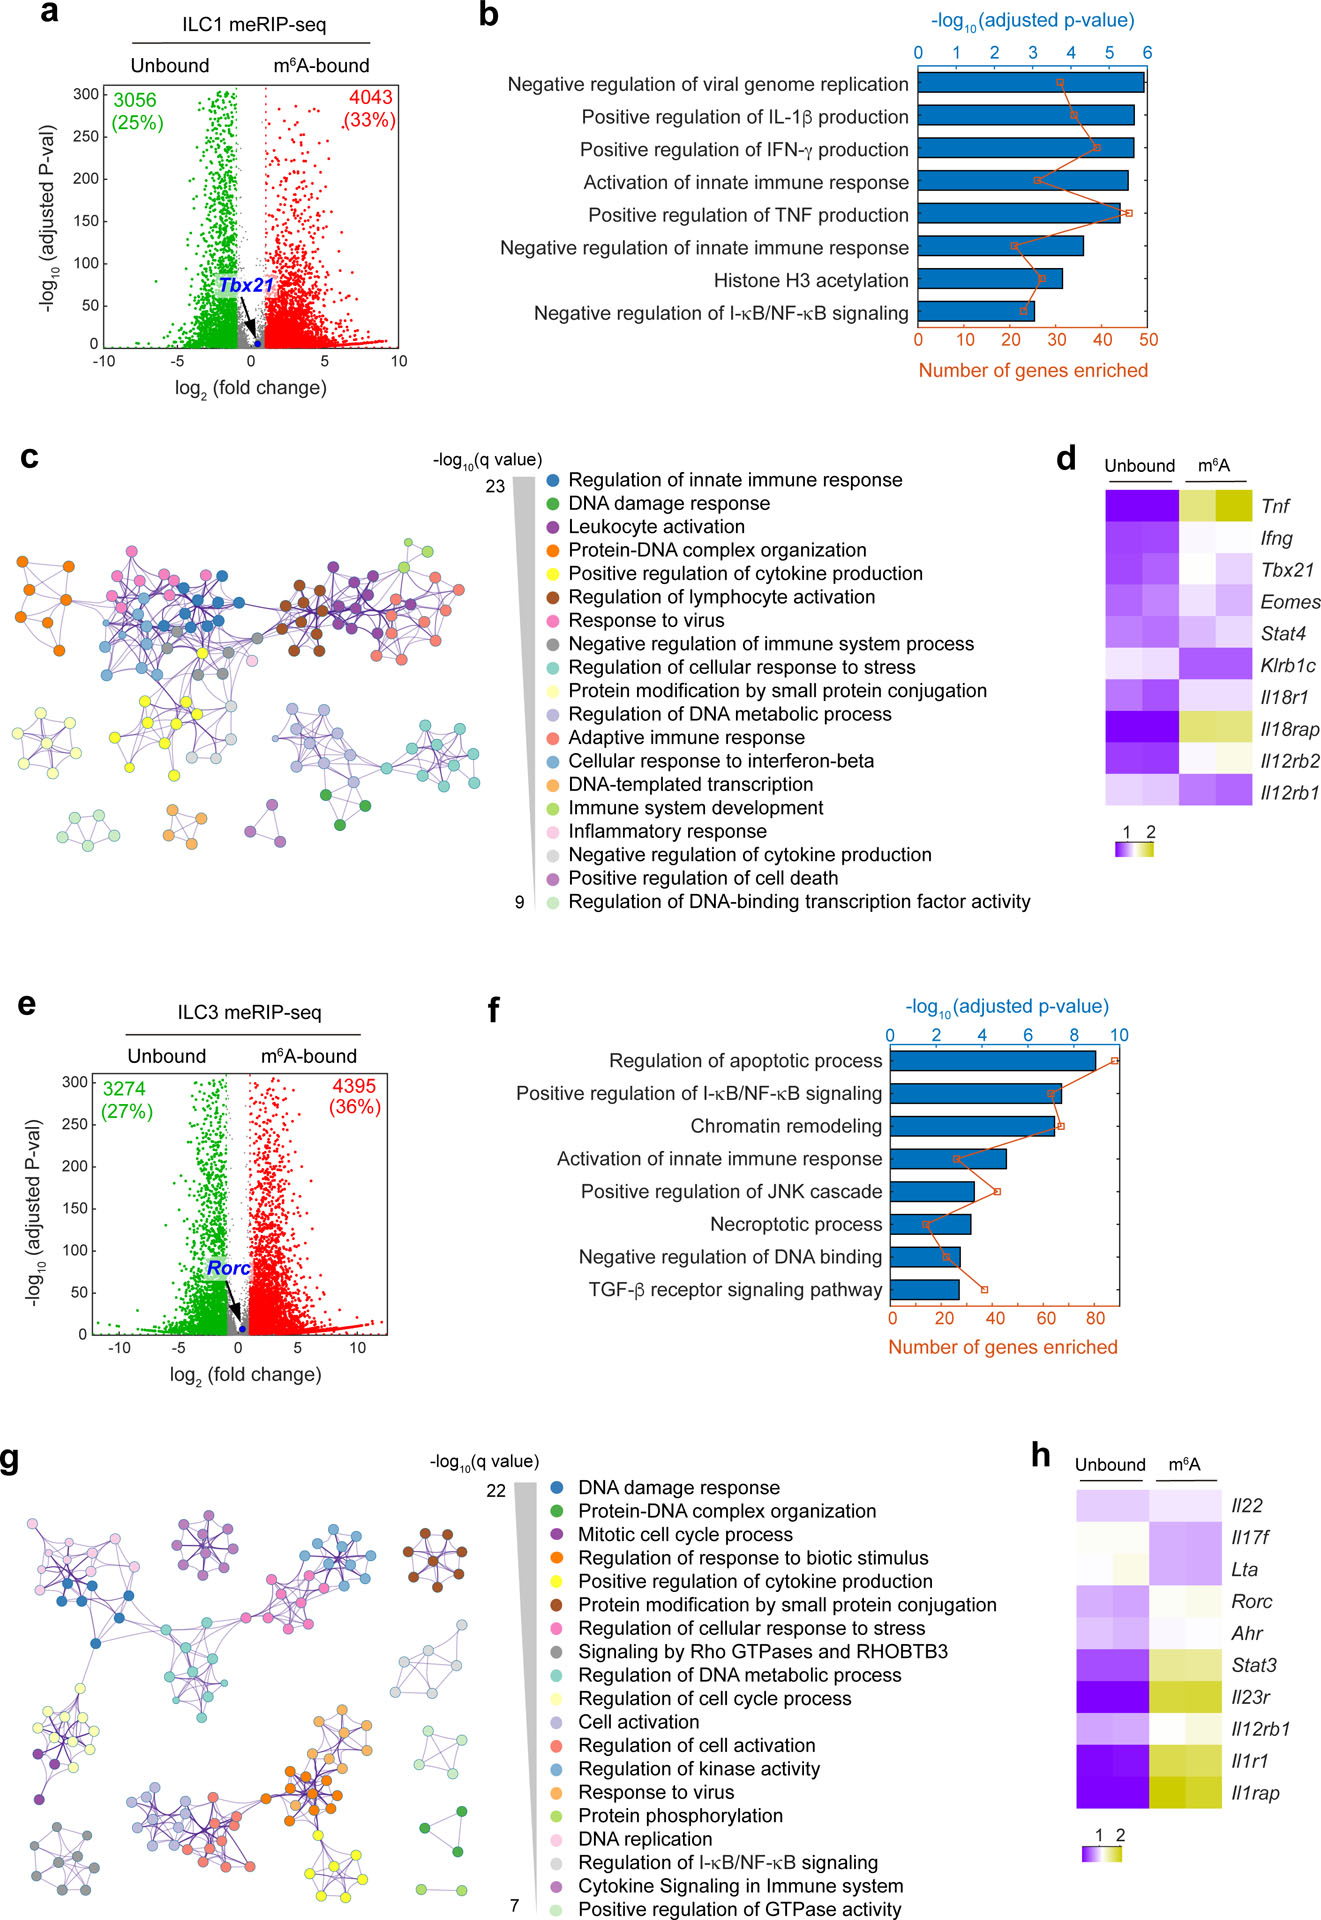
Acknowledgments
We thank all members of the Huang lab for discussions and assistance on experiments. We thank R. Flavell and I. Ivanov for providing critical mouse lines, J. Zhu for providing Gata3-NGFR-RV and NGFR-RV plasmids, Q. Yang for providing the ILC2/b6 cell line, Columbia Department of Microbiology and Immunology and the Columbia Stem Cell Initiative core facilities staff for assistance with cell sorting and S. Reiner for critical reading of the manuscript. This work was supported by NIGMS 1R35GM138805 (Y.H.), Columbia HICCC TBM Pilot Award Program (Y.H.) and NIAID 5RO1AI43897 (U.B.). Y.Z. was also supported by an AAI Career Reentry Fellowship.
Footnotes
Competing interests: The authors declare no competing interests.
Reporting summary
Further information on research design is available in the Nature Portfolio Reporting Summary linked to this article.
Data availability
MeRIP-seq data are available in the Gene Expression Omnibus database (accession number GSE223084). Source data are provided with this paper.
References
- 1.Eberl G, Di Santo JP & Vivier E The brave new world of innate lymphoid cells. Nat Immunol 16, 1–5, doi: 10.1038/ni.3059 (2015). [DOI] [PubMed] [Google Scholar]
- 2.Huang Y et al. S1P-dependent interorgan trafficking of group 2 innate lymphoid cells supports host defense. Science 359, 114–119, doi: 10.1126/science.aam5809 (2018). [DOI] [PMC free article] [PubMed] [Google Scholar]
- 3.Neill DR et al. Nuocytes represent a new innate effector leukocyte that mediates type-2 immunity. Nature 464, 1367–U1369, doi: 10.1038/nature08900 (2010). [DOI] [PMC free article] [PubMed] [Google Scholar]
- 4.Van Dyken SJ et al. A tissue checkpoint regulates type 2 immunity. Nature Immunology 17, 1381–1387, doi: 10.1038/ni.3582 (2016). [DOI] [PMC free article] [PubMed] [Google Scholar]
- 5.Kim BS et al. TSLP Elicits IL-33-Independent Innate Lymphoid Cell Responses to Promote Skin Inflammation. Sci Transl Med 5, doi:ARTN 170ra16 10.1126/scitranslmed.3005374 (2013). [DOI] [PMC free article] [PubMed] [Google Scholar]
- 6.Mjosberg J et al. The transcription factor GATA3 is essential for the function of human type 2 innate lymphoid cells. Immunity 37, 649–659, doi: 10.1016/j.immuni.2012.08.015 (2012). [DOI] [PubMed] [Google Scholar]
- 7.Roediger B et al. IL-2 is a critical regulator of group 2 innate lymphoid cell function during pulmonary inflammation. J Allergy Clin Immun 136, 1653–U1345, doi: 10.1016/j.jaci.2015.03.043 (2015). [DOI] [PubMed] [Google Scholar]
- 8.Cardoso V et al. Neuronal regulation of type 2 innate lymphoid cells via neuromedin U. Nature 549, 277–281, doi: 10.1038/nature23469 (2017). [DOI] [PMC free article] [PubMed] [Google Scholar]
- 9.Nussbaum JC et al. Type 2 innate lymphoid cells control eosinophil homeostasis. Nature 502, 245-+, doi: 10.1038/nature12526 (2013). [DOI] [PMC free article] [PubMed] [Google Scholar]
- 10.Nagashima H et al. Neuropeptide CGRP Limits Group 2 Innate Lymphoid Cell Responses and Constrains Type 2 Inflammation. Immunity 51, 682-+, doi: 10.1016/j.immuni.2019.06.009 (2019). [DOI] [PMC free article] [PubMed] [Google Scholar]
- 11.Wojno EDT et al. The prostaglandin D-2 receptor CRTH2 regulates accumulation of group 2 innate lymphoid cells in the inflamed lung. Mucosal Immunol 8, 1313–1323, doi: 10.1038/mi.2015.21 (2015). [DOI] [PMC free article] [PubMed] [Google Scholar]
- 12.Doherty TA et al. Lung type 2 innate lymphoid cells express cysteinyl leukotriene receptor 1, which regulates TH2 cytokine production. J Allergy Clin Immunol 132, 205–213, doi: 10.1016/j.jaci.2013.03.048 (2013). [DOI] [PMC free article] [PubMed] [Google Scholar]
- 13.Barnig C et al. Lipoxin A4 regulates natural killer cell and type 2 innate lymphoid cell activation in asthma. Sci Transl Med 5, 174ra126, doi: 10.1126/scitranslmed.3004812 (2013). [DOI] [PMC free article] [PubMed] [Google Scholar]
- 14.Yu Y et al. Single-cell RNA-seq identifies a PD-1(hi) ILC progenitor and defines its development pathway. Nature 539, 102–106, doi: 10.1038/nature20105 (2016). [DOI] [PubMed] [Google Scholar]
- 15.Maazi H et al. ICOS:ICOS-Ligand Interaction Is Required for Type 2 Innate Lymphoid Cell Function, Homeostasis, and Induction of Airway Hyperreactivity. Immunity 42, 538–551, doi: 10.1016/j.immuni.2015.02.007 (2015). [DOI] [PMC free article] [PubMed] [Google Scholar]
- 16.Salimi M et al. A role for IL-25 and IL-33-driven type-2 innate lymphoid cells in atopic dermatitis. Journal of Experimental Medicine 210, 2939–2950, doi: 10.1084/jem.20130351 (2013). [DOI] [PMC free article] [PubMed] [Google Scholar]
- 17.He PC & He C m(6) A RNA methylation: from mechanisms to therapeutic potential. EMBO J 40, e105977, doi: 10.15252/embj.2020105977 (2021). [DOI] [PMC free article] [PubMed] [Google Scholar]
- 18.Geula S et al. Stem cells. m6A mRNA methylation facilitates resolution of naive pluripotency toward differentiation. Science 347, 1002–1006, doi: 10.1126/science.1261417 (2015). [DOI] [PubMed] [Google Scholar]
- 19.Batista PJ et al. m(6)A RNA modification controls cell fate transition in mammalian embryonic stem cells. Cell Stem Cell 15, 707–719, doi: 10.1016/j.stem.2014.09.019 (2014). [DOI] [PMC free article] [PubMed] [Google Scholar]
- 20.Cheng Y et al. m(6)A RNA Methylation Maintains Hematopoietic Stem Cell Identity and Symmetric Commitment. Cell Rep 28, 1703–1716 e1706, doi: 10.1016/j.celrep.2019.07.032 (2019). [DOI] [PMC free article] [PubMed] [Google Scholar]
- 21.Lee H et al. Stage-specific requirement for Mettl3-dependent m(6)A mRNA methylation during haematopoietic stem cell differentiation. Nat Cell Biol 21, 700–709, doi: 10.1038/s41556-019-0318-1 (2019). [DOI] [PMC free article] [PubMed] [Google Scholar]
- 22.Li HB et al. m(6)A mRNA methylation controls T cell homeostasis by targeting the IL-7/STAT5/SOCS pathways. Nature 548, 338–342, doi: 10.1038/nature23450 (2017). [DOI] [PMC free article] [PubMed] [Google Scholar]
- 23.Zheng Z et al. Control of Early B Cell Development by the RNA N(6)-Methyladenosine Methylation. Cell Rep 31, 107819, doi: 10.1016/j.celrep.2020.107819 (2020). [DOI] [PMC free article] [PubMed] [Google Scholar]
- 24.Nair L et al. Mechanism of noncoding RNA-associated N(6)-methyladenosine recognition by an RNA processing complex during IgH DNA recombination. Mol Cell 81, 3949–3964 e3947, doi: 10.1016/j.molcel.2021.07.037 (2021). [DOI] [PMC free article] [PubMed] [Google Scholar]
- 25.Meyer KD & Jaffrey SR Rethinking m(6)A Readers, Writers, and Erasers. Annu Rev Cell Dev Biol 33, 319–342, doi: 10.1146/annurev-cellbio-100616-060758 (2017). [DOI] [PMC free article] [PubMed] [Google Scholar]
- 26.Shih HY et al. Developmental Acquisition of Regulomes Underlies Innate Lymphoid Cell Functionality. Cell 165, 1120–1133, doi: 10.1016/j.cell.2016.04.029 (2016). [DOI] [PMC free article] [PubMed] [Google Scholar]
- 27.Gasteiger G, Fan X, Dikiy S, Lee SY & Rudensky AY Tissue residency of innate lymphoid cells in lymphoid and nonlymphoid organs. Science 350, 981–985, doi: 10.1126/science.aac9593 (2015). [DOI] [PMC free article] [PubMed] [Google Scholar]
- 28.Moro K et al. Interferon and IL-27 antagonize the function of group 2 innate lymphoid cells and type 2 innate immune responses. Nat Immunol 17, 76–86, doi: 10.1038/ni.3309 (2016). [DOI] [PubMed] [Google Scholar]
- 29.Huang YF et al. IL-25-responsive, lineage-negative KLRG1(hi) cells are multipotential ‘inflammatory’ type 2 innate lymphoid cells. Nature Immunology 16, 161-+, doi: 10.1038/ni.3078 (2015). [DOI] [PMC free article] [PubMed] [Google Scholar]
- 30.Lin S, Choe J, Du P, Triboulet R & Gregory RI The m(6)A Methyltransferase METTL3 Promotes Translation in Human Cancer Cells. Mol Cell 62, 335–345, doi: 10.1016/j.molcel.2016.03.021 (2016). [DOI] [PMC free article] [PubMed] [Google Scholar]
- 31.Liu P et al. m(6)A-independent genome-wide METTL3 and METTL14 redistribution drives the senescence-associated secretory phenotype. Nat Cell Biol 23, 355–365, doi: 10.1038/s41556-021-00656-3 (2021). [DOI] [PMC free article] [PubMed] [Google Scholar]
- 32.Yankova E et al. Small-molecule inhibition of METTL3 as a strategy against myeloid leukaemia. Nature 593, 597–601, doi: 10.1038/s41586-021-03536-w (2021). [DOI] [PMC free article] [PubMed] [Google Scholar]
- 33.Sun XM et al. Size-Dependent Increase in RNA Polymerase II Initiation Rates Mediates Gene Expression Scaling with Cell Size. Curr Biol 30, 1217-+, doi: 10.1016/j.cub.2020.01.053 (2020). [DOI] [PubMed] [Google Scholar]
- 34.Vargas-Garcia CA, Ghusinga KR & Singh A Cell size control and gene expression homeostasis in single-cells. Curr Opin Syst Biol 8, 109–116, doi: 10.1016/j.coisb.2018.01.002 (2018). [DOI] [PMC free article] [PubMed] [Google Scholar]
- 35.Hoyler T et al. The transcription factor GATA-3 controls cell fate and maintenance of type 2 innate lymphoid cells. Immunity 37, 634–648, doi: 10.1016/j.immuni.2012.06.020 (2012). [DOI] [PMC free article] [PubMed] [Google Scholar]
- 36.Herndler-Brandstetter D et al. KLRG1(+) Effector CD8(+) T Cells Lose KLRG1, Differentiate into All Memory T Cell Lineages, and Convey Enhanced Protective Immunity. Immunity 48, 716–729 e718, doi: 10.1016/j.immuni.2018.03.015 (2018). [DOI] [PMC free article] [PubMed] [Google Scholar]
- 37.Vivier E et al. Innate Lymphoid Cells: 10 Years On. Cell 174, 1054–1066, doi: 10.1016/j.cell.2018.07.017 (2018). [DOI] [PubMed] [Google Scholar]
- 38.Wei G et al. Genome-wide analyses of transcription factor GATA3-mediated gene regulation in distinct T cell types. Immunity 35, 299–311, doi: 10.1016/j.immuni.2011.08.007 (2011). [DOI] [PMC free article] [PubMed] [Google Scholar]
- 39.Zhu J GATA3 Regulates the Development and Functions of Innate Lymphoid Cell Subsets at Multiple Stages. Front Immunol 8, 1571, doi: 10.3389/fimmu.2017.01571 (2017). [DOI] [PMC free article] [PubMed] [Google Scholar]
- 40.Li JX et al. Targeted mRNA demethylation using an engineered dCas13b-ALKBH5 fusion protein. Nucleic Acids Res 48, 5684–5694, doi: 10.1093/nar/gkaa269 (2020). [DOI] [PMC free article] [PubMed] [Google Scholar]
- 41.Zhang K et al. Cutting Edge: Notch Signaling Promotes the Plasticity of Group-2 Innate Lymphoid Cells. J Immunol 198, 1798–1803, doi: 10.4049/jimmunol.1601421 (2017). [DOI] [PMC free article] [PubMed] [Google Scholar]
- 42.Perry RP & Kelley DE Inhibition of RNA synthesis by actinomycin D: characteristic dose-response of different RNA species. J Cell Physiol 76, 127–139, doi: 10.1002/jcp.1040760202 (1970). [DOI] [PubMed] [Google Scholar]
- 43.Wang X et al. N6-methyladenosine-dependent regulation of messenger RNA stability. Nature 505, 117–120, doi: 10.1038/nature12730 (2014). [DOI] [PMC free article] [PubMed] [Google Scholar]
- 44.Huang H et al. Recognition of RNA N(6)-methyladenosine by IGF2BP proteins enhances mRNA stability and translation. Nat Cell Biol 20, 285–295, doi: 10.1038/s41556-018-0045-z (2018). [DOI] [PMC free article] [PubMed] [Google Scholar]
- 45.Wu R et al. A novel m(6)A reader Prrc2a controls oligodendroglial specification and myelination. Cell Res 29, 23–41, doi: 10.1038/s41422-018-0113-8 (2019). [DOI] [PMC free article] [PubMed] [Google Scholar]
- 46.Liu B et al. A potentially abundant junctional RNA motif stabilized by m(6)A and Mg(2). Nat Commun 9, 2761, doi: 10.1038/s41467-018-05243-z (2018). [DOI] [PMC free article] [PubMed] [Google Scholar]
- 47.Martin M Cutadapt removes adapter sequences from high-throughput sequencing reads. EMBnet.journal 17, 3, doi: 10.14806/ej.17.1.200 (2011). [DOI] [Google Scholar]
- 48.Dobin A et al. STAR: ultrafast universal RNA-seq aligner. Bioinformatics 29, 15–21, doi: 10.1093/bioinformatics/bts635 (2013). [DOI] [PMC free article] [PubMed] [Google Scholar]
- 49.Love MI, Huber W & Anders S Moderated estimation of fold change and dispersion for RNA-seq data with DESeq2. Genome Biol 15, 550, doi: 10.1186/s13059-014-0550-8 (2014). [DOI] [PMC free article] [PubMed] [Google Scholar]
- 50.Liao Y, Smyth GK & Shi W featureCounts: an efficient general purpose program for assigning sequence reads to genomic features. Bioinformatics 30, 923–930, doi: 10.1093/bioinformatics/btt656 (2014). [DOI] [PubMed] [Google Scholar]
- 51.Raudvere U et al. g:Profiler: a web server for functional enrichment analysis and conversions of gene lists (2019 update). Nucleic Acids Res 47, W191–W198, doi: 10.1093/nar/gkz369 (2019). [DOI] [PMC free article] [PubMed] [Google Scholar]
- 52.Subramanian A et al. Gene set enrichment analysis: a knowledge-based approach for interpreting genome-wide expression profiles. Proc Natl Acad Sci U S A 102, 15545–15550, doi: 10.1073/pnas.0506580102 (2005). [DOI] [PMC free article] [PubMed] [Google Scholar]
- 53.Zhou Y et al. Metascape provides a biologist-oriented resource for the analysis of systems-level datasets. Nat Commun 10, 1523, doi: 10.1038/s41467-019-09234-6 (2019). [DOI] [PMC free article] [PubMed] [Google Scholar]
Associated Data
This section collects any data citations, data availability statements, or supplementary materials included in this article.
Data Availability Statement
MeRIP-seq data are available in the Gene Expression Omnibus database (accession number GSE223084). Source data are provided with this paper.


