

Abstract
Background
Several strains of bacteria have sequenced and annotated genomes, which have been used in conjunction with biochemical and physiological data to reconstruct genome-scale metabolic networks. Such reconstruction amounts to a two-dimensional annotation of the genome. These networks have been analyzed with a constraint-based formalism and a variety of biologically meaningful results have emerged. Staphylococcus aureus is a pathogenic bacterium that has evolved resistance to many antibiotics, representing a significant health care concern. We present the first manually curated elementally and charge balanced genome-scale reconstruction and model of S. aureus' metabolic networks and compute some of its properties.
Results
We reconstructed a genome-scale metabolic network of S. aureus strain N315. This reconstruction, termed iSB619, consists of 619 genes that catalyze 640 metabolic reactions. For 91% of the reactions, open reading frames are explicitly linked to proteins and to the reaction. All but three of the metabolic reactions are both charge and elementally balanced. The reaction list is the most complete to date for this pathogen. When the capabilities of the reconstructed network were analyzed in the context of maximal growth, we formed hypotheses regarding growth requirements, the efficiency of growth on different carbon sources, and potential drug targets. These hypotheses can be tested experimentally and the data gathered can be used to improve subsequent versions of the reconstruction.
Conclusion
iSB619 represents comprehensive biochemically and genetically structured information about the metabolism of S. aureus to date. The reconstructed metabolic network can be used to predict cellular phenotypes and thus advance our understanding of a troublesome pathogen.
Background
Staphylococcus aureus is a pathogenic gram-positive bacterium that causes a variety of disease conditions, some life-threatening, both in hospital settings and in the community at large. Moreover, various strains of this organism have evolved resistance to some of the most clinically useful antibiotics, including methicillin and vancomycin[1]. Although the mechanisms of antibiotic resistance and infection have been elucidated, there is little published information regarding the basic and systemic biochemical function of S. aureus, especially under carefully controlled environmental conditions in chemically-defined media. While some research has been performed towards this goal[2], its scope and extent does not compare to the research undertaken for better-studied model organisms. In fact, the annotated genome sequence of a strain of S. aureus contains much more readily-available specific information regarding the organism's metabolism than does a compilation of literature data[3].
The annotated genome of a microorganism, in conjunction with biochemical and physiological data, can be used to reconstruct the metabolic network of that organism[4,5]. Such reconstructed networks consist of a set of chemical reactions that together comprise the known metabolic transformations that take place in a particular organism. These networks are at the genome-scale when all or most of the genes with known metabolic function are included in the network reconstruction. These network reconstructions convey the interactions between cellular components identified from the sequence annotation, and thus reconstructions can be thought of as two-dimensional annotation of the genome[6].
Genome-scale reconstructions (GENREs) represent a biochemically and genetically structured database that can be queried and interrogated using in silico analytical methods[7]. With the imposition of appropriate constraints on the reactions in the GENRE, including their exact stoichiometry and reversibility, a genome-scale model (GEM) is formulated. GEMs reflect allowable network states, or phenotypes of a cell, by defining a range of permissible solutions consistent with its mathematical representation[5]. This range of allowable states can be searched for the 'best' growth rates using linear programming methods, and the results from such computations are close to experimental observations [8-11].
GEMs using the constraint-based modeling formalism have been constructed for a number of microorganisms, including Escherichia coli[12], Saccharomyces cerevisiae[13,14], Methylobacterium extorquens [15], Mannheimia succiniciproducens[16], Helicobacter pylori[17] and Haemophilus influenzae[18], and reconstructed networks for human cells are beginning to appear[19]. GEMs are amenable to a wide variety of analysis techniques, yielding a number of interesting results, as recently reviewed[7]. Importantly, GENREs are two-dimensional annotations, are portable, and can be used for computations by different laboratories. In particular, the GENREs for E. coli and S. cerevisiae have been analyzed by groups around the world (see http://systemsbiology.ucsd.edu/organisms/ecoli/ecoli_others.html for a partial list). These analyses have led to several publications of general interest that focus on such diverse topics as the causes of enzyme dispensability[20], the reconfiguration of metabolism following the loss of a gene or enzyme function[21], and the distribution of metabolic fluxes in microorganisms[22].
GEMs do not only give valuable computational results, but they also provide a wealth of hypotheses that can be experimentally tested[8,23-26]. The generation of easily testable hypothesis by biological models permits model validation and improvement through iterative model building[23]. When the predictions made by a model do not agree with experimental observations, the knowledge that went into the model construction is clearly not complete regarding the area of disagreement. Importantly, an in silico model allows us to identify areas where our understanding of an organism is inadequate and where additional experimentation is needed[27].
The work reported herein describes the first manually curated genome-scale elementally and charge balanced metabolic reconstruction and model for the important pathogen S. aureus, termed iSB619 following a previously described naming convention[25], representing the first draft of its two-dimensional annotation[6]. This GENRE allows for the formulation of hypothesis ranging from relative growth capabilities on different media to the outcome of potential gene deletion experiments. Importantly, due to the curation and refinement necessary to form a functional GEM for S. aureus, the work reported contains the most comprehensive metabolic reaction list available for this significant pathogen that is consistent with known phenotypic functions.
Results and discussion
Basic network properties
We have formulated a GENRE for S. aureus strain N315 consisting of 619 genes, 537 proteins, 640 reactions, and 571 metabolites. The entire reaction list of this GENRE is included in the supplemental material [see Additional file 5 and Additional file 2] and is also available at http://systemsbiology.ucsd.edu/organisms. A set of metabolic maps graphically representing the GENRE is also available at the same web address. This GENRE was built without the benefit of an earlier manually curated reconstruction and model and should be considered a first-draft to the two-dimensional annotation of the S. aureus genome. Unlike other initial GENREs[17,18,28], the S. aureus GENRE is nearly completely elementally and charge balanced. All but three reactions produce no net change in terms of chemical elements and charge. Of these three reactions, one (1,4-dihydroxy-2-naphthoate octaprenyltransferase, abbreviated DHNAOT) is never used because it is a dead-end (see below), one (phosphatidic acid synthase, abbreviated PASYN_SA) is a weighted combination of various fatty acids to form an average phosphatidate molecule for this organism, and one (2,3-diketo-5-methylthio-1-phosphopentane degradation reaction, abbreviated DKMPPD2) participates in methionine and spermidine metabolism.
Most of the reactions (91%) in the GENRE are associated with one or more genes with only 9% (59) of the reactions included without a known gene. The reactions that do not have a gene association are principally transport reactions, allowing metabolites to cross the cell membrane, and reactions that involve the formation of lipids and other cell wall components [see Additional file 6]. The inclusion of these reactions, as well as the reactions which we were able to associate with a gene despite their absence in the genome annotation (detailed in Materials and Methods), is a legacy-data based enhancement of genome-annotation based knowledge on the metabolism of S. aureus. We provide the most comprehensive reaction list to date, including reactions that were added based on systemic analysis [see Additional file 9] – the GEM cannot produce biomass without them. All reactions that are associated with genes are also associated with proteins, and they are represented by what have been termed gene-protein-reaction (GPR) associations[25], which are available as Boolean statements connecting genes to reactions in the supplementary material [see Additional file 8] and in graphical form at http://systemsbiology.ucsd.edu/organisms. Basic properties of the reconstructed network are summarized in Table 1.
Table 1.
Basic network properties
| Genes | 619 |
| Proteins | 537 |
| Reactions | 640 |
| Reactions with gene associations | 581 |
| Metabolites | 571 |
| Exchange fluxes | 84 |
Particularly because this is a first-pass reconstruction, the network has a significant number of dead-end metabolites, as other GENREs do[14,17,18,25]. These dead-ends are compounds that are either only produced or only consumed by reactions in the network. Three hypotheses exist regarding the presence of a dead-end metabolite in a reconstructed network: (1) other enzymes required to produce or consume the metabolite may be missing in the reconstruction, (2) the reaction that causes the dead-end may have been misidentified based on a homology search and may not actually occur in the organism, or (3) the dead-end may exist in organism. Because the accumulation or depletion of any compound cannot occur in a steady-state, any reaction in the network involving any of these compounds cannot be used in a computed network state. In total, 108 reactions present in the reconstruction involve dead-end metabolites. All of these reactions have an associated gene and are included because of genetic evidence that they are present in S. aureus. Subsequent additions to the model will likely close some of these gaps. These reactions are further detailed in the supplemental material [see Additional file 3].
A reaction representing biomass formation, consisting of 58 metabolites required for cellular growth, has been defined and is detailed comprehensively in the supplemental material [see Additional file 1]. Key components of this reaction include amino acids, nucleotides, lipids, and cell wall constituents. Because data describing the biomass composition of S. aureus could not be located in the literature, data from Bacillus subtilis was substituted where necessary[29]; quantitative data specific to S. aureus accounts for only a small fraction of the biomass function. Although a comprehensive biomass function has been published for E. coli and used to analyze the networks of other initial reconstructions[17,18], this was not appropriate for S. aureus because of the differences between gram-positive and gram-negative bacteria. The relative quantities of each required metabolite were included in the biomass function when information existed, but many of the trace compounds were included in small ratios that are not quantitatively accurate. It has been shown previously that the calculated biomass production is relatively insensitive to the exact ratios used in the biomass function[30]. The biomass function is a key element of the linear programming (LP) formulation used for hypothesis generation because it allows for the computational prediction of growth.
Minimal media and growth requirements
Linear programming using the assumptions of flux-balance analysis (FBA) allows for the computation of feasible steady-state fluxes through a reaction network that maximize a particular objective and satisfy various constraints, including stoichiometry, thermodynamics, and enzyme capacity[7,31-33]. Specifically, we used FBA to determine fluxes leading to optimal growth subject to constraints on the usage of each reaction. This principle allowed us to systematically predict a minimal media composition capable of supporting growth of S. aureus. A literature search revealed experimental growth requirements[3,34,35] for S. aureus and they are compared with the computational predictions (Table 2). These requirements are for growth with oxygen, nitrate, or nitrite as a terminal electron acceptor. Computationally, we predict that S. aureus can grow with a variety of carbon sources, and Table 2 presents a glucose minimal medium because the available experimental data assumes that glucose is the carbon source. This table should be considered as a prediction of the growth requirements of S. aureus derived from its GENRE. Although some of the components in the medium seem obvious, like phosphate and a carbon source, they still serve as validation for the GEM. If we were to computationally predict that growth was possible in the absence of a carbon source, it would quickly become apparent that something was amiss with the GEM. An agreement between the computationally-predicted and the experimentally-determined requirements indicates areas where simple model predictions are consistent with existing experimental data.
Table 2.
Computational and experimental minimal media
| Computational | Experimental | |
| proline OR arginine OR glutamate OR alanine OR | alanine | amino acids |
| aspartate OR glycine OR ornithine OR serine OR | glycine | |
| threonine | isoleucine | |
| arginine | ||
| valine | ||
| proline | ||
| cytidine OR cytosine OR uridine OR uracil | nucleotides | |
| phosphate | phosphate | cofactors, ions, etc. |
| sulfate | sulfate | |
| nicotinamide OR nicotinate | nicotinamide OR nicotinate | |
| iron | iron? (disagreement in literature) | |
| oxygen OR ((nitrate OR nitrite) AND protoheme) | oxygen assumed | |
| thiamin | thiamin | |
| biotin | ||
| calcium pantothenate | ||
| ammonium | ||
| glucose | glucose | carbon source |
The computed and experimentally determined minimal media for growth of S. aureus compare reasonably well. The most noticeable difference is the amino acid requirement, which can be attributed to regulation, as detailed in the text. The boolean statements (AND/OR) are standard; for example, there are three terminal electron acceptors that can be members of the computational minimal medium, o2, no3, and no2, but both no3 and no2 also require the presence of pheme. The absence of an explicit logic statement between lines is equivalent to using AND; for example, all 6 amino acids listed are required together in the experimental minimal medium.
The primary difference between the computationally predicted growth requirements and those from experimental data is the amino acid requirement. Kuroda et. al[3] report that the six amino acids listed in Table 2 are specifically required for strain N315 to grow and speculate that, since the strain has pathways for the synthesis of all amino acids, regulation might require the presence of these amino acids. iSB619 does not account for regulatory effects and as such predicts media requirements as if regulatory processes allow any gene to be expressed at the needed levels. The transcriptional regulatory network reduces the functionality of a constraint-based metabolic model by limiting which reactions are active at a given time[36]. If enzymes required for the synthesis of a given amino acid are encoded in the genome, but are not sufficiently transcribed or translated due to regulatory processes, the cell will require that amino acid as a component of the medium even though a purely metabolic model indicates otherwise.
We experimentally predict growth if any one of the nine amino acids or derivatives listed in the table is provided. Each of these compounds can either provide nitrogen through a deamination reaction or be directly converted into another compound that can provide nitrogen. S. aureus is said to require an organic source of nitrogen provided by amino acids[37], so the requirement of at least one amino acid is not surprising. It should be noted that the data from Kuroda et al[3] listing six essential amino acids is "unpublished data" and thus this information should be viewed with some skepticism. Furthermore, S. aureus has shown the ability to grow without amino acids previously thought to be required[37]; thus the amino acid requirement appears to be flexible. The differences in computationally-predicted and experimentally-determined essential amino acids highlight an area that has been historically under considered.
To explore the discrepancy between experimental results and computational predictions, we elected to study in silico the effect of adding each amino acid individually to the predicted minimal media listed (with arginine present at all times). The individual results are shown in Figure 1. We found that, on average, providing one of amino acids noted as essential from experimental data led to more biomass production than providing one amino acid not listed as essential. Using a Wilcoxon rank sum test with Matlab (The MathWorks, Inc., Natick, MA), these results are only 5.6% likely to be the result of random chance. The relative biomass production that we predict should be taken as a hypothesis that can be tested experimentally. It is not unreasonable that a pathogen would have developed regulation that leads it to require the uptake of amino acids that significantly aid its growth, especially when they are readily available in its typical environment. In essence, we predict that S. aureus can grow more efficiently by uptaking certain amino acids rather than synthesizing them, even though its genome encodes that functionality. Although one might intuitively think that this would be the case for all amino acids, the results in Figure 1 indicate that the synthesis of some amino acids is not predicted to substantially inhibit growth under the conditions studied (cys, his, met, phe, trp, tyr).
Figure 1.
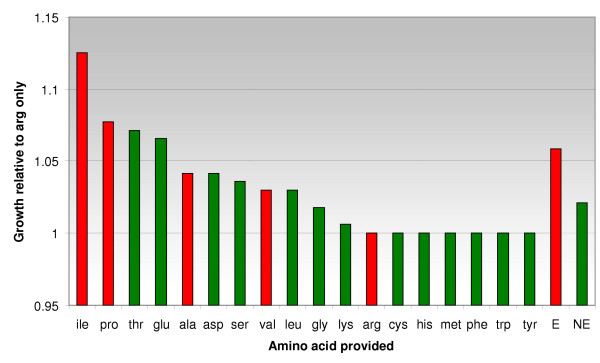
Amino acid contributions to growth. The results of adding equivalent quantities of each amino acid to the media are shown here. Red bars represent amino acids that are reported essential in the literature, and green bars are amino acids that are not. Arginine is present in all cases and is the baseline against which the rest of the values are normalized. On average, adding an essential amino acid to the media allows better growth than does adding a non-essential amino acid. E stands for average essential amino acid, and NE stands for average non-essential amino acid. Two amino acids do not have transporters in the genome annotation and are not included here for that reason.
Deletion Study
In order to determine the effects of the deletion of a reaction from the network, as would occur in a gene knock-out experiment, FBA is used with the additional constraint that the flux through a particular reaction is zero. This allows for the rapid prediction of the results of gene deletions and also reaction deletions, as occur when a selective enzyme inhibitor is used. We calculated the effects of all single reaction and gene deletions both on minimal medium and on a rich media (consisting of all amino acids, nucleotides, and protoheme). We found that, on rich media, 130 reaction deletions and 88 gene deletions are computationally predicted to be lethal. On minimal media, 230 reaction deletions and 168 gene deletions are predicted to be lethal. These predictions are detailed in the supplemental material [see Additional file 4 and Additional file 7]. There are fewer lethal gene deletions than reaction deletions because some essential reactions are not associated with genes, some essential reactions are associated with isozymes, and some genes catalyze multiple reactions. When analyzed in the context of GPR associations, we found that 20 (9%) of the reactions that are essential on minimal media are associated with isozymes. This calculation indicates that gene dispensability is explained by the presence of isozymes less often than in S. cerevisiae (14.6%-27.8%) [20]. We note that the distinction between isozymes that independently catalyze a reaction and multiple gene products required simultaneously for a reaction is not always clear from the data sources used in this reconstruction.
We took the results of the reaction deletion study on rich media and searched PubMed for chemical inhibitors of each of those reactions (Table 3). Most of the inhibitors listed do not have any published information regarding their effectiveness in S. aureus to the best of our knowledge. These computational predictions can be experimentally tested with targeted gene deletions or the inhibitors listed. Due to the diversity of biological systems in which the inhibitors were initially discovered, gene deletions would be expected to agree with our predictions more than the use of chemical inhibitors. There are a variety of reasons why any one of these inhibitors listed may have no utility whatsoever as a drug. For example, there may be no way for the inhibitor to actually enter a cell. Nevertheless, when considered as an initial guess at potential drugs, Table 3 represents hypotheses formed by a systems-level approach that has not been applied to an organism as clinically troublesome as S. aureus before.
Table 3.
Essential enzymes and potential chemical inhibitors
| Enzyme name | Potential Inhibitor | Prior testing? | Reference |
| acetyl-CoA carboxylase | pseudopeptide pyrrolidine dione antibiotics | SA, B | [45] |
| 4-amino-4-deoxychorismate synthase | (6s)-6-fluoroshikimate | B | [46] |
| Adenosylmethionine decarboxylase | CGP 40215A, AdoMao | B | [47,48] |
| asparagine synthase (glutamine-hydrolysing) | mucochloric and mucobromic acids, L-cysteine sulfinic acid | B | [49,50] |
| dihydrofolate reductase | methylpteridines | B | [51] |
| dihydropteroate synthase | Sulfone and sulfanilamide sulfa drugs | B | [52,53] |
| 3-dehydroquinate synthase | carbocyclic inhibitors | B | [54] |
| FMN adenylyltransferase (FAD synthase) | Riboflavin 5'-pyrophosphate | F | [55] |
| glycerol-3-phosphate dehydrogenase (NADP) | 5-n-alk(en)ylresorcinols | NF | [56] |
| glutamine synthetase | L-methionine sulfoximine, aminomethylene-bisphosphonic acid derivatives | NF | [57,58] |
| glutamyl-tRNA reductase | see table I in paper | NF | [59] |
| GTP cyclohydrolase I | Diamino-6-hydroxypyrimidine, pterins | NF | [60,61] |
| Hydroxymethylglutaryl CoA reductase (ir) | statins | NF | [62,63] |
| Hydroxymethylglutaryl CoA synthase (ir) | beta-lactone, 3-Hydroxy-3-methylglutaryldithio-coenzyme A | NF | [64,65] |
| isopentenyl-diphosphate D-isomerase | NE21650 | NF | [66] |
| methionine adenosyltransferase | adduncts 14 and 16 | B | [67] |
| Phosphatidate phosphatase | Propranolol | NF | [68] |
| phosphoribosylpyrophosphate synthetase | MRPP, ARPP | NF | [69] |
| riboflavin synthase | 9-D-ribitylamino-1,3,7,9-tetrahydro-2,6,8-purinetriones | B | [70] |
| spermidine synthase | adenosylspermidine, dicyclohexylamine | SA, B | [71,72] |
| thiamine transport via ABC system | azidobenzoyl derivatives of thiamin, methylene blue | F | [73,74] |
| thioredoxin reductase | Arsenicals, Aurothioglucose | NF | [75,76] |
| UDP-N-acetylglucosamine 4-epimerase | uridine analogs | NF | [77] |
| UDP-N-acetylenolpyruvoylglucosamine reductase | 4-thiazolidinones | B | [78] |
A reasonable number of enzymes that are computationally predicted to be essential for the growth of S. aureus have inhibitors. These molecules are potential drugs against this organism. The prior testing column uses abbreviations to indicate if we located evidence that the listed compounds had been tested in S. aureus (SA), other bacteria (B), fungi (F), or if no evidence was located (NF). The interested reader should consult the relevant references for full details regarding these potential inhibitors.
Additionally, we considered comparing the results of our gene deletion study with the results of an existing experimental approach to determine gene essentiality. Unfortunately, although we are aware of two large-scale studies on gene essentiality in S. aureus[38,39], there does not exist a comprehensive, publicly-available resource listing all essential genes in this organism. There is a comprehensive gene essentiality study for the related organism B. subtilis[40], but this is a different organism. Should comprehensive gene essentiality data become available for S. aureus, a comparison between experimental data and the predictions detailed herein can easily serve as validation for this model and identify problem areas. The absence of a comprehensive, publicly-available data set regarding gene essentiality in this organism is in itself powerful motivation to undertake the reconstruction detailed in this paper, as the reconstruction can rapidly predict essential metabolic genes that can later be screened experimentally as potential drug targets.
Growth Phenotypes
We computed the sensitivity of growth rate to oxygen uptake on a variety of different carbon sources (Figure 2). The carbon source uptake rate is restricted to the same molar maximum for all calculations. As expected, biomass production increases with oxygen uptake up to the point where there is no longer an oxygen limitation. In addition, the carbon sources which contain more carbon atoms also generally allow greater biomass production. For example, trehalose, which contains twice as much carbon as glucose, allows close to twice as much biomass production as an equivalent molar amount of glucose. The normalization used, explained in the figure caption, allows a quick analysis of the efficiency of the network in utilizing different carbon sources. Importantly, these predictions can be tested experimentally as a means of validating and improving the current GEM.
Figure 2.
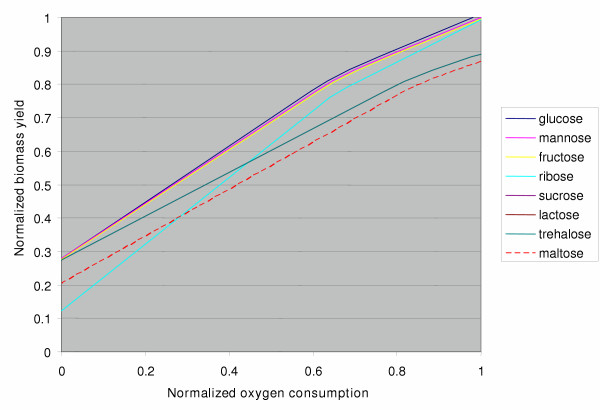
Relative growth efficiency with different carbon sources. The in silico growth of iSB619 varies depending on which carbon source is provided and the amount of oxygen present. The predicted efficiency of carbon incorporation into biomass is shown here as a function on the oxygen consumption. Growth rate is normalized relative to the number of carbon atoms per molecule. Oxygen consumption is normalized relative to optimal oxygen consumption for each carbon source. Trehalose, lactose, and sucrose all overlap (the trehalose line indicates all three). The legend is presented in the same order as the carbon sources appear in the figure, top to bottom.
Conclusion
The work reported is the first genome-scale metabolic reconstruction for the pathogenic bacterium S. aureus and represents the first draft to its two-dimensional genome annotation. The GENRE with the GPR associations represents a chemically and genetically structured database derived from the underlying data. When the properties of this GENRE are analyzed using FBA, the model computationally predicts phenotypic states. Based on the surprising paucity of physiological growth data available for this organism, especially under carefully defined conditions, the predictions made by the GEM are best viewed as hypotheses. These hypotheses can be experimentally tested, with similar results serving as validation for the GEM and dissimilar results describing failure modes of the GEM. These failure modes can be more interesting than correct predictions because they provide direction for improvement of the GEM and point to areas in metabolism and regulation that need further investigation. The analysis of failure modes and subsequent improvement of the GEM constitute a cycle of iterative model building[23,27], with the potential to significantly improve a GEM. Second generation models of E. coli and S. cerevisiae have made substantial improvements over initial genome-scale reconstructions. These enhancements include greater coverage of metabolism, explicit GPR associations, more detailed enzyme localization, and better enforcement of elemental and charge balancing. We expect that future enhancements to iSB619 will improve the accuracy of the reaction network and the GPR associations.
The scope of hypotheses that can be devised with a constraint-based metabolic model ranges from the relatively mundane, such as prediction of relative growth on different carbon sources, to the potentially groundbreaking, such as the determination of novel prospective drug targets. With an organism as harmful as S. aureus, any advancement of knowledge is welcome.
Methods
Reconstruction of the metabolic network
A genome annotation for S. aureus strain N315 was downloaded from the Comprehensive Microbial Resource (CMR) at The Institute for Genomic Research (TIGR) website[41] and used to form a gene index. Each key metabolic pathway present in map form on the Kyoto Encyclopedia of Genes and Genomes (KEGG) website[42] was then examined to extract reactions that genomic data suggest occur in this strain. These reactions were matched to proteins and genes based on the information provided by both TIGR and KEGG. After this pathway-by-pathway approach, the predicted functionality of each gene in the genome was examined manually, both in the TIGR annotation and on the KEGG website to find additional metabolic reactions that are not present in any KEGG map. Inconsistencies between TIGR and KEGG were handled on a case-by-case basis to determine what functionality should be assigned to a given gene. For example, in a case where one source (either TIGR or KEGG) indicated that the gene was a "conserved hypothetical protein" but the other source listed a specific metabolic function, the gene was generally given the specific function. If both sources gave conflicting functions, a reaction was included in the model if it was present in related organisms but was only associated with a gene that had conflicting annotations if another suitable gene without conflicting information could not be found.
After assembling the network based on genomic data, missing functions were noted based on physiological data regarding this organism, as well as B. subtilis and E. coli. Two books proved particularly helpful for this process[37,43]. Likely reactions were added to the model based on pathways present in related organisms. For example, some cell-wall components known to be in S. aureus could not be produced without the addition of reactions in various pathways present in B. subtilis. Membrane-bound transporters were added whenever evidence existed that a metabolite could enter and/or exit the cell. For example, if data indicated that a given carbon source could be used, a transporter was added to the reconstruction. Potential genes for some of these reactions were located by best-hit BLAST analysis against E. coli and B. subtilis. Each reaction without a gene association was checked against the genome annotations for E. coli and B. subtilis to determine if a gene exists in either organism for a given function. A homology search was used with any gene located in E. coli or B. subtilis against the entire S. aureus N315 genome. A reaction was putatively associated with a gene based on the E value provided by BLAST and the annotation information for that gene from both KEGG and TIGR. If a S. aureus gene did not have any functional information included in either annotation, a BLAST E value of 0.05 was considered sufficient to make an association. If functional information was present and differed from the specific reaction under consideration, a better E value would be necessary; the precise E value required was a judgment call and depended on the specificity of the annotation information. An association based on a relatively large E value should not be considered as a claim that a gene product catalyzes a reaction, but a suggestion as to a candidate gene [see Additional file 9]. Transporters were not associated with genes unless an annotation indicated with some degree of specificity that the gene had the given function. Whenever possible, the reactions in the network were balanced elementally and with respect to charge, where compound charge and molecular formula were based on a cellular pH of 7.2. The end result can be visualized as a stoichiometric matrix S with each column representing a reaction and each row a metabolite, with each element representing the stoichiometric coefficient. This reconstruction process, including accounting for GPR associations, and the subsequent analysis described below were done using the software program SimPheny™ (Genomatica Inc., San Diego, CA).
Biomass composition
Because no thorough biomass composition has been published for S. aureus, the relative production of metabolites required for growth was taken to be similar to that published for the related gram-positive organism B. subtilis[29]. The fatty acid composition of the lipids required for growth was, however, based on data specific to S. aureus[44]. Small amounts of a number of minor biomass constituents were added to the biomass function in equal amounts to account for their necessity in cellular growth. Further details are provided in the supplemental material [see Additional file 1].
Computation of phenotypic states and deletion study
With the reconstructed metabolic network and biomass function defined, flux-balance analysis (FBA) [31] was used to find optimal growth phenotypes. Briefly, linear programming was used to find a complete set of metabolic fluxes (v) that are consistent with all constraints, namely steady-state network operation (eq. 1 below) and reaction rate limitations (eq. 2 below), and which maximize the production of biomass components in the defined ratio. This corresponds to the following linear programming problem:
max Z = vgrowth
Subject to
S • v = 0 (1)
αi < vi < βi (2)
where S is the stoichiometric matrix described above, and αi and βi define the minimum and maximum allowable fluxes through each reaction vi. The flux range was set arbitrarily high for all internal reactions so that no internal reaction restricted the network, with the exception of reactions known to be irreversible, which have a minimum flux of zero. The inputs to the system were restricted where necessary (for example, limiting the amount of glucose available to the cell). The function vgrowth is a special reaction taking as substrates all biomass metabolites, ATP and water, and producing ADP, protons, and phosphate (as a result of the non-growth associated ATP maintenance requirement). SimPheny™ (Genomatica Inc, San Diego) was used for all FBA calculations.
The value of Z computed with the above procedure can either be zero or greater than zero depending on the inputs and outputs that are allowed, corresponding to the nutrients provided in the media. A zero value is a computational prediction of no growth; this commonly occurs when an essential nutrient like a carbon source is not provided. Any value greater than zero corresponds to cellular growth.
For the deletion study, each reaction was individually constrained to have zero flux and maximal biomass production was computed. Reactions were considered essential if no biomass could be produced without their usage. Gene deletions were computed in a similar manner, but all reactions requiring the presence of a given gene were simultaneously restricted to zero flux prior to computing maximal biomass production.
Minimal media
The minimal media was determined computationally with the systematic testing of distinct inputs. In short, different combinations of molecules were allowed to enter the reaction network until the minimal group that allowed biomass production, or non-zero Z, was found. Importantly, the minimal media computed here does not discriminate between extremely slow, inefficient growth and rapid growth; it is only concerned that some amount of biomass production is calculated.
List of abbreviations
CMR: Comprehensive Microbial Resource
EC: Enzyme Commission
FBA: flux-balance analysis
GEM: genome-scale model
GENRE: genome-scale reconstruction
GPR: gene-protein-reaction
KEGG: Kyoto Encyclopedia of Genes and Genomes
LP: linear programming
TIGR: The Institute for Genomic Research
Authors' contributions
SAB carried out all aspects of the work and drafted the manuscript. BOP conceived of the study, participated in its design and coordination, and helped draft the manuscript. All authors read and approved the final manuscript.
Supplementary Material
Cellular biomass demand table This is a detailed, quantitative listing of the macromolecules required for cellular growth.
Compound abbreviations This is a listing of the compound abbreviations used in the reconstruction and the corresponding formal compound names.
Dead-end reactions This is a listing of the reactions that the current version of the model will never use because they involve a dead-end metabolite.
Lethal reaction deletions on minimal media This is a listing of all of the reactions that are predicted to be essential for growth on minimal media and their corresponding gene associations.
Network reaction list This is a comprehensive list of all of the reactions that are in the model.
Reactions without any gene association This is a list of the reactions that are included in the model without any gene association and rationale for their inclusion.
Lethal reaction deletions on rich media This is a listing of all of the reactions that are predicted to be essential for growth on rich media and their corresponding gene associations.
Boolean gene-reaction associations This is a listing of reaction abbreviations along with the genes that are required for those reactions, in a Boolean form.
Reactions that were added based on systemic evidence This is a list of the reactions that were added to the reconstruction based on systemic analysis (they do not appear in an obvious fashion in the genome annotation), and the gene(s) with which they are associated in cases where a gene could be located based on homology searches.
Acknowledgments
Acknowledgements
We thank Jake Feala for his assistance reconstructing various metabolic pathways. We thank Natalie Duarte, Jennifer Reed, and Thuy Vo for discussions ranging from reconstruction methodology to software advice. We thank Sharon Wiback for her kind help with SimPheny™. We thank several anonymous reviewers for critical feedback that has substantially improved this manuscript. BOP is on the Scientific Advisory Board of Genomatica.
Contributor Information
Scott A Becker, Email: sabecker@ucsd.edu.
Bernhard Ø Palsson, Email: bpalsson@be-research.ucsd.edu.
References
- Enright MC. The evolution of a resistant pathogen--the case of MRSA. Curr Opin Pharmacol. 2003;3:474–479. doi: 10.1016/S1471-4892(03)00109-7. [DOI] [PubMed] [Google Scholar]
- Somerville GA, Said-Salim B, Wickman JM, Raffel SJ, Kreiswirth BN, Musser JM. Correlation of acetate catabolism and growth yield in Staphylococcus aureus: implications for host-pathogen interactions. Infect Immun. 2003;71:4724–4732. doi: 10.1128/IAI.71.8.4724-4732.2003. [DOI] [PMC free article] [PubMed] [Google Scholar]
- Kuroda M, Ohta T, Uchiyama I, Baba T, Yuzawa H, Kobayashi I, Cui L, Oguchi A, Aoki K, Nagai Y, Lian J, Ito T, Kanamori M, Matsumaru H, Maruyama A, Murakami H, Hosoyama A, Mizutani-Ui Y, Takahashi NK, Sawano T, Inoue R, Kaito C, Sekimizu K, Hirakawa H, Kuhara S, Goto S, Yabuzaki J, Kanehisa M, Yamashita A, Oshima K, Furuya K, Yoshino C, Shiba T, Hattori M, Ogasawara N, Hayashi H, Hiramatsu K. Whole genome sequencing of meticillin-resistant Staphylococcus aureus. Lancet. 2001;357:1225–1240. doi: 10.1016/S0140-6736(00)04403-2. [DOI] [PubMed] [Google Scholar]
- Covert MW, Schilling CH, Famili I, Edwards JS, Goryanin II, Selkov E, Palsson BO. Metabolic modeling of microbial strains in silico. Trends Biochem Sci. 2001;26:179–186. doi: 10.1016/S0968-0004(00)01754-0. [DOI] [PubMed] [Google Scholar]
- Price ND, Papin JA, Schilling CH, Palsson BO. Genome-scale microbial in silico models: the constraints-based approach. Trends Biotechnol. 2003;21:162–169. doi: 10.1016/S0167-7799(03)00030-1. [DOI] [PubMed] [Google Scholar]
- Palsson B. Two-dimensional annotation of genomes. Nat Biotech. 2004;22:1218–1219. doi: 10.1038/nbt1004-1218. [DOI] [PubMed] [Google Scholar]
- Price ND, Reed JL, Palsson BO. Genome-scale models of microbial cells: evaluating the consequences of constraints. Nat Rev Microbiol. 2004;2:886–897. doi: 10.1038/nrmicro1023. [DOI] [PubMed] [Google Scholar]
- Ibarra RU, Edwards JS, Palsson BO. Escherichia coli K-12 undergoes adaptive evolution to achieve in silico predicted optimal growth. Nature. 2002;420:186–189. doi: 10.1038/nature01149. [DOI] [PubMed] [Google Scholar]
- Varma A, Palsson BO. Stoichiometric flux balance models quantitatively predict growth and metabolic by-product secretion in wild-type Escherichia coli W3110. Appl Environ Microbiol. 1994;60:3724–3731. doi: 10.1128/aem.60.10.3724-3731.1994. [DOI] [PMC free article] [PubMed] [Google Scholar]
- Edwards JS, Ibarra RU, Palsson BO. In silico predictions of Escherichia coli metabolic capabilities are consistent with experimental data. Nat Biotechnol. 2001;19:125–130. doi: 10.1038/84379. [DOI] [PubMed] [Google Scholar]
- Duarte NC, Palsson BO, Fu P. Integrated analysis of metabolic phenotypes in Saccharomyces cerevisiae. BMC Genomics. 2004;5:63. doi: 10.1186/1471-2164-5-63. [DOI] [PMC free article] [PubMed] [Google Scholar]
- Reed JL, Palsson BO. Thirteen years of building constraint-based in silico models of Escherichia coli. J Bacteriol. 2003;185:2692–2699. doi: 10.1128/JB.185.9.2692-2699.2003. [DOI] [PMC free article] [PubMed] [Google Scholar]
- Forster J, Famili I, Fu P, Palsson BO, Nielsen J. Genome-scale reconstruction of the Saccharomyces cerevisiae metabolic network. Genome Res. 2003;13:244–253. doi: 10.1101/gr.234503. [DOI] [PMC free article] [PubMed] [Google Scholar]
- Duarte NC, Herrgard MJ, Palsson BO. Reconstruction and validation of Saccharomyces cerevisiae iND750, a fully compartmentalized genome-scale metabolic model. Genome Res. 2004;14:1298–1309. doi: 10.1101/gr.2250904. [DOI] [PMC free article] [PubMed] [Google Scholar]
- Van Dien SJ, Lidstrom ME. Stoichiometric model for evaluating the metabolic capabilities of the facultative methylotroph Methylobacterium extorquens AM1, with application to reconstruction of C(3) and C(4) metabolism. Biotechnol Bioeng. 2002;78:296–312. doi: 10.1002/bit.10200. [DOI] [PubMed] [Google Scholar]
- Hong SH, Kim JS, Lee SY, In YH, Choi SS, Rih JK, Kim CH, Jeong H, Hur CG, Kim JJ. The genome sequence of the capnophilic rumen bacterium Mannheimia succiniciproducens. Nat Biotechnol. 2004;22:1275–1281. doi: 10.1038/nbt1010. [DOI] [PubMed] [Google Scholar]
- Schilling CH, Covert MW, Famili I, Church GM, Edwards JS, Palsson BO. Genome-scale metabolic model of Helicobacter pylori 26695. J Bacteriol. 2002;184:4582–4593. doi: 10.1128/JB.184.16.4582-4593.2002. [DOI] [PMC free article] [PubMed] [Google Scholar]
- Schilling CH, Palsson BO. Assessment of the metabolic capabilities of Haemophilus influenzae Rd through a genome-scale pathway analysis. J Theor Biol. 2000;203:249–283. doi: 10.1006/jtbi.2000.1088. [DOI] [PubMed] [Google Scholar]
- Vo TD, Greenberg HJ, Palsson BO. Reconstruction and functional characterization of the human mitochondrial metabolic network based on proteomic and biochemical data. J Biol Chem. 2004;279:39532–39540. doi: 10.1074/jbc.M403782200. [DOI] [PubMed] [Google Scholar]
- Papp B, Pal C, Hurst LD. Metabolic network analysis of the causes and evolution of enzyme dispensability in yeast. Nature. 2004;429:661–664. doi: 10.1038/nature02636. [DOI] [PubMed] [Google Scholar]
- Segre D, Vitkup D, Church GM. Analysis of optimality in natural and perturbed metabolic networks. Proc Natl Acad Sci U S A. 2002;99:15112–15117. doi: 10.1073/pnas.232349399. [DOI] [PMC free article] [PubMed] [Google Scholar]
- Almaas E, Kovacs B, Vicsek T, Oltvai ZN, Barabasi AL. Global organization of metabolic fluxes in the bacterium Escherichia coli. Nature. 2004;427:839–843. doi: 10.1038/nature02289. [DOI] [PubMed] [Google Scholar]
- Covert MW, Knight EM, Reed JL, Herrgard MJ, Palsson BO. Integrating high-throughput and computational data elucidates bacterial networks. Nature. 2004;429:92–96. doi: 10.1038/nature02456. [DOI] [PubMed] [Google Scholar]
- Burgard AP, Pharkya P, Maranas CD. Optknock: a bilevel programming framework for identifying gene knockout strategies for microbial strain optimization. Biotechnol Bioeng. 2003;84:647–657. doi: 10.1002/bit.10803. [DOI] [PubMed] [Google Scholar]
- Reed JL, Vo TD, Schilling CH, Palsson BO. An expanded genome-scale model of Escherichia coli K-12 (iJR904 GSM/GPR) Genome Biol. 2003;4:R54. doi: 10.1186/gb-2003-4-9-r54. [DOI] [PMC free article] [PubMed] [Google Scholar]
- Fong SS, Marciniak JY, Palsson BO. Description and interpretation of adaptive evolution of Escherichia coli K-12 MG1655 by using a genome-scale in silico metabolic model. J Bacteriol. 2003;185:6400–6408. doi: 10.1128/JB.185.21.6400-6408.2003. [DOI] [PMC free article] [PubMed] [Google Scholar]
- Ideker T, Thorsson V, Ranish JA, Christmas R, Buhler J, Eng JK, Bumgarner R, Goodlett DR, Aebersold R, Hood L. Integrated genomic and proteomic analyses of a systematically perturbed metabolic network. Science. 2001;292:929–934. doi: 10.1126/science.292.5518.929. [DOI] [PubMed] [Google Scholar]
- Edwards JS, Palsson BO. The Escherichia coli MG1655 in silico metabolic genotype: its definition, characteristics, and capabilities. Proc Natl Acad Sci U S A. 2000;97:5528–5533. doi: 10.1073/pnas.97.10.5528. [DOI] [PMC free article] [PubMed] [Google Scholar]
- Dauner M, Sauer U. Stoichiometric growth model for riboflavin-producing Bacillus subtilis. Biotechnol Bioeng. 2001;76:132–143. doi: 10.1002/bit.1153. [DOI] [PubMed] [Google Scholar]
- Varma A, Palsson BO. Parametric Sensitivity of Stoichiometric Flux Balance Models Applied to Wild-Type Escherichia-Coli Metabolism. Biotechnology and Bioengineering. 1995;45:69–79. doi: 10.1002/bit.260450110. [DOI] [PubMed] [Google Scholar]
- Edwards JS, Covert M, Palsson B. Metabolic modelling of microbes: the flux-balance approach. Environ Microbiol. 2002;4:133–140. doi: 10.1046/j.1462-2920.2002.00282.x. [DOI] [PubMed] [Google Scholar]
- Bonarius HPJ, Schmid G, Tramper J. Flux analysis of underdetermined metabolic networks: The quest for the missing constraints. Trends in Biotechnology. 1997;15:308–314. doi: 10.1016/S0167-7799(97)01067-6. [DOI] [Google Scholar]
- Varma A, Palsson BO. Metabolic Flux Balancing - Basic Concepts, Scientific and Practical Use. Bio-Technology. 1994;12:994–998. [Google Scholar]
- Onoue Y, Mori M. Amino acid requirements for the growth and enterotoxin production by Staphylococcus aureus in chemically defined media. Int J Food Microbiol. 1997;36:77–82. doi: 10.1016/S0168-1605(97)01250-6. [DOI] [PubMed] [Google Scholar]
- Rudin L, Sjostrom JE, Lindberg M, Philipson L. Factors affecting competence for transformation in Staphylococcus aureus. J Bacteriol. 1974;118:155–164. doi: 10.1128/jb.118.1.155-164.1974. [DOI] [PMC free article] [PubMed] [Google Scholar]
- Covert MW, Palsson BO. Transcriptional regulation in constraints-based metabolic models of Escherichia coli. J Biol Chem. 2002;277:28058–28064. doi: 10.1074/jbc.M201691200. [DOI] [PubMed] [Google Scholar]
- Crossley KB, Archer G. The staphylococci in human disease. New York, Churchill Livingstone; 1997. p. xvi, 682 p., [2] p. plates. [Google Scholar]
- Ji Y, Zhang B, Van SF, Horn. Warren P, Woodnutt G, Burnham MK, Rosenberg M. Identification of critical staphylococcal genes using conditional phenotypes generated by antisense RNA. Science. 2001;293:2266–2269. doi: 10.1126/science.1063566. [DOI] [PubMed] [Google Scholar]
- Forsyth RA, Haselbeck RJ, Ohlsen KL, Yamamoto RT, Xu H, Trawick JD, Wall D, Wang L, Brown-Driver V, Froelich JM, C KG, King P, McCarthy M, Malone C, Misiner B, Robbins D, Tan Z, Zhu Zy ZY, Carr G, Mosca DA, Zamudio C, Foulkes JG, Zyskind JW. A genome-wide strategy for the identification of essential genes in Staphylococcus aureus. Mol Microbiol. 2002;43:1387–1400. doi: 10.1046/j.1365-2958.2002.02832.x. [DOI] [PubMed] [Google Scholar]
- Kobayashi K, Ehrlich SD, Albertini A, Amati G, Andersen KK, Arnaud M, Asai K, Ashikaga S, Aymerich S, Bessieres P, Boland F, Brignell SC, Bron S, Bunai K, Chapuis J, Christiansen LC, Danchin A, Debarbouille M, Dervyn E, Deuerling E, Devine K, Devine SK, Dreesen O, Errington J, Fillinger S, Foster SJ, Fujita Y, Galizzi A, Gardan R, Eschevins C, Fukushima T, Haga K, Harwood CR, Hecker M, Hosoya D, Hullo MF, Kakeshita H, Karamata D, Kasahara Y, Kawamura F, Koga K, Koski P, Kuwana R, Imamura D, Ishimaru M, Ishikawa S, Ishio I, Le Coq D, Masson A, Mauel C, Meima R, Mellado RP, Moir A, Moriya S, Nagakawa E, Nanamiya H, Nakai S, Nygaard P, Ogura M, Ohanan T, O'Reilly M, O'Rourke M, Pragai Z, Pooley HM, Rapoport G, Rawlins JP, Rivas LA, Rivolta C, Sadaie A, Sadaie Y, Sarvas M, Sato T, Saxild HH, Scanlan E, Schumann W, Seegers JF, Sekiguchi J, Sekowska A, Seror SJ, Simon M, Stragier P, Studer R, Takamatsu H, Tanaka T, Takeuchi M, Thomaides HB, Vagner V, van Dijl JM, Watabe K, Wipat A, Yamamoto H, Yamamoto M, Yamamoto Y, Yamane K, Yata K, Yoshida K, Yoshikawa H, Zuber U, Ogasawara N. Essential Bacillus subtilis genes. Proc Natl Acad Sci U S A. 2003;100:4678–4683. doi: 10.1073/pnas.0730515100. [DOI] [PMC free article] [PubMed] [Google Scholar]
- Peterson JD, Umayam LA, Dickinson T, Hickey EK, White O. The Comprehensive Microbial Resource. Nucleic Acids Res. 2001;29:123–125. doi: 10.1093/nar/29.1.123. [DOI] [PMC free article] [PubMed] [Google Scholar]
- Kanehisa M, Goto S, Kawashima S, Nakaya A. The KEGG databases at GenomeNet. Nucleic Acids Res. 2002;30:42–46. doi: 10.1093/nar/30.1.42. [DOI] [PMC free article] [PubMed] [Google Scholar]
- Sonenshein AL, Hoch JA, Losick R. Bacillus subtilis and its closest relatives : from genes to cells. Washington, D.C., ASM Press; 2002. p. xvi, 629 p.. [Google Scholar]
- Theodore TS, Panos C. Protein and fatty acid composition of mesosomal vesicles and plasma membranes of Staphylococcus aureus. J Bacteriol. 1973;116:571–576. doi: 10.1128/jb.116.2.571-576.1973. [DOI] [PMC free article] [PubMed] [Google Scholar]
- Freiberg C, Brunner NA, Schiffer G, Lampe T, Pohlmann J, Brands M, Raabe M, Habich D, Ziegelbauer K. Identification and characterization of the first class of potent bacterial acetyl-CoA carboxylase inhibitors with antibacterial activity. J Biol Chem. 2004;279:26066–26073. doi: 10.1074/jbc.M402989200. [DOI] [PubMed] [Google Scholar]
- Bulloch EM, Jones MA, Parker EJ, Osborne AP, Stephens E, Davies GM, Coggins JR, Abell C. Identification of 4-amino-4-deoxychorismate synthase as the molecular target for the antimicrobial action of (6s)-6-fluoroshikimate. J Am Chem Soc. 2004;126:9912–9913. doi: 10.1021/ja048312f. [DOI] [PubMed] [Google Scholar]
- Mukhopadhyay R, Kapoor P, Madhubala R. Antileishmanial effect of a potent S-adenosylmethionine decarboxylase inhibitor: CGP 40215A. Pharmacol Res. 1996;33:67–70. doi: 10.1006/phrs.1996.0011. [DOI] [PubMed] [Google Scholar]
- Guo J, Wu YQ, Rattendi D, Bacchi CJ, Woster PM. S-(5'-deoxy-5'-adenosyl)-1-aminoxy-4-(methylsulfonio)-2-cyclopentene (AdoMao): an irreversible inhibitor of S-adenosylmethionine decarboxylase with potent in vitro antitrypanosomal activity. J Med Chem. 1995;38:1770–1777. doi: 10.1021/jm00010a021. [DOI] [PubMed] [Google Scholar]
- Cooney DA, Milman HA, Jayaram HN, Homan ER. Inhibition of L-asparagine synthetase by mucochloric and mucobromic acids. Enzyme. 1976;21:524–539. doi: 10.1159/000458905. [DOI] [PubMed] [Google Scholar]
- Boehlein SK, Nakatsu T, Hiratake J, Thirumoorthy R, Stewart JD, Richards NG, Schuster SM. Characterization of inhibitors acting at the synthetase site of Escherichia coli asparagine synthetase B. Biochemistry. 2001;40:11168–11175. doi: 10.1021/bi0155551. [DOI] [PubMed] [Google Scholar]
- Rosowsky A, Fu H, Chan DC, Queener SF. Synthesis of 2,4-diamino-6-[2'-O-(omega-carboxyalkyl)oxydibenz[b,f]azepin-5-yl]methylpt eridines as potent and selective inhibitors of Pneumocystis carinii, Toxoplasma gondii, and Mycobacterium avium dihydrofolate reductase. J Med Chem. 2004;47:2475–2485. doi: 10.1021/jm030599o. [DOI] [PubMed] [Google Scholar]
- Johnson T, Khan IA, Avery MA, Grant J, Meshnick SR. Quantitative structure-activity relationship studies of a series of sulfa drugs as inhibitors of Pneumocystis carinii dihydropteroate synthetase. Antimicrob Agents Chemother. 1998;42:1454–1458. doi: 10.1128/aac.42.6.1454. [DOI] [PMC free article] [PubMed] [Google Scholar]
- Grape M, Sundstrom L, Kronvall G. Sulphonamide resistance gene sul3 found in Escherichia coli isolates from human sources. J Antimicrob Chemother. 2003;52:1022–1024. doi: 10.1093/jac/dkg473. [DOI] [PubMed] [Google Scholar]
- Tian F, Montchamp JL, Frost JW. Inhibitor Ionization as a Determinant of Binding to 3-Dehydroquinate Synthase. J Org Chem. 1996;61:7373–7381. doi: 10.1021/jo960709h. [DOI] [PubMed] [Google Scholar]
- Hartman HA, Edmondson DE, McCormick DB. Riboflavin 5'-pyrophosphate: a contaminant of commercial FAD, a coenzyme for FAD-dependent oxidases, and an inhibitor of FAD synthetase. Anal Biochem. 1992;202:348–355. doi: 10.1016/0003-2697(92)90117-P. [DOI] [PubMed] [Google Scholar]
- Rejman J, Kozubek A. Inhibitory effect of natural phenolic lipids upon NAD-dependent dehydrogenases and on triglyceride accumulation in 3T3-L1 cells in culture. J Agric Food Chem. 2004;52:246–250. doi: 10.1021/jf034745a. [DOI] [PubMed] [Google Scholar]
- Winkler BS, Kapousta-Bruneau N, Arnold MJ, Green DG. Effects of inhibiting glutamine synthetase and blocking glutamate uptake on b-wave generation in the isolated rat retina. Vis Neurosci. 1999;16:345–353. doi: 10.1017/S095252389916214X. [DOI] [PMC free article] [PubMed] [Google Scholar]
- Obojska A, Berlicki L, Kafarski P, Lejczak B, Chicca M, Forlani G. Herbicidal pyridyl derivatives of aminomethylene-bisphosphonic acid inhibit plant glutamine synthetase. J Agric Food Chem. 2004;52:3337–3344. doi: 10.1021/jf049843q. [DOI] [PubMed] [Google Scholar]
- Loida PJ, Thompson RL, Walker DM, CaJacob CA. Novel inhibitors of glutamyl-tRNA(Glu) reductase identified through cell-based screening of the heme/chlorophyll biosynthetic pathway. Arch Biochem Biophys. 1999;372:230–237. doi: 10.1006/abbi.1999.1505. [DOI] [PubMed] [Google Scholar]
- He A, Rosazza JP. GTP cyclohydrolase I: purification, characterization, and effects of inhibition on nitric oxide synthase in nocardia species. Appl Environ Microbiol. 2003;69:7507–7513. doi: 10.1128/AEM.69.12.7507-7513.2003. [DOI] [PMC free article] [PubMed] [Google Scholar]
- Shen RS, Alam A, Zhang YX. Inhibition of GTP cyclohydrolase I by pterins. Biochim Biophys Acta. 1988;965:9–15. doi: 10.1016/0304-4165(88)90144-4. [DOI] [PubMed] [Google Scholar]
- Mason RP, Walter MF, Jacob RF. Effects of HMG-CoA reductase inhibitors on endothelial function: role of microdomains and oxidative stress. Circulation. 2004;109:II34–41. doi: 10.1161/01.CIR.0000129503.62747.03. [DOI] [PubMed] [Google Scholar]
- Miller TL, Wolin MJ. Inhibition of growth of methane-producing bacteria of the ruminant forestomach by hydroxymethylglutaryl-SCoA reductase inhibitors. J Dairy Sci. 2001;84:1445–1448. doi: 10.3168/jds.s0022-0302(01)70177-4. [DOI] [PubMed] [Google Scholar]
- Tomoda H, Ohbayashi N, Kumagai H, Hashizume H, Sunazuka T, Omura S. Differential inhibition of HMG-CoA synthase and pancreatic lipase by the specific chiral isomers of beta-lactone DU-6622. Biochem Biophys Res Commun. 1999;265:536–540. doi: 10.1006/bbrc.1999.1712. [DOI] [PubMed] [Google Scholar]
- Wrensford LV, Rodwell VW, Anderson VE. 3-Hydroxy-3-methylglutaryldithio-coenzyme A: a potent inhibitor of Pseudomonas mevalonii HMG-CoA reductase. Biochem Med Metab Biol. 1991;45:204–208. doi: 10.1016/0885-4505(91)90022-D. [DOI] [PubMed] [Google Scholar]
- Thompson K, Dunford JE, Ebetino FH, Rogers MJ. Identification of a bisphosphonate that inhibits isopentenyl diphosphate isomerase and farnesyl diphosphate synthase. Biochem Biophys Res Commun. 2002;290:869–873. doi: 10.1006/bbrc.2001.6289. [DOI] [PubMed] [Google Scholar]
- Kappler F, Vrudhula VM, Hampton A. Toward the synthesis of isozyme-specific enzyme inhibitors. Potent inhibitors of rat methionine adenosyltransferases. Effect of one-atom elongation of the ribose-P alpha bridge in two covalent adducts of L-methionine and beta,gamma-imido-ATP. J Med Chem. 1988;31:384–389. doi: 10.1021/jm00397a020. [DOI] [PubMed] [Google Scholar]
- Sozzani S, Agwu DE, McCall CE, O'Flaherty JT, Schmitt JD, Kent JD, McPhail LC. Propranolol, a phosphatidate phosphohydrolase inhibitor, also inhibits protein kinase C. J Biol Chem. 1992;267:20481–20488. [PubMed] [Google Scholar]
- Nord LD, Willis RC, Breen TS, Avery TL, Finch RA, Sanghvi YS, Revankar GR, Robins RK. Inhibition of phosphoribosylpyrophosphate synthetase by 4-methoxy-(MRPP) and 4-amino-8-(D-ribofuranosylamino) pyrimido[5,4-d]pyrimidine (ARPP) Biochem Pharmacol. 1989;38:3543–3549. doi: 10.1016/0006-2952(89)90126-3. [DOI] [PubMed] [Google Scholar]
- Cushman M, Sambaiah T, Jin G, Illarionov B, Fischer M, Bacher A. Design, synthesis, and evaluation of 9-D-ribitylamino-1,3,7,9-tetrahydro-2,6,8-purinetriones bearing alkyl phosphate and alpha,alpha-difluorophosphonate substituents as inhibitors of tiboflavin synthase and lumazine synthase. J Org Chem. 2004;69:601–612. doi: 10.1021/jo030278k. [DOI] [PubMed] [Google Scholar]
- Lakanen JR, Pegg AE, Coward JK. Synthesis and biochemical evaluation of adenosylspermidine, a nucleoside-polyamine adduct inhibitor of spermidine synthase. J Med Chem. 1995;38:2714–2727. doi: 10.1021/jm00014a023. [DOI] [PubMed] [Google Scholar]
- Mattila T, Honkanen-Buzalski T, Poso H. Reversible inhibition of bacterial growth after specific inhibition of spermidine synthase by dicyclohexylamine. Biochem J. 1984;223:823–830. doi: 10.1042/bj2230823. [DOI] [PMC free article] [PubMed] [Google Scholar]
- Sempuku K. Photoinactivation of the thiamin transport system in Saccharomyces cerevisiae with azidobenzoyl derivatives of thiamin. Biochim Biophys Acta. 1988;944:177–184. doi: 10.1016/0005-2736(88)90430-0. [DOI] [PubMed] [Google Scholar]
- Iwashima A, Nishimura H, Nishino H. Inhibition of thiamine transport in baker's yeast by methylene blue. Experientia. 1980;36:1153–1154. doi: 10.1007/BF01976094. [DOI] [PubMed] [Google Scholar]
- Lin S, Del Razo LM, Styblo M, Wang C, Cullen WR, Thomas DJ. Arsenicals inhibit thioredoxin reductase in cultured rat hepatocytes. Chem Res Toxicol. 2001;14:305–311. doi: 10.1021/tx0001878. [DOI] [PubMed] [Google Scholar]
- Smith AD, Guidry CA, Morris VC, Levander OA. Aurothioglucose inhibits murine thioredoxin reductase activity in vivo. J Nutr. 1999;129:194–198. doi: 10.1093/jn/129.1.194. [DOI] [PubMed] [Google Scholar]
- Winans KA, Bertozzi CR. An inhibitor of the human UDP-GlcNAc 4-epimerase identified from a uridine-based library: a strategy to inhibit O-linked glycosylation. Chem Biol. 2002;9:113–129. doi: 10.1016/S1074-5521(02)00093-5. [DOI] [PubMed] [Google Scholar]
- Andres CJ, Bronson JJ, D'Andrea SV, Deshpande MS, Falk PJ, Grant-Young KA, Harte WE, Ho HT, Misco PF, Robertson JG, Stock D, Sun Y, Walsh AW. 4-Thiazolidinones: novel inhibitors of the bacterial enzyme MurB. Bioorg Med Chem Lett. 2000;10:715–717. doi: 10.1016/S0960-894X(00)00073-1. [DOI] [PubMed] [Google Scholar]
Associated Data
This section collects any data citations, data availability statements, or supplementary materials included in this article.
Supplementary Materials
Cellular biomass demand table This is a detailed, quantitative listing of the macromolecules required for cellular growth.
Compound abbreviations This is a listing of the compound abbreviations used in the reconstruction and the corresponding formal compound names.
Dead-end reactions This is a listing of the reactions that the current version of the model will never use because they involve a dead-end metabolite.
Lethal reaction deletions on minimal media This is a listing of all of the reactions that are predicted to be essential for growth on minimal media and their corresponding gene associations.
Network reaction list This is a comprehensive list of all of the reactions that are in the model.
Reactions without any gene association This is a list of the reactions that are included in the model without any gene association and rationale for their inclusion.
Lethal reaction deletions on rich media This is a listing of all of the reactions that are predicted to be essential for growth on rich media and their corresponding gene associations.
Boolean gene-reaction associations This is a listing of reaction abbreviations along with the genes that are required for those reactions, in a Boolean form.
Reactions that were added based on systemic evidence This is a list of the reactions that were added to the reconstruction based on systemic analysis (they do not appear in an obvious fashion in the genome annotation), and the gene(s) with which they are associated in cases where a gene could be located based on homology searches.