Abstract
Objective:
This paper introduces the Adaptive Current Tomograph 5 (ACT5) Electrical Impedance Tomography (EIT) system. ACT5 is a 32 electrode applied-current multiple-source EIT system that can display real-time images of conductivity and susceptivity at 27 frames per second. The adaptive current sources in ACT5 can apply fully programmable current patterns with frequencies varying from 5 kHz to 500 kHz. The system also displays real-time ECG readings during the EIT imaging process.
Methods:
The hardware and software design and specifications are presented, including the current source design, FPGA hardware, safety features, calibration, and shunt impedance measurement.
Results:
Images of conductivity and susceptivity are presented from ACT5 data collected on tank phantoms and a human subject illustrating the system’s ability to provide real-time images of pulsatile perfusion and ECG traces.
Significance:
The portability, high signal-to-noise ratio, and flexibility of applied currents over a wide range of frequencies enable this instrument to be used to obtain useful human subject data with relative clinical ease.
Keywords: Biomedical Imaging, EIT, Electrical Impedance Tomography
I. Introduction
Electrical Impedance Tomography (EIT) is an imaging technique that produces images of the inner impedance network of an object using electrical measurements made on its surface. The measurements in EIT systems are usually made by injecting electrical currents into the object through electrodes and measuring the resulting voltages.
One of the main applications of EIT is in the medical domain where EIT is used in applications such as human-computer interfacing [1], cancer detection [2], [3], muscle health [4] and brain function monitoring [5]–[7]. Studying the thorax region, especially lung and heart function, has been one of the main focuses in EIT research [8], [9]. Due to the impedance differences among air, blood, and tissue [10], [11], EIT is particularly suitable for monitoring changes in air and blood flow in mechanically ventilated patients [12].
EIT differs from other medical imaging techniques in various aspects. EIT is less expensive than tools such as MRI or x-ray CT, can be used as a non-invasive bedside monitoring tool, and captures images at a high temporal resolution with 10s of images per second. Most importantly, EIT is a radiation-free imaging technique that poses no danger to patients and has no side-effects. On the other hand, EIT suffers from low spatial resolution due to a limited number of degrees of freedom and as an ill-posed inverse problem [13].
EIT systems can broadly be categorized as pair-drive and parallel-drive systems. In pair-drive systems, also known as single-source systems, current is applied through two electrodes and voltages are measured on the remainder of the electrodes. In parallel-drive systems, current is applied to and voltages are measured on all the electrodes simultaneously. Parallel-drive systems have more sources compared to the pair-drive systems and, as a result, they are generally more expensive and complex to build. Parallel-drive systems can be used as a pair drive system by sending zero current to all but a pair of electrodes at one time. In addition they enable the application of optimal or near-optimal current patterns that result in higher signal-to-noise ratio (SNR) in the data compared to pair-drive systems [14].
The majority of the EIT systems in use are pair-drive systems. Multiple commercial pair-drive systems such as Sentec LuMon [15], Dräger Pulmovista 500 [16], and Timpel Enlight 2100 [17], Gense [18], and Sciospec EIT16 and EIT32/64/128+ systems [19] are in use in addition to multiple other non-commercial pair-drive systems that have been developed by various academic labs. Some articles that cover these systems are found in [20]–[22]. Some of the previous parallel-drive EIT systems include OXBACT-3 [23], ACT3 [8], ACT4 [2], KHU Mark 2 [24], KHU Mark 2.5 [25], GE GENESIS [26], and systems developed in Dartmouth College [27]–[29]. There are other parallel-drive EIT systems that separate the voltage-measuring electrodes from the current-applying ones [30]–[33]. This separation comes at the cost of using fewer electrodes for measurement of voltage than possible.
The Adaptive Current Tomograph 5 System (ACT5), shown in Fig. 1, is designed to monitor the thoracic region, specifically ventilation and pulsatile perfusion. Additionally, ACT5 records electrocardiogram (ECG) signals on all electrodes in real time, providing synchronous EIT images and ECG waveforms. Both the amplitude and phase of each current source in ACT5 are individually controllable, and so the ACT5 system can apply any complex current pattern with current magnitudes within the range of its sources, providing the ability to apply optimal current patterns for a given target [34].
Fig. 1:
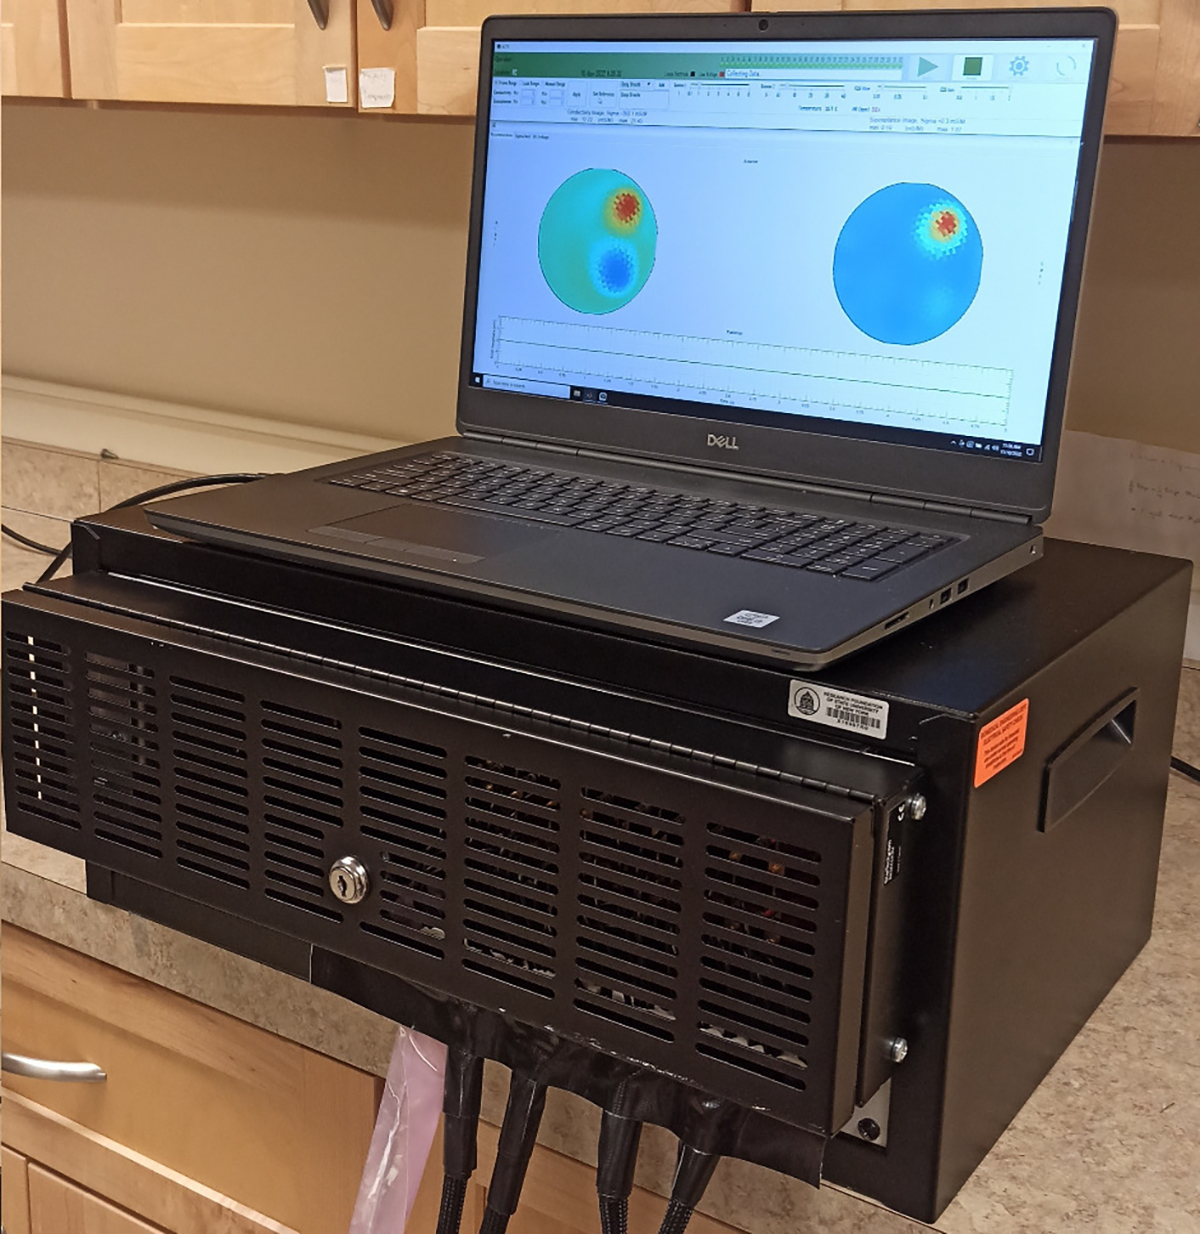
Hardware of the ACT5 EIT system.
The adaptive current sources of ACT5 use simplified analog circuitry that reduce the points of failure in the system and eliminate the need for circuits commonly found in EIT systems such as cable shield drivers and shunt impedance compensation circuits. High effective output impedance is attained without adjustments to the analog circuits. The ACT5 system can store calibration data for multiple operation frequencies and rapidly switch among these frequencies, making it possible to collect spectroscopy data. Having simplified circuitry that does not include programmable analog components such as digital potentiometers also serves to speed up the calibration process which is done autonomously.
ACT5 is designed as a portable device, currently fitted in a box of size 54 cm × 32 cm × 23 cm weighing 22.5 kg. The system interfaces with an external computer through a USB connection, hence it can be interfaced with a laptop, making it a stand-alone portable unit.
The structure of this paper is as follows. The ACT5 system and its specifications are introduced in Section II. Section III shows results obtained using ACT5 on saline tanks and a male human subject, including reconstructions of pulsatile perfusion with a simultaneous ECG trace obtained through the EIT electrodes. Section IV provides a brief summary.
II. The ACT5 System
This section introduces the ACT5 EIT system and its specifications. The hardware of the ACT5 EIT system is shown in Fig. 1. The PC (laptop) provides the graphical user interface (GUI) for controlling the data collection and displaying images and relevant information. ACT5 specifications are shown in Table I and a comparison with several other EIT systems is provided in Table II.
TABLE I:
ACT5 Specifications.
| Property | Values |
|---|---|
|
| |
| # of Active Electrodes | 16/32 |
| Default # of Active Electrodes | 32 |
| Max. Current (each electrode) | 1 mA peak-to-peak |
| Max. Voltage | 1V peak-to-peak |
| Voltage Measurement | Conductivity + Permitivity |
| SNR | >100dB |
| Frequency Range | 5 kHz to 500 kHz |
| Frame Rate (32 Electrodes) | 27 frames/sec |
| Frame Rate (16 Electrodes) | 54 frames/sec |
| Drive Pattern | Parallel - Complex Programmable |
| Shunt Impedance Compensation | Digital |
| Cable Length | Adjustable (Default: 2 m) |
| Electrode Connection | Grounded Shield Cable |
| ECG | Measured on all Electrodes |
| ECG Sampling Rate | 864 Hz |
TABLE II:
Comparison table of ACT5 and other EIT systems
| EIT System | ACT5 | GE [26] | ACT 3 [8] | PulmoVista [16] | LuMon [15] | Enlight [17] |
|---|---|---|---|---|---|---|
|
| ||||||
| # of Electrodes | 16 / 32 | 16 / 32 | 32 | 16 | 32 | 32 |
| Drive Pattern | Parallel | Parallel | Parallel | Pair | Pair | Pair |
| Frame Rate (frames/sec) | 54 / 27 | 52 / 20 | 18.5 | 10–50 | 50 | 50 |
| Signal Frequency (kHz) | 5–500 | 10 | 28 | 80–130 | 180–220 | 125 |
| SNR (dB) | >100 | 110 | 90 | - | - | 50–95 |
| Max. Current (rms) (1 electrode) (mA) | 0.35 | 0.11 | 0.5 | 9 | 0.7 – 3.7 | - |
The architecture of ACT5 is shown in Fig. 2. The system is modular consisting of a controller board, a calibration board, and multiple source boards, each containing four current sources and voltmeters. The controller board is connected to a PC through a serial connection. A GUI on the PC provides the high-level control to the user, including adjusting and setting various parameters and initiating the imaging process. The controller acts as a relay of information between the PC and the peripheral devices and also automates various tasks of ACT5 including the calibration, imaging, and certain debugging processes. The calibration board is used to calibrate all current sources and voltmeters with respect to a common standard. The calibration board and the source boards are connected to each other through an analog calibration bus. All the boards are mounted on a VME64 J1 backplane [35]. The VME backplane provides power lines (5 V for digital components, 12 V & −12 V for analog circuits, and Ground), master clock signal (24 MHz), control signals, and communication links between the controller and the peripheral boards for data transfer.
Fig. 2:
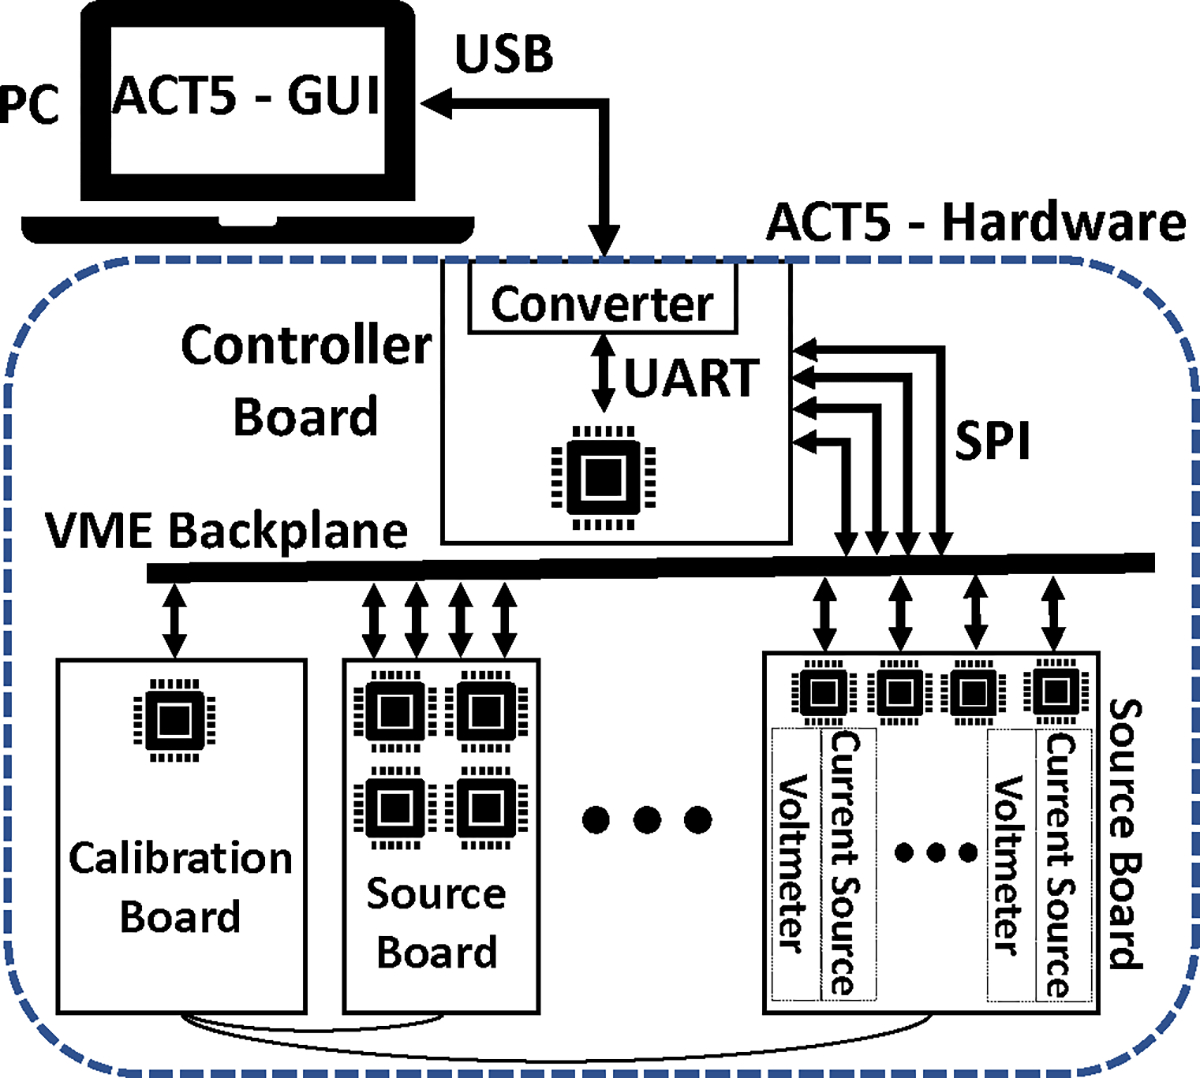
Overview of the hardware architecture of ACT5. The EIT system is controlled by a PC through a USB-UART connection.
A. FPGA Hardware
Digilent Cmod A7 modules are used as the computational unit for the channels, controller, and calibration channel. The Cmod A7 is a module built around a Xilinx Artix-7 XC7A35T FPGA. The module has 48 pins with 44 pins available as digital inputs and outputs. The FPGAs on the modules provide all the necessary computational capability for all boards.
B. Controller Board
The controller board is connected to the PC/laptop through a USB-UART converter (UM232H Module) where the USB side is plugged in to the PC and the UART side is connected to the controller FPGA. For safety, optical couplers (Toshiba TLP2366) provide complete electrical isolation between the USB-UART converter, and the connected laptop, and the ACT5 instrument hardware. The controller FPGA relays the information from the PC to peripheral devices during the setup phase of ACT5 and collects the data from the peripheral devices and returns them to the PC during the calibration and the imaging processes. The controller FPGA also automates the tasks and synchronizes the operation of ACT5. Additionally, the controller FPGA provides the 24 MHz master clock signal to the backplane that is shared to all peripheral devices. All system operations are synchronized to this clock signal.
C. Calibration Board
The calibration board includes a voltage source, a voltmeter, a current-to-voltage converter, a precision resistor (Vishay Z-Foil VFCP Series, ± 0.01%, ± 0.2ppm/ °C), and an FPGA. Multiple switches on the calibration board allow it to configure its circuit to calibrate different components of ACT5. The calibration circuit and calibration steps are described in detail in [36] and in Section II-G. Additionally, the temperature of the calibration FPGA is measured and recorded during the imaging process.
D. Channel Boards
Each channel board supports 4 channels, where each channel includes a current source, a voltmeter, and an FPGA. The block diagram of a channel is shown in Fig. 3.
Fig. 3:
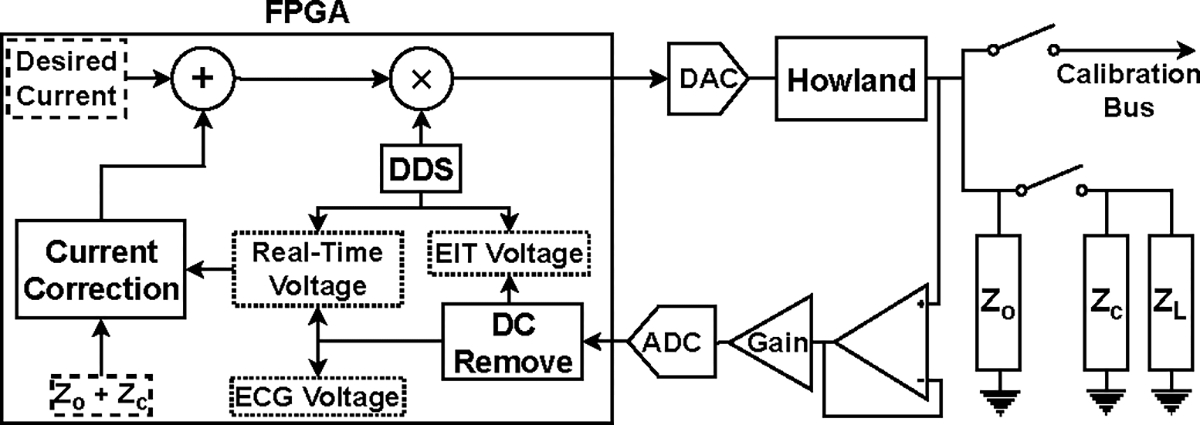
Block diagram of a channel in ACT 5.
Digital samples are converted using a 16-bit DAC (Linear Technology LTC1668) at 24 MS/s and fed to a standard Howland voltage-to-current converter [37] to produce the desired current. The voltmeter samples the signal using an 18-bit ADC (Analog Devices AD4002) at 1.2 MS/s and the samples are processed using quadrature matched filters to produce the complex measured voltages as shown in Fig. 4. The matched filters integrate over 1024 samples and excitation frequencies are chosen such that 1024 samples corresponds to an integral number of waveform cycles. Each channel can either connect to the load or the calibration bus through reed relays (Coto Technologies 9001) on the board. The FPGA is responsible for all the digital processes, including creating the digital waveform, measuring the voltage, and compensating the effects of shunt impedance. Additionally, the FPGA communicates with the controller through the VME backplane using SPI protocol communication links. All the channel boards in the system are identical with the only differentiating factor being a set of jumpers that assign a 4-bit address to each board.
Fig. 4:
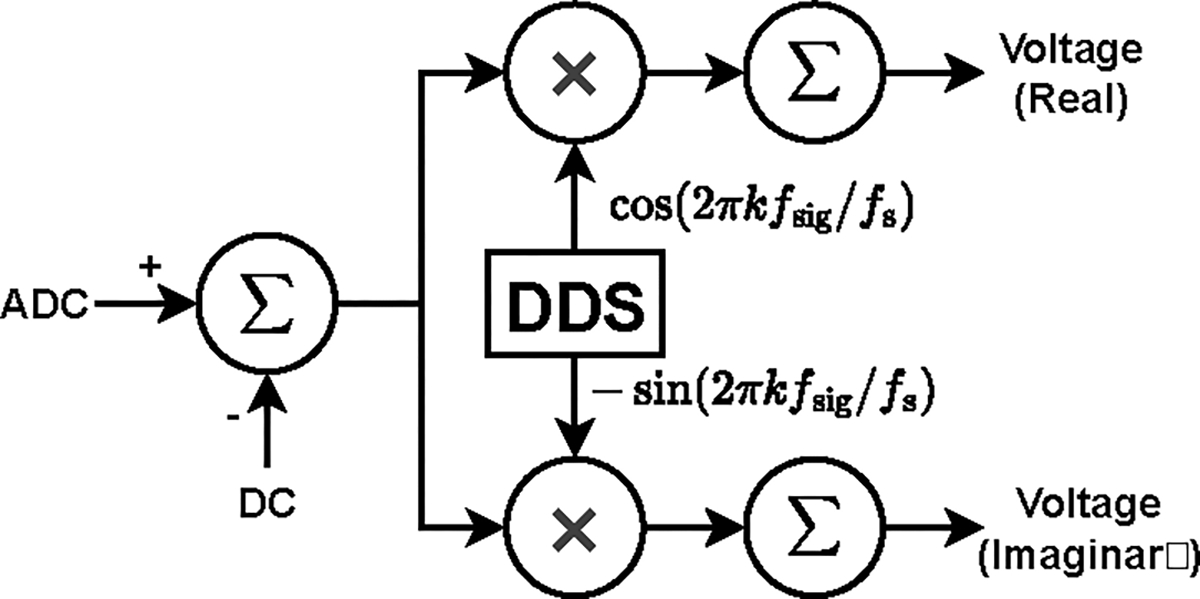
Matched filter structure, yielding the real and imaginary components of the voltage. In the figure, is the frequency of the applied signal and is the sampling frequency of the signal.
1). Adaptive Current Sources:
Current loss through shunt impedances, including the output impedance of the current sources, electrode cables, and other stray capacitance is a source of error in EIT systems [38]. Minimizing or compensating for this lost current is a vital step to ensure that the desired current is delivered to the load.
ACT5 uses adaptive current sources [36], [39] that compensate the current lost through the shunt impedance by outputting more current from the current sources. The adaptive current source, shown in Fig. 5, adjusts its output current based on the output voltage and the predetermined value of the shunt impedance so that the desired current is delivered to the load.
| (1) |
Fig. 5:
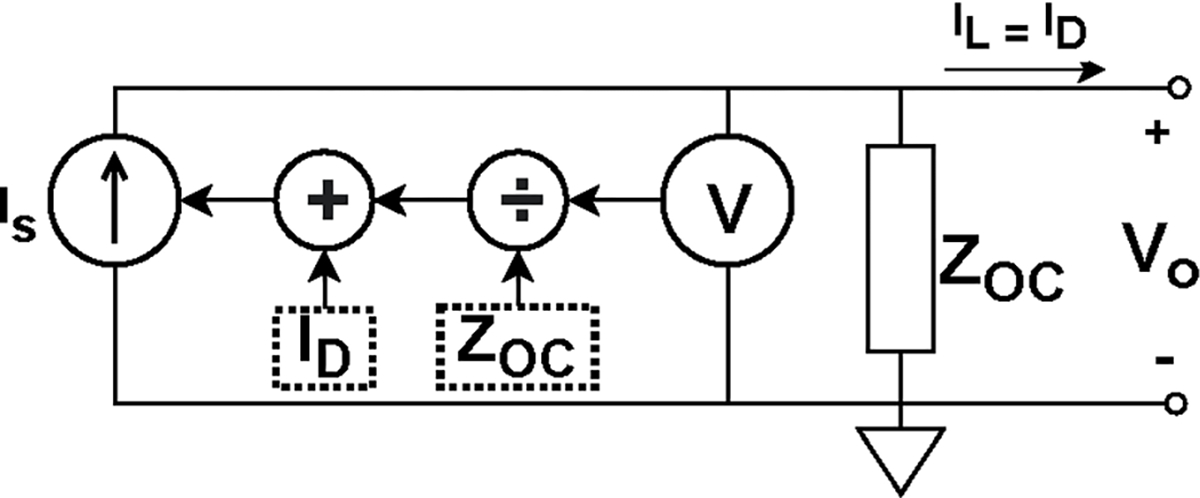
Overview of an adaptive current source used in ACT5. The current source compensates the lost current on the shunt impedance by outputting more current from the source so that the desired current is delivered to the load.
This architecture for the current sources eliminates the need for conventional analog current compensation circuits and enables ACT5 to compensate for cables to maintain a high effective shunt impedance. To compensate for lost current in real time, i.e. track changes in the load impedance, the voltage measurements used to adjust the current must be obtained in real time. Consequently, the voltages obtained through the matched filters, which integrate over the current burst, cannot be used. The real-time voltage measurement system is described in [36]. The adaptive current sources show similar performance when operating with grounded shields or driven shields [40].
2). ECG Measurement:
In parallel to the EIT signals, all the electrodes of ACT5 measure ECG signals [41]. The composite EIT and ECG signal is sampled on each channel and passed through an integrate-and-dump filter that operates over an integral number of cycles of the sinusoidal EIT excitation signal, effectively eliminating the EIT signal. The timing and duration of the integrate-and-dump filter is the same as that for the matched filters used to measure the electrode voltages. The output of the integrate-and-dump filter undergoes additional filtering before being displayed as the ECG signal.
E. User Interface
The GUI, shown in Fig. 6, displays the reconstructions of the real and imaginary parts of the admittivity distribution, i.e. the conductivity and susceptivity (, where is the angular frequency and is the electric permittivity), and a real-time ECG signal obtained by taking the difference between ECG signals from a pair of electrodes. This ECG signal is time-aligned with the reconstructed images. Both absolute and time-difference images can be displayed and the reference image in the time-difference case can be reset with the press of a button. The range for the conductivity and susceptivity display can be specified, locked, or allowed to vary in time. At the top of the interface, a dot is displayed for each electrode to indicate whether that electrode has good contact with the skin and is green when contact is good, and black when it is detached. One can also toggle to a screen that displays the voltages on electrodes when the same small current is applied to all electrodes, which is useful for assessing electrode contact, and to another screen that displays in real time the real and imaginary parts of , the best constant complex conductivity fit to the measured data. Other information such as the operator, time, and location are also displayed on the GUI. Other controls on the GUI include the stop, and reset buttons.
Fig. 6:
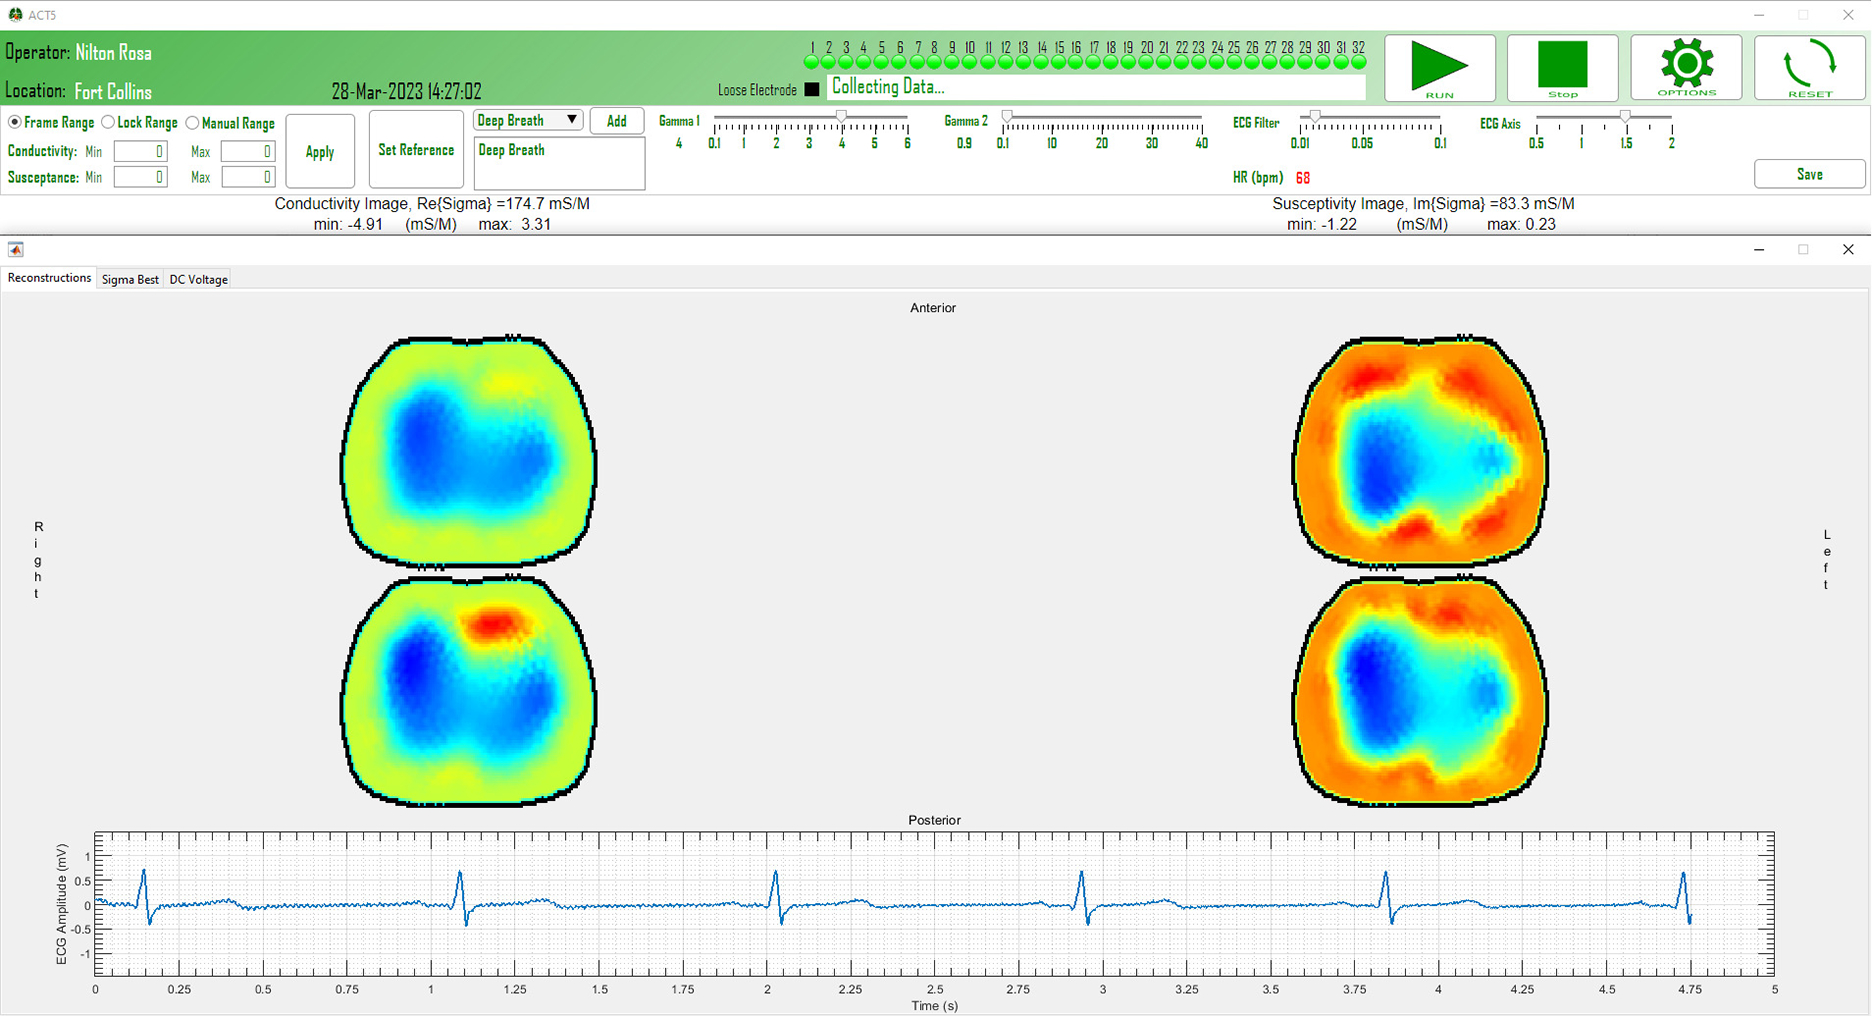
Snapshot of the ACT5 clinical interface during data collection.
The real-time reconstruction of 2D and 3D images are performed using the NOSER algorithm [42] and ToDLeR algorithm [43]–[45], respectively. Additionally, the collected voltage data is saved so that it can be analyzed offline with, for example, iterative and direct methods [13], [46], [47]. Besides the voltage information, other saved measurements include the ground current measurements, the ECG measurements from all electrodes, and the temperature of the calibration board. In addition to the measurements of the imaging session, some technical static data including the frequency of operation, the applied current patterns, the frame rate, and the size of the electrodes is stored. The location of the operation, the name of the operator, and the identification number of the human subject are also appended to the data stored for each recording session.
F. Safety Features
ACT5 deploys multiple hardware and software features that ensure safety when imaging human subjects. On the hardware level, ACT5 uses the NEVO+600M [48] medical power supply, electrically decouples the communication link with the laptop/PC using optical isolators, places a DC-blocking capacitor in series with each electrode, and limits the maximum current that can be applied to each electrode. Additionally, the system can disable the main power supply, completely shutting down the instrument, if it senses a persistent fault.
The next layer of safety is implemented within the firmware of the FPGAs. Each source FPGA monitors the ADC measurements and, in the case of an overflow in the measured voltages, it activates the safety protocol. Simultaneously, the calibration FPGA measures the current in the ground electrode, separately measuring the current at the EIT excitation frequency and the broadband RMS current, and activates the safety protocol if either of these ground currents exceeds safe thresholds. Using a dedicated bus line connected to all channels, the safety protocol sets all currents to zero and digitally disconnects the current sources and voltmeters from the cables to the electrodes. The controller FPGA monitors the data and signals received from the channels and the calibration FPGA and, in case of an error, it will halt the imaging process. The firmware safety features can detect the detachment of any of the electrodes, including the ground electrode.
The last layer of safety is implemented in the software where the data from ACT5 is analyzed in real-time. Software can detect if an electrode has a loose connection to the body, or if it is slowly becoming detached. The software also provides the stop function to the operator that would interrupt the operation of the system.
G. Calibration
The calibration process of ACT5 is done in multiple phases. This section provides only a brief review of the calibration process. The details of the process can be found in [36].
1). Calibration Board Voltmeter:
At the initial phase of the calibration process, the voltmeter on the calibration board is calibrated using a 0.5 V signal from the calibration board voltage source.
2). Calibration Board Ammeter:
At the second phase, the same voltage signal used in the first phase is applied to the precision resistor and the current is passed through the I-V converter. Through this process, the ammeter on the calibration board is calibrated.
3). Channel Voltmeters:
The third phase calibrates the voltmeters on the channels. For this, all the channels are connected to the calibration bus and the calibration board applies a voltage signal to the calibration bus. By measuring the voltage on the calibration bus on all the channels and on the calibration board, the voltmeters on the channels are calibrated.
4). Channel Current Sources:
During the fourth phase of the calibration process, the current sources on the channels are calibrated. In this phase, channels connect to the calibration bus one at a time. The active channel applies a current to the calibration bus where the applied current is measured on the calibration board. By using the measured current on the calibration board, the current source on the channel is calibrated to a single standard.
The calibration process produces a set of calibration constants that are used to scale the applied currents and measured voltages. Multiple sets of constants, each for a different excitation frequency, can be stored and used.
H. Shunt Impedance Measurement
ACT5 adaptive current sources require accurate measurement of the shunt impedance on the channels to compensate for the lost current. The attached cables, in addition to the parasitic capacitance on the PCB board, introduce a significant shunt impedance to the output of the current sources. Although the approximate value of the shunt impedance is known, the true value varies among channels. Additionally, the default cables of ACT5 can be swapped for longer or shorter cables depending on the application, which further necessitates accurate measurement of shunt impedance.
ACT5 measures the shunt impedance on the output of the current sources by measuring them in open-circuit (OC) configuration, with the cable attached to the channel, but not connected to a load. A small current is then applied to the output of the current source. Since all the applied current passes through the shunt impedance, the induced voltage can be used to measure the shunt impedance value,
| (2) |
I. Programmable Current Patterns
The amplitude and phase of the applied current from each current source for each pattern in ACT5 can be programmed during the setup phase of the imaging process, making it possible to apply an arbitrary set of current patterns. By default, ACT5 uses patterns which are optimal for a homogeneous circular (2D) or cylindrical (3D) region. The ability to change the current patterns is useful in various situations such as when fewer electrodes than the default 32 electrodes are active, when patterns should change due to changes in the shape and configuration of the imaged medium [49], [50], and cases where applying current patterns with phase shifts would provide diagnostic clues on faults in the circuits or the FPGA firmware.
III. Results
This section describes experimental results obtained using a saline-filled tank with targets and a human subject.
A. Tank Results
The experiments performed using a saline-filled tank demonstrate the ability of ACT5 to detect small changes in the conductivity, apply arbitrary current patterns, and operate over a wide range of excitation frequencies.
1). Distinguishability:
To quantify the distinguishability, the system’s ability to detect and image very small targets in the center of the tank was measured. The center of the tank is the most difficult place to detect a small object. Metal targets with diameters 4.76 mm, 3.57 mm, 2.78 mm, and 1.59 mm were placed at the center of a 30 cm diameter tank filled with 390 mS/m conductive saline and data were collected using trigonometric current patterns with maximum current amplitude of 0.25 mA applied at 23 kHz, 94 kHz, 141 kHz, and 199 kHz. Photos of the targets are found in Fig. 7a and the position of the targets in the tank is shown in Fig. 7b. A reconstructed difference image of the 1.59 mm diameter target, formed using single data sets taken with and without the target (no averaging), at 199 kHz is found in Fig. 7c. One quantitative measure of the ability of a current pattern to distinguish two conductivity distributions from one another is the norm distinguishability given by
| (3) |
It represents the total measured change in resistance due to the change in interior resistivity distributions in Ohms [51]. Table III lists the maximum norm distinguishability over all patterns of applied current, which in fact, occurred at current pattern 17 in each case. The table shows that for the larger targets, the distinguishability factor does not vary significantly for different frequencies of operation, while for the smaller targets, lower frequencies of operation yield significantly smaller distinguishability.
Fig. 7:
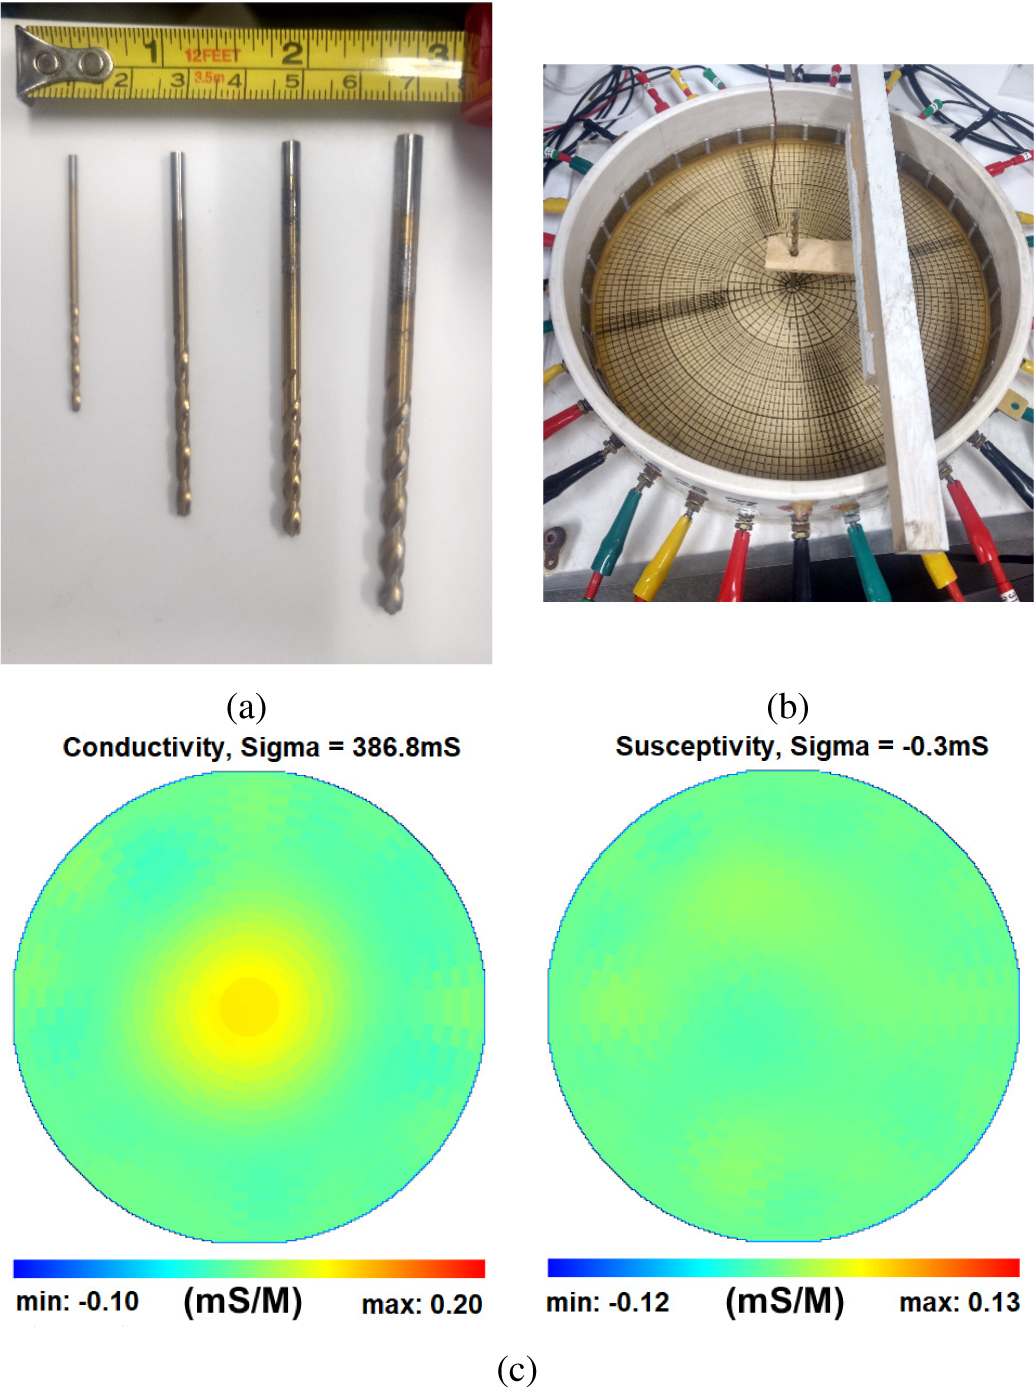
(a) Small targets with diameters 1.59 mm, 2.78 mm, 3.57 mm, and 4.76 mm used in the distinguishability study. (b) Target placement at the center of the saline tank. (c) Reconstructions of conductivity (left) and susceptivity (right) of the 1.59 mm diameter target in the center of the tank at 199 kHz. Note that the target has zero permittivity, and so it is a positive attribute that the susceptivity image is homogeneous.
TABLE III:
Maximum norm distinguishability by frequency for each of the four targets. Note that the maximum distinguishability occurred at current pattern 17 (sin θ) in each case.
| Frequency |
||||
|---|---|---|---|---|
| Target diameter | 23 kHz | 94 kHz | 141 kHz | 199 kHz |
|
| ||||
| 1.59 mm | 0.019 | 0.060 | 0.059 | 0.136 |
| 2.78 mm | 0.156 | 0.187 | 0.170 | 0.144 |
| 3.57 mm | 0.241 | 0.250 | 0.253 | 0.264 |
| 4.76 mm | 0.380 | 0.393 | 0.361 | 0.424 |
2). Programmable Current Patterns:
To demonstrate the capability of ACT5 to apply any give current pattern, the eigencurrents for heart- and lung-shaped agar targets in a saline tank (Fig. 8a) were determined through the process introduced in [52] with an applied current frequency of 99.609 kHz. The background saline has a conductivity of 180 mS/m, the heart-shaped target has a conductivity of 286 mS/m, and the lung-shaped targets have a conductivity of 86 mS/m. These eigencurrents are the eigenvectors of the impedance network of the saline tank, so that the applied current vectors and the measured voltage vectors are linearly related to each other by a scalar factor
| (4) |
Several of the 31 eigencurrents for this experiment are shown in Fig. 9, along with trigonometric patterns. It can be seen that these custom current patterns are similar to the trigonometric patterns for lower spatial frequencies, but diverge from the trigonometric patterns at higher spatial frequencies. The reconstructed absolute image is shown in Fig. 8b where the more conductive electrodes, heart, and the less-conductive lungs are shown.
Fig. 8:
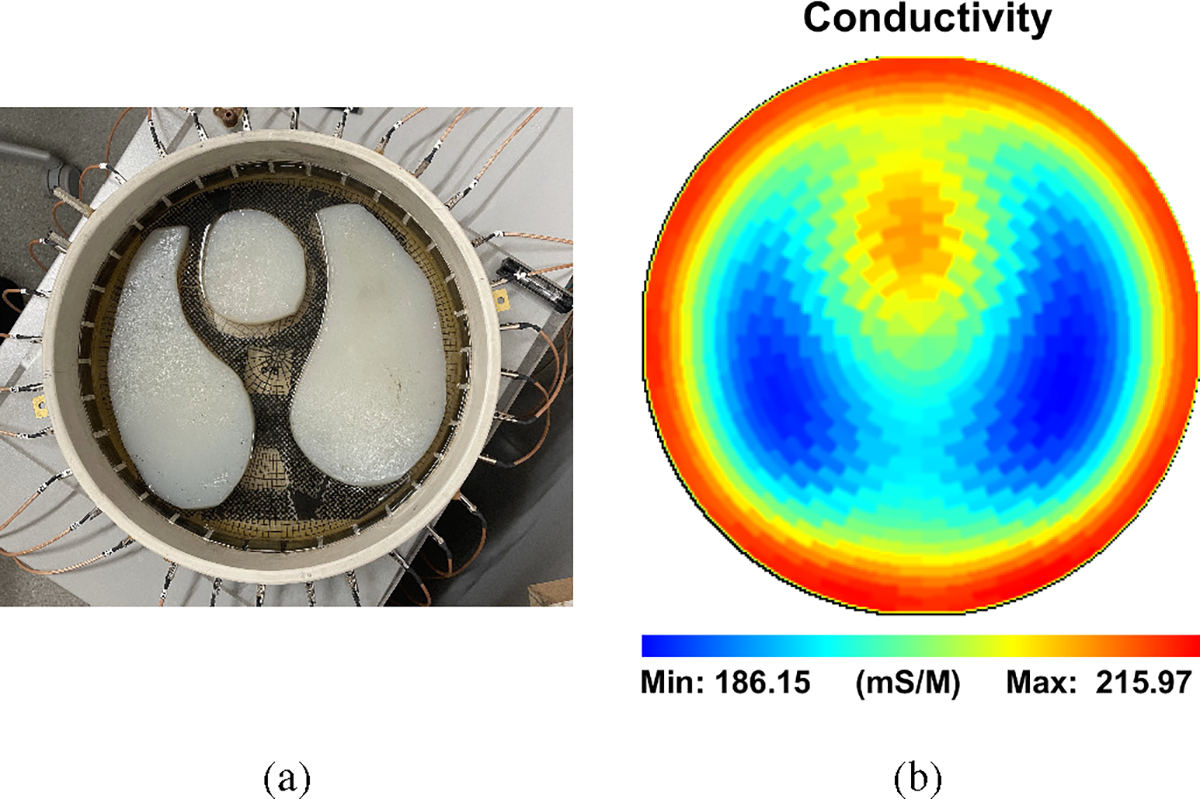
(a) Agar heart, lungs, and metal electrodes in a saline-filled tank. (b) Absolute image reconstruction of the tank.
Fig. 9:
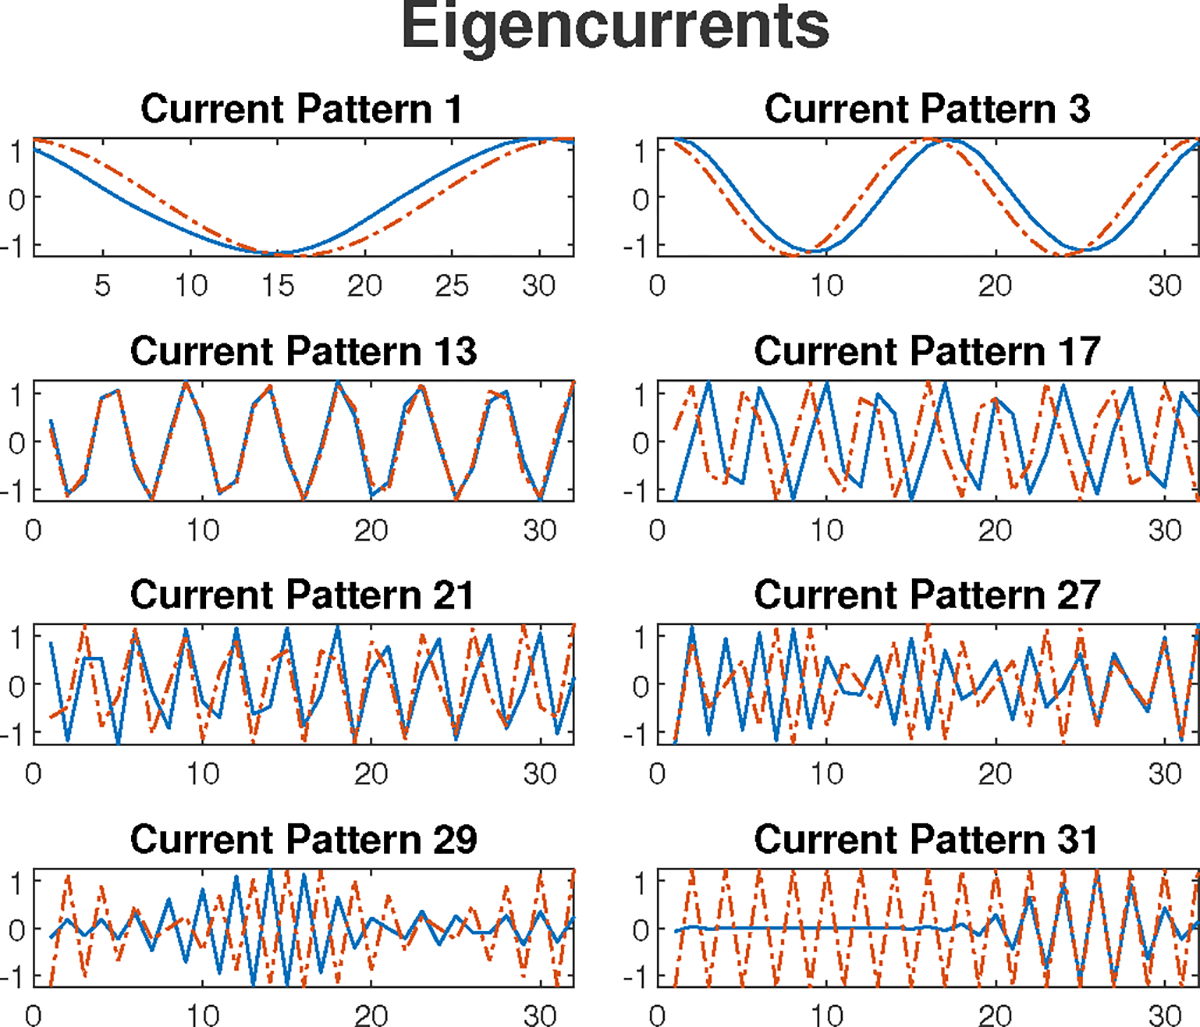
Eight eigencurrent patterns of the applied current patterns to the saline tank with heart and lungs agar targets. The trigonometric patterns are plotted (dotted lines) alongside the eigencurrent patterns (solid lines) for each pattern.
3). Frequency Response:
The performance of ACT5 over different frequencies is presented here. For this purpose, data from the tank at frequencies from 5 kHz to 451 kHz were collected. The data are first collected from the tank filled only with saline and then with a PVC target (diameter of 34 mm), an unpolished copper target (diameter of 35 mm), and a polished copper target (diameter of 30 mm) as shown in Fig. 10a. The reconstructed difference images for five frequencies are shown in Fig. 10b–Fig. 10f where the saline-filled tank is used as the reference image. The targets are clear in the conductivity images with relatively little change in magnitude across the range of frequencies. In the susceptivity images, the copper targets appear capacitive (positive susceptivity values) at lower frequencies with the unpolished copper having higher capacitance as expected due to the presence of an oxide layer. As the frequency increases, the copper targets become inductive (negative values). Simultaneously, the PVC target is not distinguishable at lower frequencies in the susceptivity images, but becomes increasingly capacitive as the frequency increases.
Fig. 10:
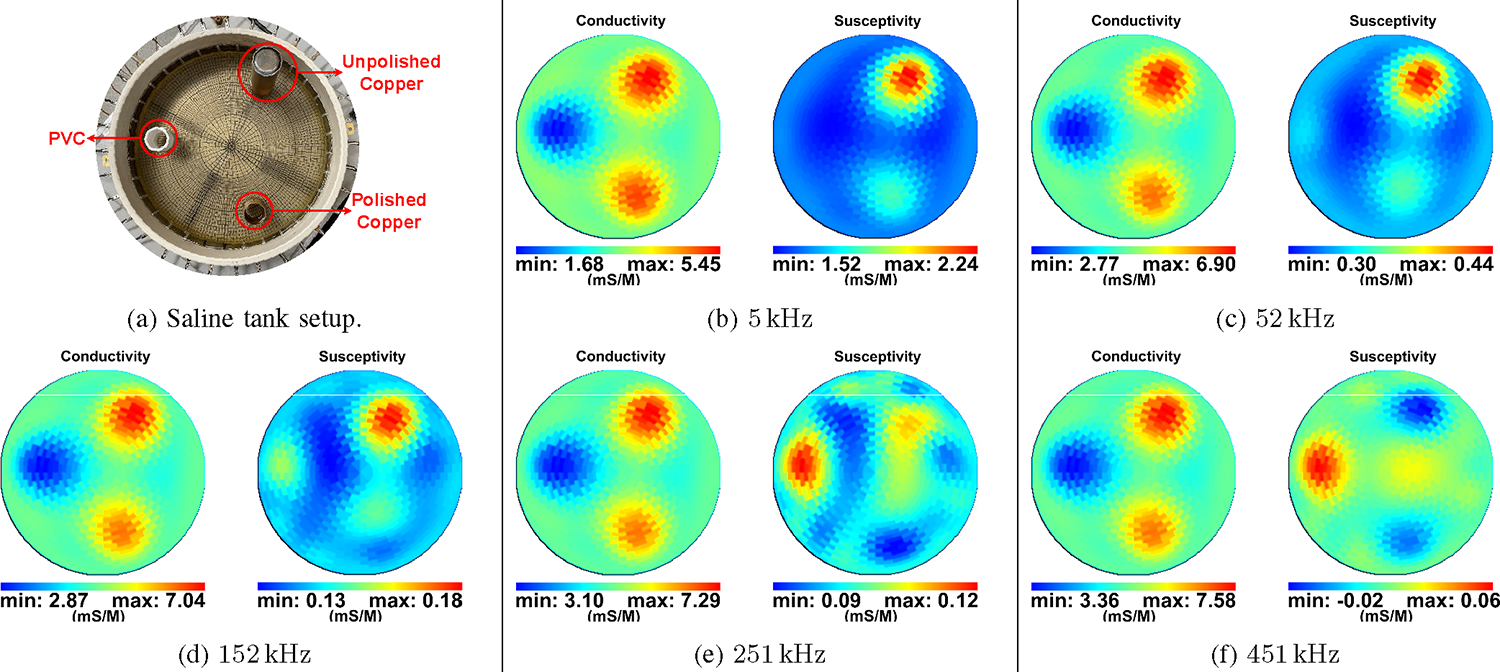
(a) Setup of targets in saline tank for imaging at multiple frequencies. (b)-(f) Performance of ACT5 through multiple frequencies. The difference images show a PVC target and two copper targets, one polished and one unpolished. The susceptivity images show the copper targets as capacitive at lower frequencies and inductive at higher frequencies. The PVC target is neither capacitive nor inductive at lower frequencies but turns capacitive at higher frequencies.
To check the validity of these results, the impedance behaviors of the copper and PVC targets in a saline-filled test cell with a stainless steel electrode on each end were measured from 1 kHz to 500 kHz using a Sourcetronic LCR Measuring Bridge ST2829C. The impedance of the test cell filled with saline alone (Fig. 11a) was first measured and found to be dependent on frequency, likely due to the frequency dependence of the properties of the electrode-saline interface and, to a lesser degree, the saline itself. At the next step, the PVC (Fig. 11b) and the copper targets (Fig. 11c), both polished and unpolished, were inserted in the test cell and the equivalent impedance of the test cell was again measured from 1 kHz to 500 kHz. The impedance of the electrode-saline interfaces are assumed to be in series with that of the targets and target-saline interface, so the impedance measured with the saline-only cell was subtracted from the impedance from each case with a target at each frequency. The negative of reactive component of difference for each of the target is shown in Fig. 12. The results show that the copper targets have capacitive behavior at lower frequencies and, as the frequency is increased, their behavior eventually becomes inductive. At the same time, the PVC target is neither capacitive or inductive at lower frequencies, but turns capacitive at higher frequencies. These results are consistent with the results from ACT5, validating the ACT5 reconstructed images.
Fig. 11:
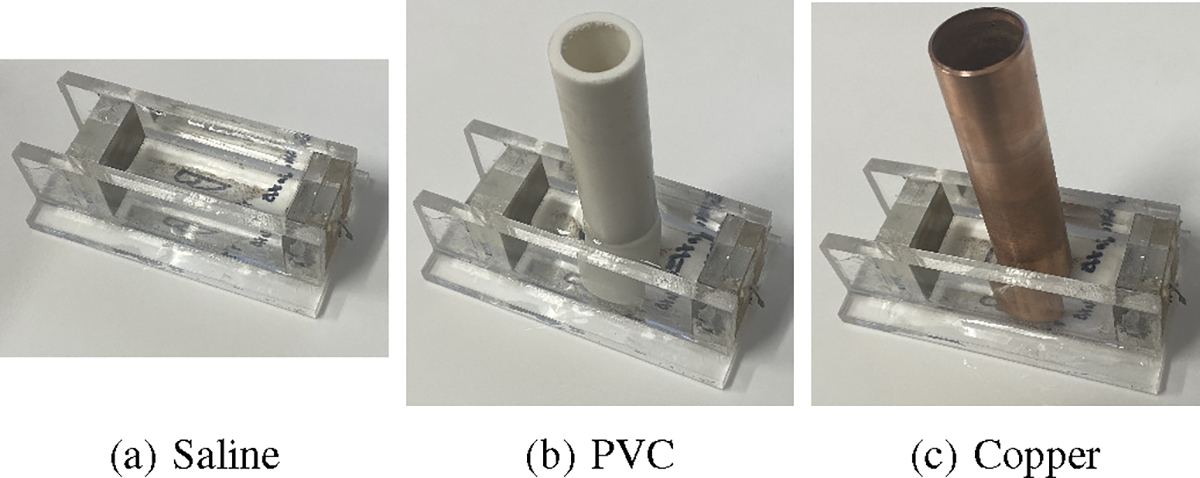
Test cell setup for measuring the frequency response of saline and different targets at various frequencies.
Fig. 12:
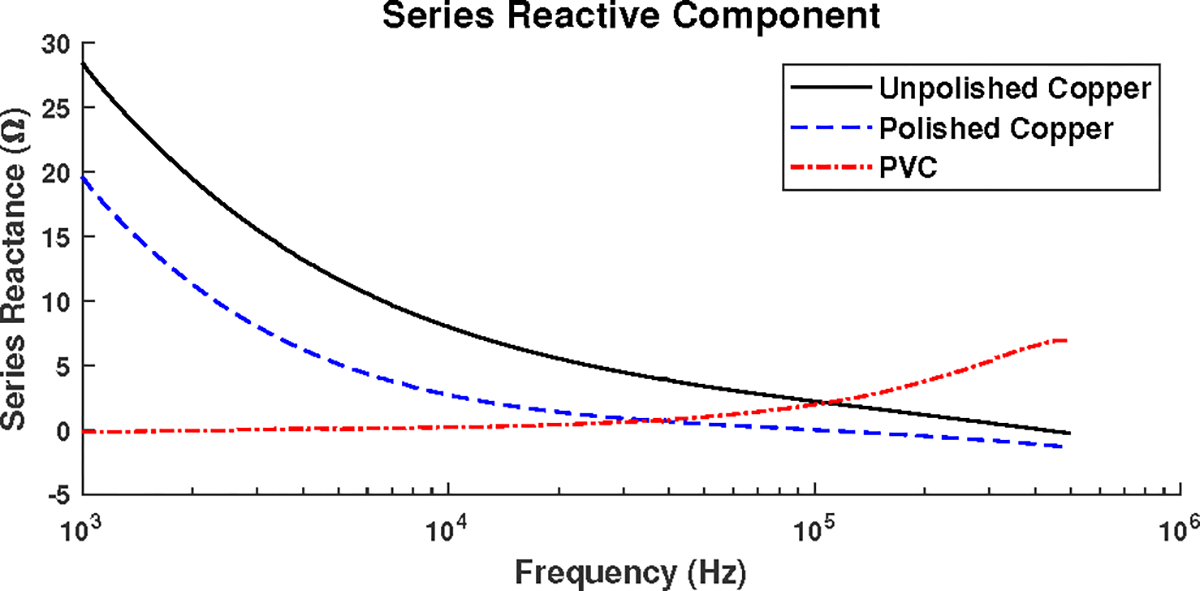
Negative of the reactive component of the impedance difference obtained using a saline-filled test cell with a PVC target, a polished copper target, and an unpolished copper target measured with an LCR meter.
B. Results from a healthy human subject
Human data collection was in accordance with the amended Declaration of Helsinki–Ethical Principles for Medical Research Involving Human Subjects under the approval of the Colorado State University Institutional Review Board (approval number 2943) with written informed consent.
The EIT data was collected on a 15-year-old healthy male subject having a Body Mass Index (BMI) of 19.5, 35 inches in chest circumference, in a supine position with 2 rows of 16 electrodes (Fig. 13) with the top row placed above the nipple line and the bottom row below the nipple line. A tensor product of trigonometric patterns with a peak current of 0.35 mA and a frequency of 99.609 kHz were used during breath-holding. The reconstructions are difference images after drift removal, with the average of all frames in a 155-frame sequence chosen as the reference. The images are single frames without post-processing noise filtering or averaging and are displayed in DICOM orientation. The reconstructions show conductivity and susceptivity images for slices at the levels of the top and bottom electrode rings.
Fig. 13:
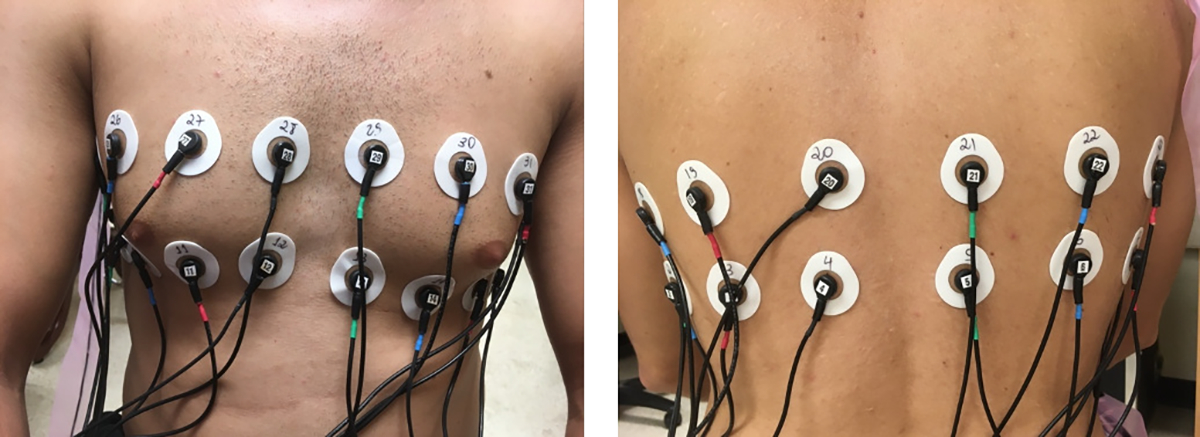
2×16 electrode arrangement
Fig. 14 – Fig. 17 show the reconstructions of pulsatile perfusion at the beginning of P wave, end of QRS complex, beginning of T wave, and end of T wave, respectively, with the moment in the cardiac cycle that represents each reconstruction indicated by the vertical red line in the ECG plot. At the beginning of P wave (Fig. 14), the ventricles are filling and the heart has a higher conductivity and susceptivity than the lungs. The heart appears primarily in the lower slice. End-Diastolic volume is reached at the end of QRS complex (Fig. 15) which is the moment that the heart pixels show the maximum conductivity and susceptivity values while the pixels in the regions of the lungs show the lowest conductivity and susceptivity values. Later, at the beginning of T wave (Fig. 16), the conductivity and susceptivity in the heart decreases while they increase in the lungs due to the blood ejection from the right ventricle into the pulmonary artery. The End-Systolic volume is reached at the end of T wave (Fig. 17), which is the moment that the pixels in the lung regions have the highest conductivity and susceptivity values while the heart pixels show the lowest conductivity and susceptivity values before the ventricular filling starts again.
Fig. 14:
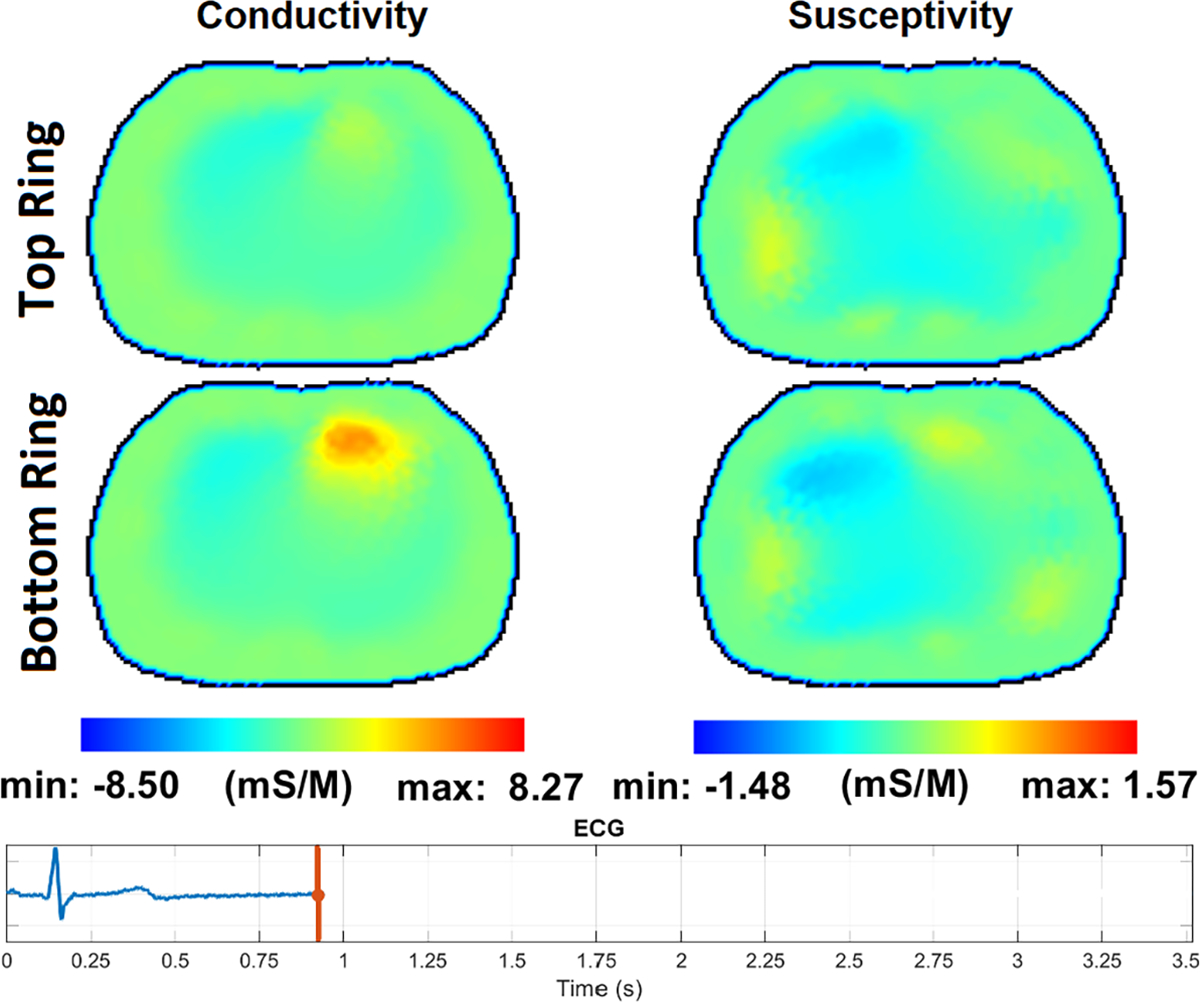
The pulsatile perfusion images with an ECG trace at the beginning of the P wave, the start of atrial depolarization.
Fig. 17:
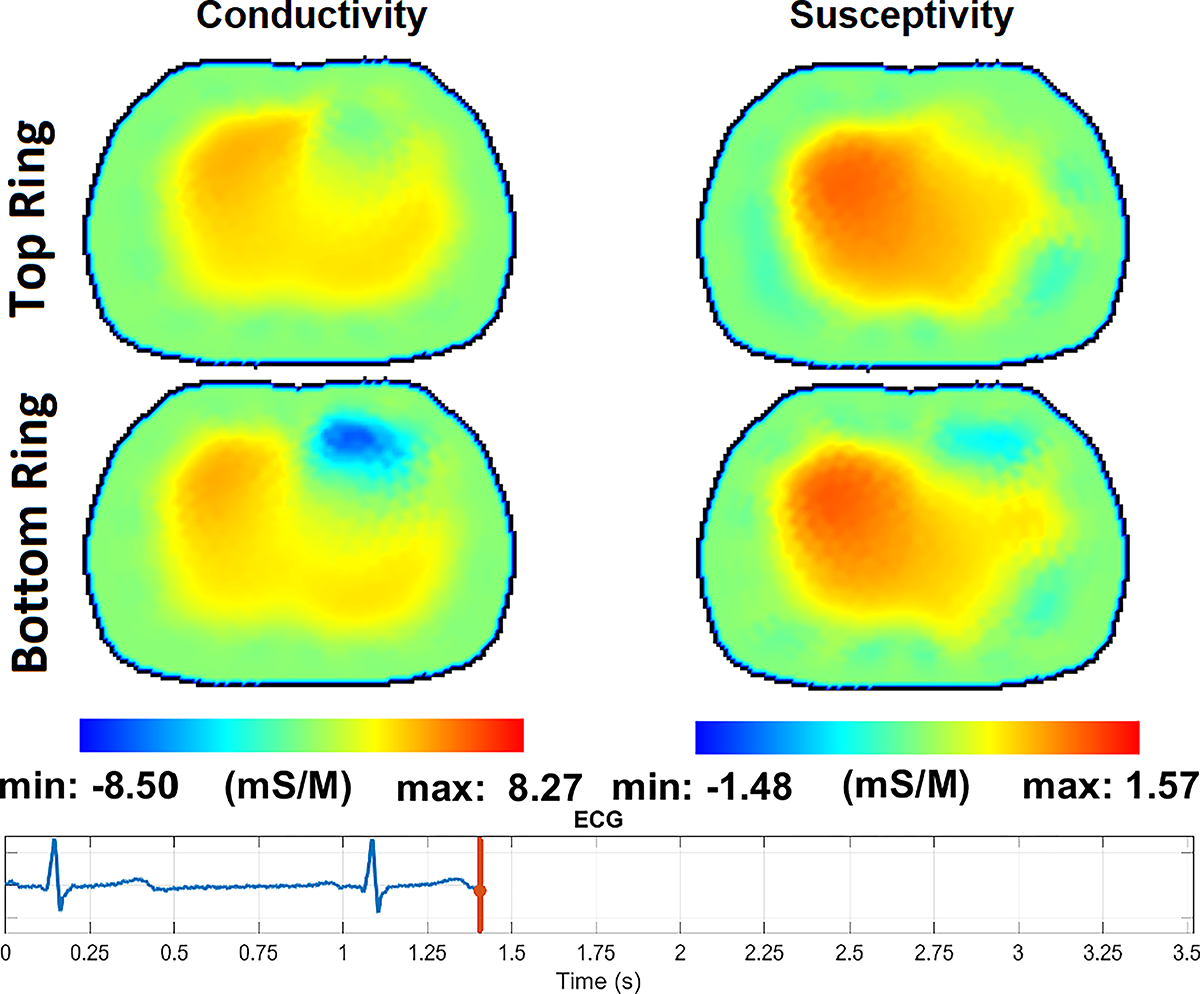
The pulsatile perfusion images with an ECG trace at the end of the T wave, the end of ventricular repolarization.
Fig. 15:
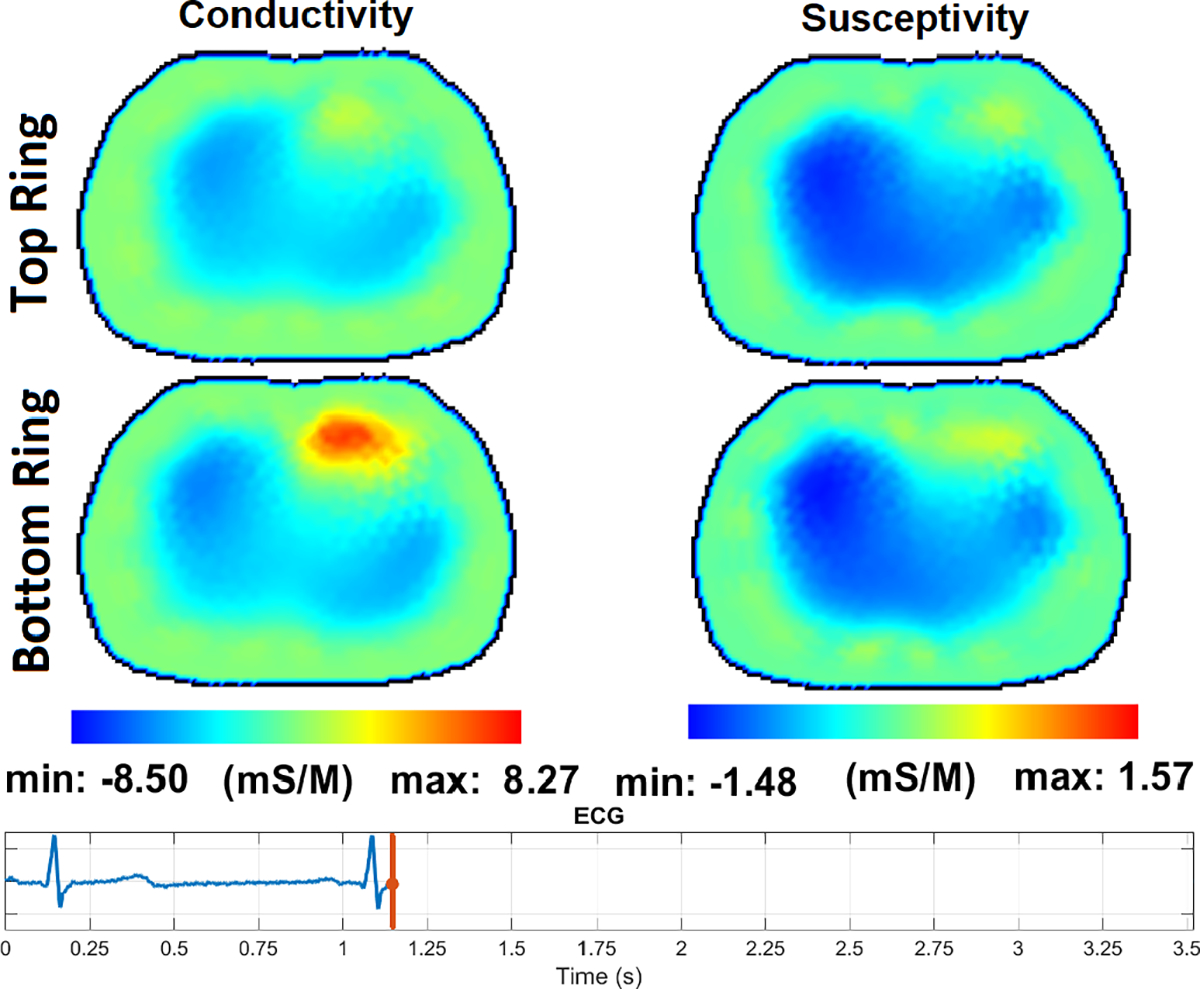
The pulsatile perfusion images with an ECG trace at the end of QRS complex, at the end of the diastolic phase before the blood ejection from heart to lungs.
Fig. 16:
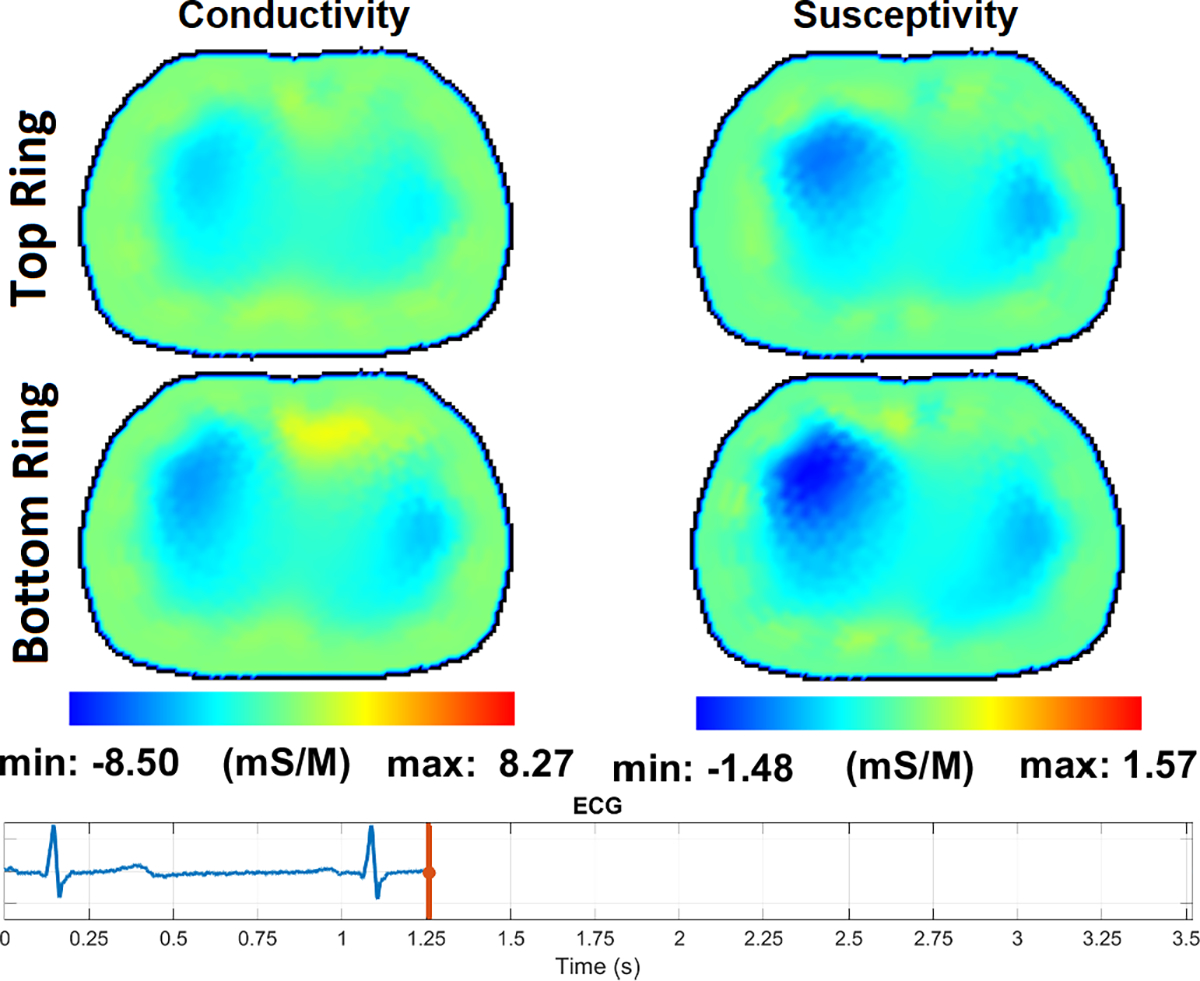
The pulsatile perfusion images with an ECG trace at the beginning of the T wave, the start of ventricular repolarization.
IV. Conclusion
This paper has introduced ACT5, a highly flexible, parallel drive electrical impedance tomography system for monitoring heart and lung function. The instrument uses a current source that results in simplified analog electronics and eliminates the need for cable shield drivers and collects complex voltage data enabling the reconstruction of both conductivity and susceptivity distributions. The results show the ability of ACT5 to detect and image very small targets, perform both absolute and difference imaging, operate over the frequency range of 5 – 500 kHz, and image pulsatile perfusion in a normal subject without averaging or contrast agents. Additionally, the ability of ACT5 to simultaneously acquire the ECG signal is demonstrated.
Acknowledgments
Research reported in this paper was supported by the National Institute of Biomedical Imaging and Bioengineering of the National Institutes of Health under award number 1R01EB026710–01A1. The content is solely the responsibility of the authors and does not necessarily represent the official views of the National Institutes of Health.
Contributor Information
Omid Rajabi Shishvan, Department of Electrical and Computer Engineering, University at Albany, State University of New York, Albany, NY 12222 USA.
Ahmed Abdelwahab, Department of Electrical and Computer Engineering, University at Albany, State University of New York, Albany, NY 12222 USA.
Nilton Barbosa da Rosa, Jr., School of Biomedical Engineering, Colorado State University, Fort Collins, CO 80523 USA
Gary J. Saulnier, Department of Electrical and Computer Engineering, University at Albany, State University of New York, Albany, NY 12222 USA.
Jennifer L. Mueller, Department of Mathematics and School of Biomedical Engineering, Colorado State University, Fort Collins, CO 80523 USA.
Jonathan C. Newell, Department of Biomedical Engineering, Rensselaer Polytechnic Institute, Troy, NY 12180 USA.
David Isaacson, Department of Mathematical Sciences, Rensselaer Polytechnic Institute, Troy, NY 12180 USA.
References
- [1].Jiang D, Wu Y, and Demosthenous A Hand gesture recognition using three-dimensional electrical impedance tomography. IEEE Transactions on Circuits and Systems II: Express Briefs, 67(9):1554–1558, 2020. [Google Scholar]
- [2].Saulnier GJ, Liu N, Tamma C, Xia H, Kao TJ, Newell JC, and Isaacson D An electrical impedance spectroscopy system for breast cancer detection. In 2007 29th Annual International Conference of the IEEE Engineering in Medicine and Biology Society, pages 4154–4157. IEEE, 2007. [DOI] [PubMed] [Google Scholar]
- [3].Halter RJ, Hartov A, Heaney JA, Paulsen KD, and Schned AR Electrical impedance spectroscopy of the human prostate. IEEE Transactions on Biomedical Engineering, 54(7):1321–1327, 2007. [DOI] [PubMed] [Google Scholar]
- [4].Murphy EK, Skinner J, Martucci M, Rutkove SB, and Halter RJ Toward electrical impedance tomography coupled ultrasound imaging for assessing muscle health. IEEE transactions on medical imaging, 38(6):1409–1419, 2018. [DOI] [PMC free article] [PubMed] [Google Scholar]
- [5].McDermott B, O’Halloran M, Porter E, and Santorelli A Brain haemorrhage detection using a SVM classifier with electrical impedance tomography measurement frames. PloS one, 13(7):e0200469, 2018. [DOI] [PMC free article] [PubMed] [Google Scholar]
- [6].Tidswell AT, Gibson A, Bayford RH, and Holder DS Validation of a 3D reconstruction algorithm for EIT of human brain function in a realistic head-shaped tank. Physiological measurement, 22(1):177, 2001. [DOI] [PubMed] [Google Scholar]
- [7].Aristovich KY, Packham BC, Koo H, Dos Santos GS, McEvoy A, and Holder DS Imaging fast electrical activity in the brain with electrical impedance tomography. NeuroImage, 124:204–213, 2016. [DOI] [PMC free article] [PubMed] [Google Scholar]
- [8].Cook RD, Saulnier GJ, D G. Gisser, J. C. Goble, J. C. Newell, and D. Isaacson. ACT3: A high-speed, high-precision electrical impedance tomograph. IEEE Transactions on Biomedical Engineering, 41(8):713–722, 1994. [DOI] [PMC free article] [PubMed] [Google Scholar]
- [9].Mellenthin MM, Mueller JL, de Camargo EDLB, de Moura FS, Santos TBR, Lima RG, Hamilton SJ, Muller PA, and Alsaker M The ACE1 electrical impedance tomography system for thoracic imaging. IEEE Transactions on Instrumentation and Measurement, 68(9):3137–3150, 2018. [DOI] [PMC free article] [PubMed] [Google Scholar]
- [10].Fuks LF, Cheney M, Isaacson D, Gisser DG, and Newell JC Detection and imaging of electric conductivity and permittivity at low frequency. IEEE Transactions on Biomedical Engineering, 38(11):1106–1110, 1991. [DOI] [PubMed] [Google Scholar]
- [11].Schwan HP Electrical properties of body tissues and impedance plethysmography. IRE Transactions on Medical Electronics, pages 32–46, 1955. [Google Scholar]
- [12].Kobylianskii J, Murray A, Brace D, Goligher E, and Fan E Electrical impedance tomography in adult patients undergoing mechanical ventilation: a systematic review. Journal of critical care, 35:33–50, 2016. [DOI] [PubMed] [Google Scholar]
- [13].Mueller JL and Siltanen S The D-bar method for electrical impedance tomography—demystified. Inverse problems, 36(9):093001, 2020. [DOI] [PMC free article] [PubMed] [Google Scholar]
- [14].Cheng KS, Simske SJ, Isaacson D, Newell JC, and Gisser DG Errors due to measuring voltage on current-carrying electrodes in electric current computed tomography. IEEE transactions on biomedical engineering, 37(1):60–65, 1990. [DOI] [PubMed] [Google Scholar]
- [15].Sentec. Electrical impedance tomography device - LuMon. www.sentec.com/electrical-impedance-tomography/. [Accessed: May 2023].
- [16].Dräger. Dräger PulmoVista 500. www.draeger.com/enuk/Products/PulmoVista-500. [Accessed: May 2023].
- [17].Timpel. Timpel precision ventilation. www.timpelmedical.com/. [Accessed: May 2023].
- [18].Gense. Gense. www.gensetechnologies.com/. [Accessed: May 2023].
- [19].Sciospec. Sciospec’s electrical impedance tomography. www.sciospec.com/eit/. [Accessed: May 2023].
- [20].Saulnier GJ Electronics and hardware. In Electrical Impedance Tomography, pages 53–78. CRC Press, 2021. [Google Scholar]
- [21].Li Y, Wang N, Fan LF, Zhao PF, Li JH, Huang L, and Wang ZY Robust electrical impedance tomography for biological application: A mini review. Heliyon, 2023. [DOI] [PMC free article] [PubMed] [Google Scholar]
- [22].Tiwari VK, Meribout M, Khezzar L, Alhammadi K, and Tarek M Electrical tomography hardware systems for real-time applications: A review. IEEE Access, 2022. [Google Scholar]
- [23].Zhu QS, McLeod CN, Denyer CW, Lidgey FJ, and Lionheart WRB Development of a real-time adaptive current tomograph. Physiological measurement, 15(2A):A37, 1994. [DOI] [PubMed] [Google Scholar]
- [24].Oh TI, Wi H, Kim DY, Yoo PJ, and Woo EJ A fully parallel multi-frequency EIT system with flexible electrode configuration: KHU Mark2. Physiological measurement, 32(7):835, 2011. [DOI] [PubMed] [Google Scholar]
- [25].Wi H, Sohal H, McEwan AL, Woo EJ, and Oh TI Multi-frequency electrical impedance tomography system with automatic self-calibration for long-term monitoring. IEEE transactions on biomedical circuits and systems, 8(1):119–128, 2013. [DOI] [PubMed] [Google Scholar]
- [26].Amm B, Kao TJ, Wang X, Boverman G, Shoudy D, Sabatini J, Ashe J, Newell J, Saulnier G, Isaacson D, et al. Real-time 3D electrical impedance imaging for ventilation monitoring of the lung: pilot study. In 2014 36th Annual International Conference of the IEEE Engineering in Medicine and Biology Society, pages 6064–6067. IEEE, 2014. [DOI] [PubMed] [Google Scholar]
- [27].Hartov A, Mazzarese RA, Reiss FR, Kerner TE, Osterman KS, Williams DB, and Paulsen KD A multichannel continuously selectable multifrequency electrical impedance spectroscopy measurement system. IEEE transactions on biomedical engineering, 47(1):49–58, 2000. [DOI] [PubMed] [Google Scholar]
- [28].Halter RJ, Hartov A, and Paulsen KD A broadband high-frequency electrical impedance tomography system for breast imaging. IEEE Transactions on biomedical engineering, 55(2):650–659, 2008. [DOI] [PubMed] [Google Scholar]
- [29].Halter R, Hartov A, and Paulsen KD Design and implementation of a high frequency electrical impedance tomography system. Physiological measurement, 25(1):379, 2004. [DOI] [PubMed] [Google Scholar]
- [30].Kourunen J, Savolainen T, Lehikoinen A, Vauhkonen M, and Heikkinen LM Suitability of a PXI platform for an electrical impedance tomography system. Measurement Science and Technology, 20(1):015503, 2008. [Google Scholar]
- [31].Yue X and McLeod C FPGA design and implementation for EIT data acquisition. Physiological measurement, 29(10):1233, 2008. [DOI] [PubMed] [Google Scholar]
- [32].Brown BH, Barber DC, Leathard AD, Lu L, Wang W, and Smallwood RH High frequency EIT data collection and parametric imaging. Innovation et technologie en biologie et médecine, 15:1–8, 1994. [Google Scholar]
- [33].Rapin M, Braun F, Adler A, Wacker J, Frerichs I, Vogt B, and Chetelat O Wearable sensors for frequency-multiplexed EIT and multilead ECG data acquisition. IEEE Transactions on Biomedical Engineering, 66(3):810–820, 2018. [DOI] [PubMed] [Google Scholar]
- [34].Isaacson D Distinguishability of conductivities by electric current computed tomography. IEEE transactions on medical imaging, 5(2):91–95, 1986. [DOI] [PubMed] [Google Scholar]
- [35].nVent SCHROFF. User Manual VME/VME64x Backplanes, August 2019. Rev.005. [Google Scholar]
- [36].Saulnier GJ, Abdelwahab A, and Rajabi Shishvan O DSP-based current source for electrical impedance tomography. Physiological measurement, 41(6):064002, 2020. [DOI] [PMC free article] [PubMed] [Google Scholar]
- [37].Franco S Design with Operational Amplifiers and Analog Integrated Circuits. McGraw-Hill, 2015. [Google Scholar]
- [38].McEwan A, Cusick G, and Holder DS A review of errors in multi-frequency EIT instrumentation. Physiological measurement, 28(7):S197, 2007. [DOI] [PubMed] [Google Scholar]
- [39].Saulnier GJ, Abdelwahab A, and Maysha F DSP-based adaptive current source for EIT applications. In 20th International Conference on Biomedical Applications of Electrical Impedance Tomography (EIT 2019), volume 7, 2019. [Google Scholar]
- [40].Abdelwahab A, Rajabi Shishvan O, and Saulnier GJ Performance of an adaptive current source for EIT driving loads through a shielded coaxial cable. In 2020 42nd Annual International Conference of the IEEE Engineering in Medicine & Biology Society (EMBC), pages 1448–1451. IEEE, 2020. [DOI] [PMC free article] [PubMed] [Google Scholar]
- [41].Abdelwahab A, Rajabi Shishvan O, and Saulnier GJ A modified Howland current source design for simultaneous EIT/ECG data acquisition. In International Conference of Bioelectromagnetism, Electrical Bioimpedance, and Electrical Impedance Tomography (ICBEM-ICEBI-EIT 2022), pages 208–211, 2022. [PMC free article] [PubMed] [Google Scholar]
- [42].Cheney M, Isaacson D, Newell JC, Simske S, and Goble J NOSER: An algorithm for solving the inverse conductivity problem. International Journal of Imaging systems and technology, 2(2):66–75, 1990. [DOI] [PMC free article] [PubMed] [Google Scholar]
- [43].Blue RS, Isaacson D, and Newell JC Real-time three-dimensional electrical impedance imaging. Physiological measurement, 21(1):15, 2000. [DOI] [PubMed] [Google Scholar]
- [44].Blue RS Real-time three-dimensional electrical impedance tomography. PhD thesis, Rensselaer Polytechnic Institute, 1997. [Google Scholar]
- [45].Kao TJ, Amm B, Isaacson D, Newell J, Saulnier G, and Mueller JL A 3D reconstruction algorithm for real-time simultaneous multi-source EIT imaging for lung function monitoring. bioRxiv, 2020. [Google Scholar]
- [46].Isaacson D, Mueller JL, Newell JC, and Siltanen S Reconstructions of chest phantoms by the D-bar method for electrical impedance tomography. IEEE Transactions on medical imaging, 23(7):821–828, 2004. [DOI] [PubMed] [Google Scholar]
- [47].Rixen J, Leonhardt S, Moll J, Nguyen DH, and Ngo C. The D-bar algorithm fusing electrical impedance tomography with a priori radar data: A hands-on analysis. Algorithms, 16(1):43, 2023. [Google Scholar]
- [48].Power Vox. NEVO+600M AC/DC Modular Configurable PSU. [Google Scholar]
- [49].Grychtol B, Schramel JP, Braun F, Riedel T, Auer U, Mosing M, Braun C, Waldmann AD, Böhm SH, and Adler A Thoracic EIT in 3D: experiences and recommendations. Physiological measurement, 40(7):074006, 2019. [DOI] [PubMed] [Google Scholar]
- [50].Hamilton SJ, Muller PA, Isaacson D, Kolehmainen V, Newell J, Rajabi Shishvan O, Saulnier G, and Toivanen J Fast absolute 3D CGO-based electrical impedance tomography on experimental tank data. Physiological Measurement, 43(12):124001, 2022. [DOI] [PMC free article] [PubMed] [Google Scholar]
- [51].Cheney M and Isaacson D Distinguishability in impedance imaging. IEEE Transactions on Biomedical Engineering, 39(8):852–860, 1992. [DOI] [PubMed] [Google Scholar]
- [52].Gisser DG, Isaacson D, and Newell JC Electric current computed tomography and eigenvalues. SIAM J Appl Math, 50(6):1623–1634, 1990. [Google Scholar]


