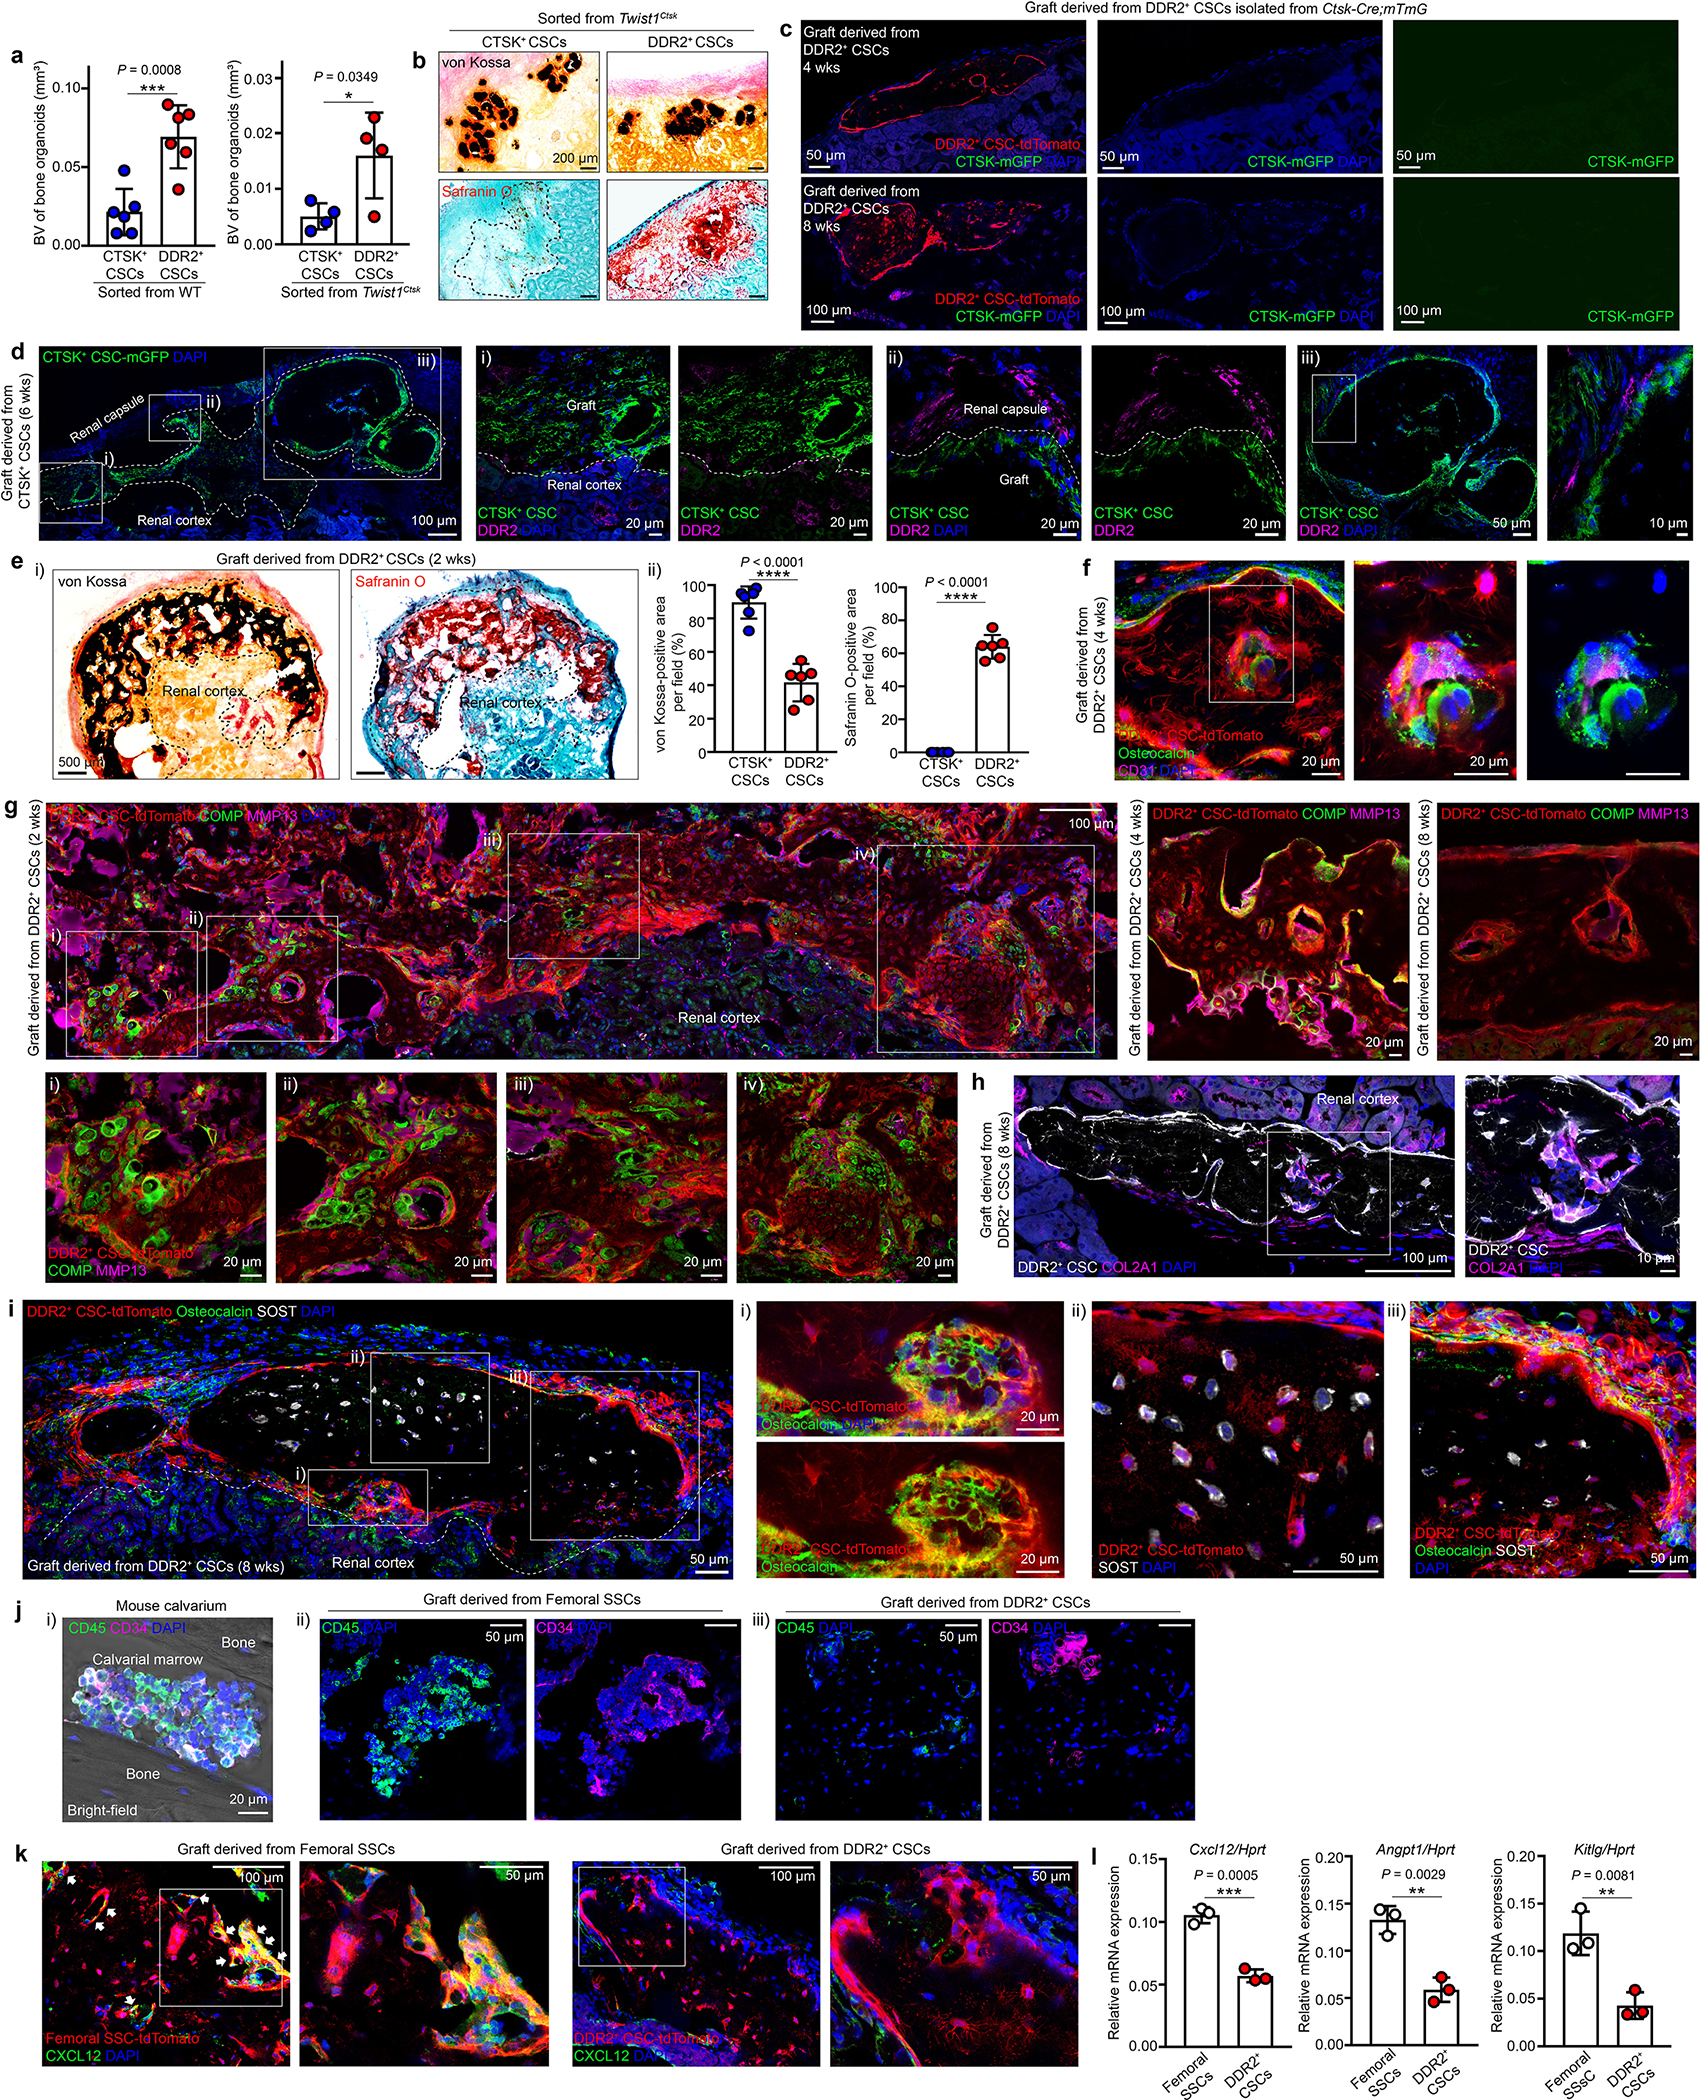
Extended Data Fig. 6 |. Functional characterization of DDR2+ CSCs.

a, Quantification of bone volume (BV) when equal numbers of CTSK+ CSCs and DDR2+ CSCs were individually isolated from WT (left, n=6) or Twist1Ctsk (right, n=6) mice 4 weeks after transplantation. Each of dots shown in the graph represents an individual graft. b, Representative images of von Kossa staining (top, black) for mineralized bone and Safranin O staining (bottom, red) for cartilage in adjacent serial sections from renal capsule bone organoids derived from CTSK+ CSCs and DDR2+ CSCs isolated from Twist1Ctsk mice 4 weeks after transplantation. c, Fluorescence images of grafts derived from DDR2+ CSCs (red) isolated from Ctsk-Cre;mTmG mice by FACS 4 or 8 weeks after transplantation into the renal capsule of secondary recipients. Green, CTSK+ mGFP; Red, Primary graft (DDR2+ CSCs); Blue, DAPI. d, Representative immunostaining images for DDR2 (magenta) in the graft 6 weeks after transplantation of CTSK+ CSCs (green) into the renal capsule. e, Images of von Kossa and Safranin O staining in the adjacent serial sections of the same renal capsule bone organoid grafts derived from CTSK+ CSC or DDR2+ CSCs 2 weeks after transplantation (i). Quantification of the area of von Kossa and Safranin O staining is provided in ii. f-i, Endochondral ossification with active cartilage remodeling is seen in the grafts derived from DDR2+ CSCs (red) via immunostaining for Osteocalcin (green) and CD31 (magenta) 4 weeks after transplantation (f), COMP (green) and MMP13 (magenta) 2, 4, and 8 weeks after implantation (g), DDR2+ CSCs and their derivatives (white) and COL2A1 (magenta) (h), Osteocalcin (green) and SOST (white) at 8 weeks post-transplantation (i) into the renal capsules of primary recipients. Higher magnification images are provided with the corresponding Roman numerals. j, k, Endochondral ossification without recruitment of hematopoietic elements in DDR2+ CSC-derived bone organoids: Immunostaining for hematopoietic cells with CD45 (green) and CD34 (magenta) in mouse calvarium at P21 (i), grafts derived from freshly sorted femoral skeletal stem cells (SSCs) (ii), or DDR2+ CSCs (iii) (j). Immunostaining for CXCL12 (green) in the grafts derived from femoral skeletal stem cells (SSCs, red) (left) or DDR2+ CSCs (red) (right) (k) 4 weeks after the renal capsule transplantation. Co-localization is shown by white arrows. l, RT-PCR analysis of hematopoietic niche factors including Cxcl12, Angpt1, and Kitlg in FACS-isolated femoral SSCs (n=3) and DDR2+ CSCs (n=3). Each of dots shown in the graph represents the cells of interest isolated from an individual mouse. ****P < 0.0001, P values are shown. Mean ± s.d., unpaired, two-tailed Student’s t-test (a, e (ii), l). All images shown in this figure are representative of a minimum of three independent experiments. Scale bars are included in microscopy images.
