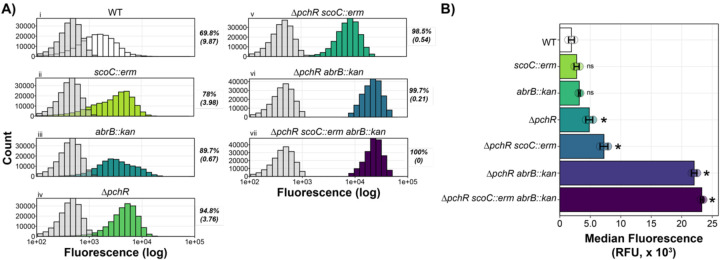
Fig. 3: ScoC, PchR, and AbrB Repress the yvmC Promoter.
A) Histograms representing fluorescence distribution as a function of cell count. In each panel, the negative control (grey, WT without GFP) was plotted with the corresponding genotype harboring a yvmC promoter fusion to GFP. Mean percent GFP positive with standard deviation in parentheses is provided to the right of each plot. Fluorescence was measured independently for each strain on three separate days with a representative shown. B) Median fluorescence for three separate trials (bar) with each trial median shown (circles). Error bars represent stand deviation between trials. Asterisks indicate an adjusted p-value less 0.05 while “ns” indicate non-significant comparisons with WT.

