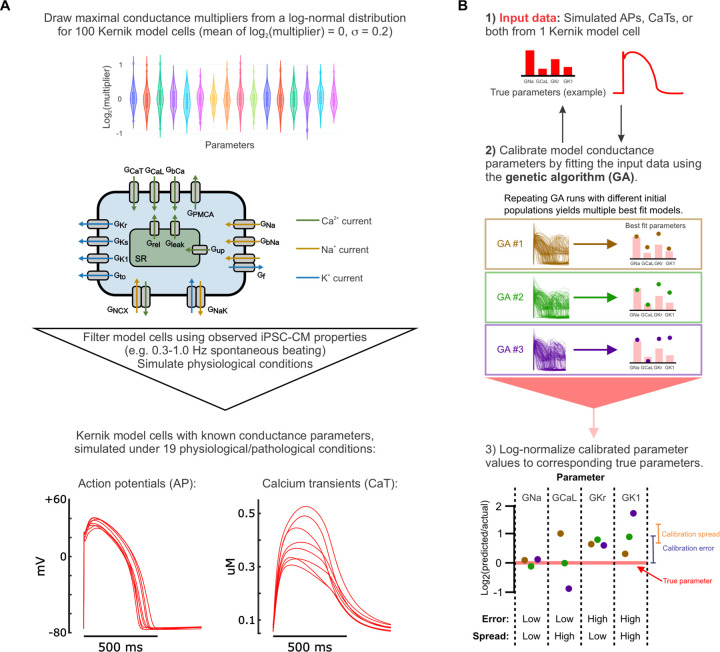
Figure 1: Generation of in silico dataset and calibration pipeline optimization.
(A) Schematic of the workflow for creating the in silico dataset used to optimize the calibration pipeline. (B) Schematic of the genetic algorithm (GA) parameter calibration process, including the true parameters that generated the input data (1), multiple genetic algorithm runs to fit this data (2), and metrics used to evaluate the resulting fitted parameter values (3). The genetic algorithm (GA) creates a population of model cells and simulates the same conditions that generated the input data. Then, the error between GA-generated traces and input data is calculated to determine how to modify the population, creating a new population. This process is repeated until the population’s errors converge (~20 iterations). For parameter evaluation: calibration error = | log2(fitted parameter value / true parameter value) |; calibration spread = standard deviation of log2(fitted parameter value / true parameter value) between 10 GA runs.

