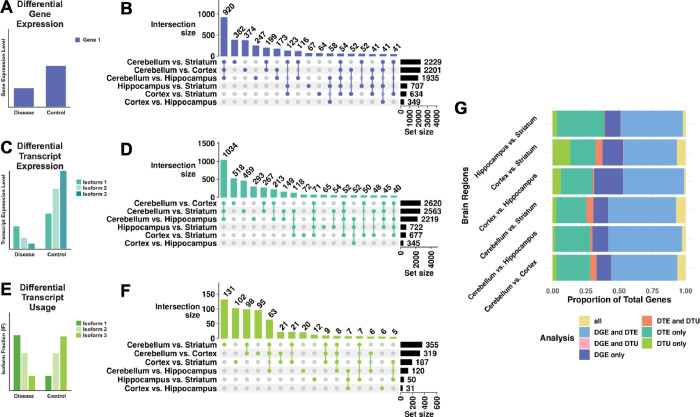
Figure 2. DGE, DTE, and DTU across pairwise brain region comparisons.
Cartoon representation of a gene with three isoforms (actual genes may have more or fewer isoforms) exemplifying (A) differential gene expression (DGE - violet), (C) differential transcript expression (DTE - turquoise), (E) and differential transcript usage (DTU - green). UpSet plots of the overlap of genes with (B) DGE (Wald test with BH correction p < 0.05), (D) DTE (Wald test with BH correction p < 0.05), and (F) DTU (t-test with BH correction p < 0.05) between pairwise brain region comparisons. The bar plot above denotes intersection size, circles denote which comparisons have overlap, and the set size reflects the total number of genes with DTU for that comparison. For panels B and D, we omitted intersections of fewer than 40 genes from the chart for legibility. For panel F, we omitted intersections of fewer than five for legibility. (G) Stacked bar chart representing pairwise brain region comparison overlap across DGE, DTE, and DTU. Genes included in the chart must express at least two transcripts.

