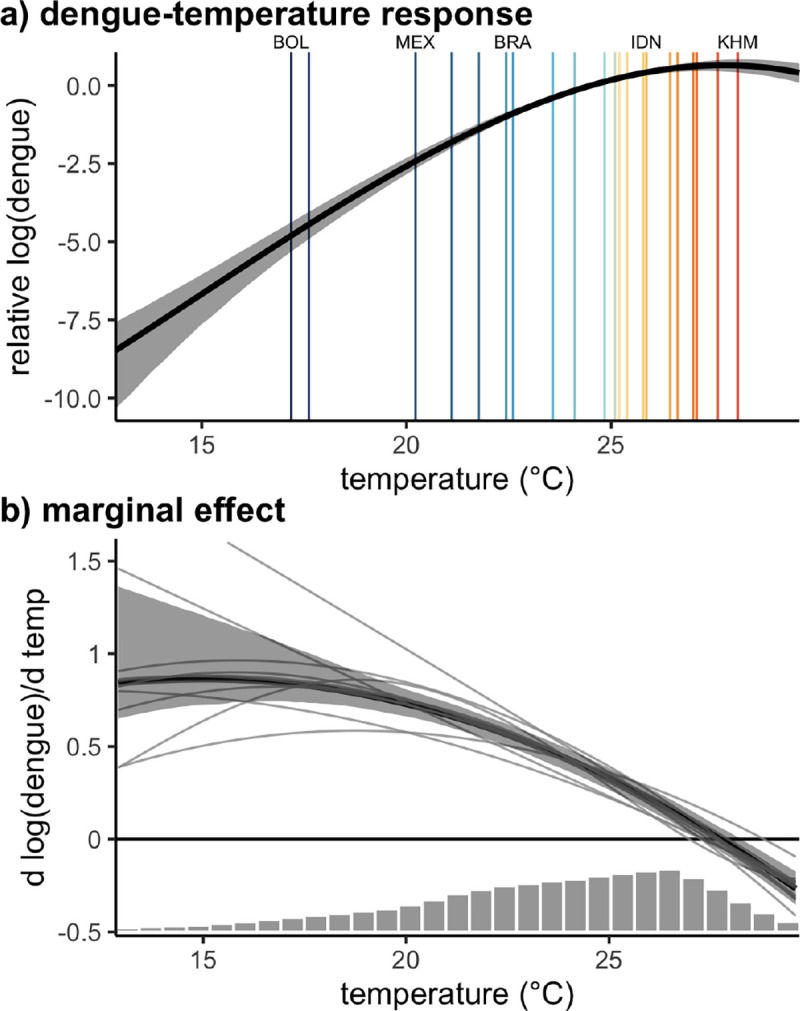
Figure 2: Effect of temperature on dengue.

(a) Global nonlinear relationship between dengue cases and temperature and (b) the slope of that relationship indicating the marginal effect of temperature on dengue incidence. Main panel regression model fit in black with 95% confidence interval in gray shading. Vertical lines in (a) indicate country mean temperatures, with labels highlighting the coldest and warmest countries as well as the three highest population countries in the sample: Bolivia (BOL), Mexico (MEX), Brazil (BRA), Indonesia (IDN), and Cambodia (KHM). Thin gray lines in (b) represent variations on the main model using alternative specifications. Histogram in (b) shows the distribution of observed monthly temperatures. Model estimates are restricted to the 1st to 99th percentiles of the observed temperature distribution.
