

Abstract
Recent advances have revolutionized the oldest high-throughput single-cell analytical tool, flow cytometry. Fluorescent analyzers and sorters with up to seven lasers and the potential to detect up to 50 parameters are changing the way flow cytometry is used, but old school practices which are inadequate for new technologies remain alive. This chapter summarizes recent advances, explains the most salient new features and offers a step-by-step guide to develop and successfully execute high-dimensional fluorescent flow cytometry experiments.
Keywords: Antibody, High-dimensional flow cytometry, Immunofluorescence, Immunology, Single-cell analysis
1. Principles of Fluorescent Flow Cytometry
The introduction of the universal cell theory [16] based on earlier microscopy observations revolutionized biological research. The need to improve upon low-throughput light microscopes led to the development of the first truly high-throughput cell analytical method, flow cytometry. Flow cytometers analyze single cells in suspension at high speed. The cells are illuminated by laser and the scattered or emitted fluorescent lights collected through photoelectric devices. The photons are converted to electric current, recorded, and analyzed with dedicated computer software. Flow cytometers accurately measure the intensity (count) and wavelength (color) of the photons, but in contrast to microscopes, spatial visual information is lost.
Although reportedly laser pointers can serve as light source [6], most instruments use high-quality lasers with ever-increasing power. Fluorescent emissions are detected with photomultiplier tubes (PMT) or avalanche photo diodes (APD) that convert photons into electric current in a voltage-dependent fashion. It is important to keep in mind that all cells exhibit autofluorescence due to excitation of intracellular metabolic compounds; therefore increasing detector sensitivity may enhance both specific and non-specific, background fluorescent signals.
A major challenge of multicolor cell analysis is that fluorescent emission produces multiple wavelength photons with both shorter and longer wavelength than the emission maximum. This limits nonoverlapping spectrum reagents to a handful within the typical 350–850 nm range of the spectrum. The use of multiple lasers and narrow band pass optical filters greatly enhance color discrimination and expand the number of distinguishable fluorochromes, but spectral overlap cannot be avoided and must be compensated for [1]. Modern instruments can calculate spillover matrices rapidly and precisely as long as appropriate single-stained compensation controls are available (see Subheading 3.1). An alternative approach of collecting fluorescent signals is based on real-time monitoring of the entire emitted spectra of fluorochromes [17]; see below Subheading 2.2).
Compensation-free flow cytometers have been developed based on measuring fluorescent lifetime of signal decay [8], but current instruments are limited in fluorochrome selection. The alternative, nonfluorescent high-dimensional flow cytometry technology of mass cytometry is not discussed here [2, 3]. Although mass cytometry pioneered 50 plus parameter flow analysis, it has remained a niche application of a single manufacturer’s technology (Fluidigm’s CyTOF) and has not become widely available for most researchers. We also do not discuss imaging flow cytometry (Amnis Corp.), which can capture fluorescent images of up to ten different colors on single cells moving in flow at high speed (for review see [12].
With thousands of fluorescent reagents available, advanced high-dimensional experiments using 40 colors have been performed successfully [14]. This chapter offers the end user a simple guide on how to plan and execute a high-dimensional fluorescent analysis experiment. First, we briefly describe the basic technology of traditional and spectral high-dimensional fluorescent analyzers. Second, we discuss the most common mistakes and misunderstandings of experiment setup and fluorescence spillover compensation. Once we clarify these mistakes, we explain how to design a high-dimensional fluorescent analysis panel. We provide a step-by-step guide on how to set up high-dimensional acquisition on a conventional flow analyzer as well as a general guide highlighting important differences in setup on a spectral flow cytometer. Further, more detailed discussion of the principles of high-dimensional flow analyses is available in recent reviews [4, 11].
2. Basic Aspects of Technology
2.1. Conventional Flow Cytometers
Here, we define conventional high-dimensional flow analyzers as instruments that detect photons of different wavelength (color) with individual photodetectors associated with specific optical filters. Most analyzers also use a photodiode to record forward light scatter. Photodetectors are highly sensitive to report photon count; however, due to the stochastic nature of the photoelectric effect, they are subject to photon-counting statistical errors. This error can be significant at the low end of the detection limit and also contributes to spillover spreading error during fluorescent compensation (see Subheading 3.7). The number of colors (parameters) distinguished by a high-dimensional flow analyzer is determined by the number of photodetectors and associated band pass filters. A major limitation of expanding colors in a traditional flow cytometer is the trade-off between the optical width of a narrow band pass filter and the diminishing number of photons that the detector can count. Most band pass filters are 20–50 nm wide which means that the maximum ~500 nm total spectrum of fluorescent light emission (350 nm–850 nm) can be divided among only 10–12 different detectors for the shorter wavelength (UV, violet and blue) lasers and even fewer for the longer wavelength (green, red) lasers. Conventional flow cytometers are equipped with 5–7 spatially separated lasers with adjustable laser power which theoretically raises discrimination power to a total of 40–50 colors. Most of these analyzers allow the user to change the PMT voltage or APD gain settings to increase/decrease detector sensitivity. While most users do not alter laser power, detector sensitivity is commonly and frequently incorrectly manipulated (see Subheading 3.1). These instruments offer automatic setup and quality control including establishment of correct laser delay which is critical for analyzers with spatially separated lasers. Currently BD Biosciences’ FAC-Symphony A5, Beckman Coulter’s Cytoflex LX, and Bio-Rad’s ZE5 (originally designed by Propel Labs) models are capable of more than 20-color traditional analysis. Of these manufacturers, BD Biosciences also offer the FACSymphony S6 cell sorter for more than 20-color cell-sorting applications.
2.2. Spectral Flow Cytometers
Spectral flow cytometry is based on real-time collection of photons across the entire spectrum for each fluorochrome instead of relying only on peak emission data [5]. Nonetheless, spectral analyzers still use PMT or APD photodetectors, usually arranged in a linear array of 10–32 detectors per lasers. Fluorescent light emitted from the target particle is split into multiple wavelength components through a light dispersion device and detected simultaneously with the PMT or diode arrays. The main challenge with multicolor spectral flow cytometry is spectral unmixing, i.e., the correct, quantitative identification of the fluorochromes that contribute to the overall spectrum of emitted light. Spectral analyzers can also measure and report cellular autofluorescence, an inherent and potentially useful characteristic of cells. While theoretically spectral flow cytometry offers nearly unlimited color discrimination, in practice it still depends on measurable differences in emission maxima which limits it to the discrimination of 40–50 colors. Improved spectral unmixing algorithms with faster computers may increase these numbers in the future. Currently Sony Biotechnology’s ID7000 and Cytek Biosciences’ Aurora models are capable of more than 20-color spectral analysis, and BD Biosciences are also beginning to offer spectral upgrade on their FACSymphony A5 models. Cytek’s Aurora CS and Thermo Fisher’s Bigfoot (originally designed by Propel Labs) sorters offer spectral cell sorting on more than 20-color panels.
3. Common Misunderstandings of Flow Cytometry Concepts
3.1. Autofluorescence Needs to Be Minimized
Most particles, including all live and fixed cells exhibit autofluorescence. Cells contain metabolic compounds that emit a variety of fluorescence in response to different wavelength of excitations, especially in the shorter UV, violet and blue laser light range. Autofluorescence is a characteristic property of cells and can potentially obscure weak fluorescent signals. Therefore, many users consider autofluorescence an inconvenience and wish to minimize it by reducing detector sensitivity to a very low level to make unstained/negative control cells appear with minimum background signals. This view is incorrect even if autofluorescence does cause potential difficulties. The adequate approach is to design the experiment such that the desired specific fluorescence can be well distinguished from background noise. On traditional flow cytometers, it is possible that certain fluorescent channels exhibit too high background in which case the reagent must be changed, typically to a green or red laser-excited fluorochrome, where the autofluorescence is acceptable for the given application. Detector sensitivity should be adjusted such that autofluorescence is clearly distinguished from the background noise of the detector (see Subheading 4.3). As a rule of thumb, detector sensitivity should be increased rather than decreased while keeping the brightest fluorochrome within the linear range of detection (see Subheading 4.3).
3.2. Isotype Control Staining Is the Best Negative Control
The specificity of antibody staining depends on the unique interaction of the antibody with its cognate epitope. Therefore, unrelated antibodies should not bind to cells, regardless of their isotype. Fc receptor-mediated, nonspecific binding can result in false positive signal which can be uncovered with the use of isotype-matched control staining. However, a better approach is to use Fc receptor blockade with commercial reagents every time there is a possibility of Fc receptor interactions. Once Fc receptor interactions are excluded, any positive signal with isotype control antibodies becomes uninterpretable and irrelevant to the analysis. Instead, for proper gating of low abundance or poorly characterized antigens, fluorescence minus one (FMO) controls should be used [10]. FMO controls also offer the most accurate assessment of false positive signals derived from fluorescent spillover spreading error (see Subheading 3.7) and allow setting the most accurate gate positions for weak staining signals in multicolor flow cytometry panels.
3.3. The More Fluorescent Reagent (Antibody) Is Used, the Better
Every fluorescent reagent should be used at an optimal and not higher concentration. This requires careful titration of the reagents ideally on the target cells of interest. Antibodies should be used at saturating, but not higher concentrations. Suboptimal concentration will reduce sensitivity, while supraoptimal concentration will increase nonspecific background signal which may also compromise sensitivity. The optimal concentration is determined by finding the best stain index value of the fluorescent reagent on its target cells (see Subheading 4.4). While titration of antibody staining is the most common practice, other exogenous fluorescent reagents, such as viability, cell proliferation, DNA-binding, and metabolic sensor dyes must also be titrated, since many of these reagents bind stoichiometrically to abundant cellular targets which results in extremely bright fluorescent signals.
3.4. Fluorescent Spillover Compensation Should Be Avoided
Fluorescent light emission is a stochastic event which produces variable wavelength photons. Light emitted from many fluorochromes results in spectral spillover into detector(s) other than the primary detector dedicated to that reagent, causing false positive signals. Spectral compensation is the arithmetic subtraction of this spillover signal to ensure that only the dedicated detector records signals higher than background autofluorescence. Spillover compensation can be avoided by using reagents with completely separate fluorescent emission spectra, but this limits the number of reagents to less than four or five at most. True high-dimensional flow analyses will inevitably require fluorochromes with overlapping emission spectra and therefore must include fluorescent spillover compensation.
3.5. Use of Stained Cells Versus Stained Compensation Beads
Both cells and commercially available compensation beads can be used for fluorescent spillover compensation. More importantly, cells and beads can be included in the same compensation setup. The objective with correct compensation is to determine the magnitude of spillover of fluorescent signal of a fluorochrome between its primary detector and any one of the other detectors. The main criterium is to identify and distinguish the true positive fluorescent signal from background autofluorescence. The absolute level of autofluorescence is not relevant, only the accurate measurement of specific fluorescence above background. Therefore, for each fluorochrome a mix of stained and unstained particles of the same type must be used. Whether cells or beads are used does not matter to spillover calculations. Relying only on cells carries several disadvantages: the experimental cells may be limiting; the positive fluorescent signal may be present only on a very small subset of the cells or present at very low levels, not clearly distinguishable from background. If the experimental cells express endogenous fluorescent signals (e.g., from fluorescent proteins), they cannot be used as compensation controls with different color reagents. In any of these situations, the use of compensation beads is strongly recommended. When using beads, it is important to keep in mind several factors. Only beads with the ability to bind the experimental fluorescent reagents should be used, not chemically colored beads with seemingly similar but invariably different spectral properties. Stained and unstained beads of similar numbers must be included (many commercial preparations offer premixed beads for this purpose). Compensation beads may bind reagents at much higher avidity than natural antigens do; therefore beads may appear brighter than the limit of linear detection range. In this case the reagent must be titrated separately on beads for compensation purposes and may need to be used at higher dilutions than in the experimental staining of cells. Finally, compensation beads usually bind only antibodies of certain species and isotypes; therefore some antibodies and most other fluorescent compounds may not be used with beads and will require the use of cells with distinct positive and negative populations.
3.6. Use of Similar, but Not Identical Fluorescent Reagents for Spillover Compensation
Many fluorescent non-antibody reagents, particularly endogenously expressed fluorescent proteins, may not be readily available as single-color control. While light emission of such reagents may colloquially be considered of a certain color (green, yellow, red); they cannot be replaced with similar color fluorescent compounds for compensation purposes. As explained above, if the exact experimental cells are not available, a different cell type expressing the same fluorescent protein may be used as long as positive and negative populations of that cell type can be distinguished. A related and often overlooked mistake arises when using antibodies conjugated with a tandem fluorescent dye. For base fluorescent dyes (e.g., FITC, PE, APC), the spectral emission should be generally similar enough between different preparations, or even manufacturers, such that they can be used interchangeably. Tandem dyes are covalent compounds of two fluorescent reagents where excitation of the base donor dye induces Förster fluorescence resonance energy transfer (FRET) to the acceptor dye. The emitted light will be a mix from the acceptor dye as well as some from the originally excited donor dye [7]. The efficiency of FRET in tandem dye antibody conjugates is unique and characteristic of the individual preparation. Therefore, another antibody conjugate, even with the same specificity, will likely emit significantly different combination of donor and acceptor dye-specific light which will result in incorrect measurement of spectral spillover and compensation. The use of the exact same preparation of tandem dye antibody conjugate is necessary to avoid this type of compensation error.
3.7. Understanding the Difference Between Fluorescent Spillover and Spectral Spreading Error
Fluorescent spillover is calculated with a relatively straightforward algorithm [15]. Theoretically, spillover can be predicted from the spectral properties of fluorochromes which is readily available from public “spectra viewer” websites. Initial staining panel designs placed the emphasis on the percentage values of fluorescent spillover. However, the biggest impact of spectral overlap on practical analysis derives from its effect of reduced sensitivity in spillover channels due to spectral spreading error. Spectral spreading is the consequence of photon-counting errors and errors introduced by logarithmic amplification of the PMT signals. The magnitude of this spreading error depends on the fluorochrome and the particular detectors used in the flow cytometer and must be determined empirically. Spreading error is proportional to the intensity of the fluorescent signal in the primary detector, even though the compensation value is independent of signal intensity within the linear range of detector sensitivity. Spreading error must be visualized in a biexponential display in order to properly assess correct compensation. A common mistake is to assume that compensation is wrong because of the appearance of elevated signal in the spillover channel, when in fact with proper display the symmetrical “butterfly” pattern of data distribution confirms correct compensation. Spreading error is real and unavoidable in multicolor flow cytometry and can impair detection of weaker signals in the spillover channels. This loss of sensitivity is a more critical factor in multicolor flow analysis than the mere percentage value of spectral spillover [13]. Spillover spreading error matrices (SSM) are now routinely calculated and published by instrument manufacturers and are essential tools in designing optimal staining panels (see Subheading 4.2).
3.8. Optimized Multicolor Immunofluorescent Panels
The journal Cytometry Part A in 2010 launched an ambitious project to collect peer-reviewed antibody staining protocols which would present extensively tested and optimized multicolor immunofluorescent panels (OMIP). To date 82 such panels have been published (Table 1). Though somewhat misleading, as four of the panels are for mass cytometry analyses, the majority have been designed for conventional fluorescent flow cytometers and in one case for spectral flow cytometers. Most of the panels are developed for the study of human hematopoietic, typically peripheral blood cell types, but nonhuman primate and rodent panels have been also published, and a few protocols deal with tumor cells and other non-hematopoietic cell types. Table 1 lists all published panels by number and categorizes them according to their species and predominant cell type subject. While it is unlikely that any single panel will match perfectly most researchers’ specific needs, they are very helpful tools to start building individual panels, especially for high-dimensional immunofluorescent analyses.
Table 1.
Summary of 82 OMIPs published to date. OMIPs are classified according to species and cell types
| Cell type | Human | NHP | Mouse/rat | Other |
|---|---|---|---|---|
| Immune phenotype | 012, 023, 024, 033, 034, 042, 058, 062, 063, 069*, 077, 078, | 032, 054, 076 | ||
| Peripheral T-cell differentiation | 001, 002, 009, 013, 017, 022, 030, 060, 067, 071, 080 | 016, 075 | 048, 079 | 065 (dog) |
| T cytokine and chemokine | 008, 014, 018, 025, 056, | 005, 052 | ||
| T regulatory | 004, 006, 015, 053 | |||
| T checkpoint | 036, 037, 050 | 031 | ||
| Thymocyte | 073 | |||
| NK cell | 007, 027, 029, 039, 064, 070 | 028, 035 | ||
| gdT-cell, iNKT, MAIT | 019, 020, 021, 046, 082 | 057 | ||
| ILC | 055, 066 | |||
| B cell | 003, 043, 047, 051, 068, 074 | 026 | ||
| Myeloid | 038, 044 | 041, 061 | ||
| Hematopoiesis | 049, | 059 | ||
| Leukemia Lymphoma | 010, 072, 081 | |||
| Other | 011 (endothelial cells), 040 (prostate cells), 045(HNC) |
All OMIPS are designed on conventional flow cytometers, except those marked in red (mass cytometers) and with asterisk (spectral flow cytometers). Italicized OMIPs represent more than 20-color high-dimensional panels
ILC innate lymphoid cells, HNC head and neck cancer cells, NK natural killer cells, MAIT mucosal-associated invariant T cells
4. Step-by-Step Guide of Creating a High-Dimensional Flow Cytometry Experiment on a Conventional Flow Cytometer
4.1. Hypothesis
Designing a high-dimensional flow cytometry experiment is principally not different from designing any other scientific experiment which tests a defined hypothesis. Once it is established that high-dimensional flow cytometry is needed to test the hypothesis, one can follow a simple flow chart (Fig. 1). It is important to define the target cell populations (e.g., lymphocytes, myeloid cells, tumor cells) and their phenotype (e.g., naïve, memory, regulatory) as identified by well-characterized markers. It is also important to establish a list of unknown or poorly defined markers (e.g., rare antigens, novel antibodies, or other fluorescent reagents). Finally, rank marker expression levels and patterns based on data from published reports or technical data sheets from manufacturers.
Fig. 1.
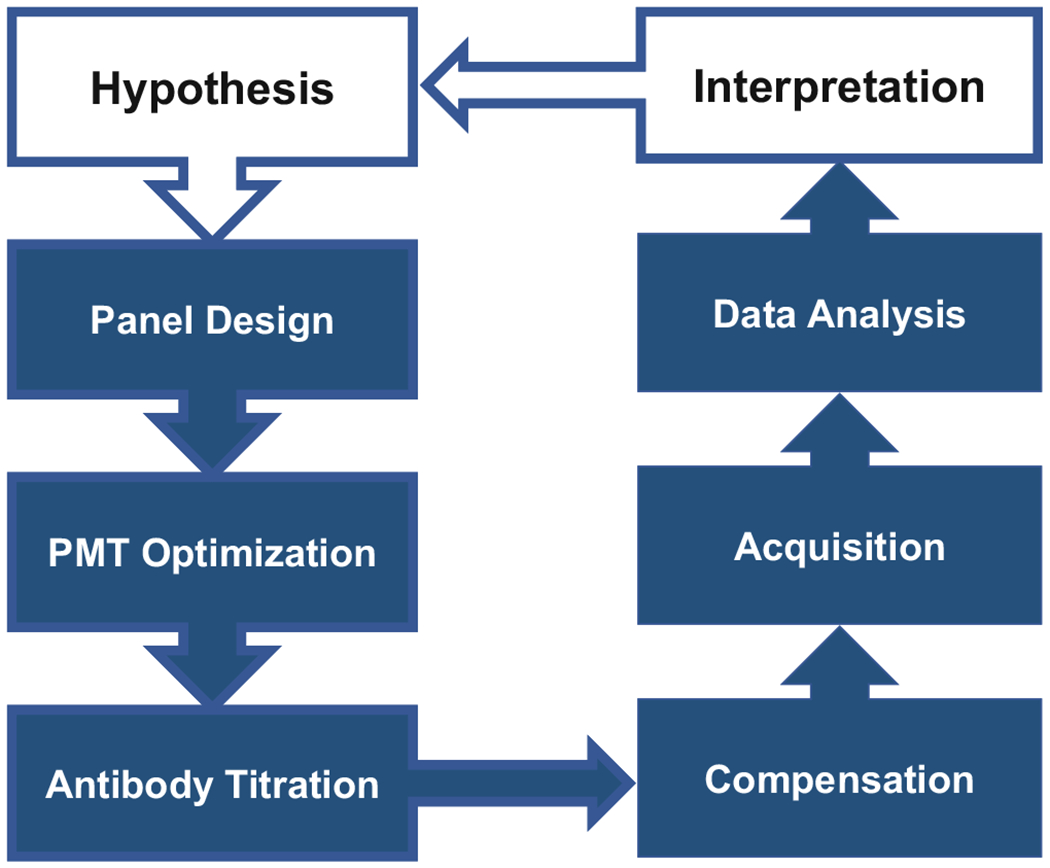
Flow chart of preparing high-dimensional fluorescent flow cytometry experiment. Individual steps shown in the chart are discussed in the text in Subheadings 4 and 5
Materials
Biological hypothesis.
List of cellular targets, expression pattern, and levels.
Methods
Make a list of target antigens that is relevant to biological hypothesis (e.g., CD19 B cells, CD3 T cells, Ly6G neutrophils, CD11c dendritic cells, CD56 NK cells).
Identify all co-expressing markers relevant to the experiment (e.g., CD45 on all hematopoietic cells, CD326 on all epithelial cells).
List all antigens of interest.
Categorize antigen expression patterns as bimodal, continuous, or unknown using published literature or manufacturer’s data.
Categorize antigen expression levels as low, medium, or high using published literature or manufacturer’s data. Note that for certain antigens (e.g., CD25), different antibody clones may produce different levels of signals.
4.2. Panel Design
Multicolor flow cytometry panel design depends on laser and detector configuration of the available flow cytometer. These days most high-end instruments are custom-designed; therefore one cannot rely solely on generic manufacturer’s information. Once instrument configuration is determined, a list of usable fluorochromes can be created. Several online panel design algorithms, some free others for fee (e.g., FluoroFinder, Chromocyte, BD Biosciences, Biolegend, ThermoFisher, etc.), are available to assist even experienced users. Generic commercial sources like Fluoro-Finder provide a comprehensive database of reagents, while company websites are likely to limit choices to their own products only.
The main purpose of panel design is to establish the optimum combination of fluorescent reagents to identify every desired target (see Subheading 3.8 OMIP and Table 1). The main impediment to this goal is fluorescent spectral spillover which reduces detector sensitivity (see Subheading 3.7). Efficient panel design must take into account the instrument-specific spillover spreading error matrix (SSM) [13]. Such matrices are now becoming available from the manufacturers, though for ultimate precision, they can be established also by the user or Core facility of the given instrument. Understanding SSM is critical to match fluorochromes properly with markers based on expression pattern (see Subheading 4.1). Multiple markers co-expressed on the same cell type (e.g., CD4, CD127, CD62L) must be stained with antibody conjugates that produce lower spillover spread. Conversely, fluorochrome combinations with the highest spillover spread should be reserved to markers uniquely expressed on different cell types (e.g., CD4 and CD8 on peripheral, but not thymic, T cells, or CD3 and CD19 on lymphocytes).
Fluorochromes exhibit a wide range of brightness which can be assessed through commercially available fluorochrome stain index values. Once the expression level of target antigens is established (see Subheading 4.1), the antigen can be matched with the fluorescent brightness of available antibody conjugates. To create a balanced staining panel, one should match high-expression markers with lower brightness fluorochromes and low-expression markers with higher brightness fluorochromes.
Materials
Flow cytometer configuration (instrument-specific).
Spillover spread matrix SSM values (commercial or instrument-specific).
Target marker expression data.
Target marker co-expression data.
Fluorochrome brightness index values.
Comprehensive fluorochrome spectral database (“spectra viewer”).
Methods
Assign brightest fluorochromes to low-expression markers, e.g., BB515, PE, APC.
Assign dim fluorochromes to high-expression markers, e.g., PacBlue, Alexa Fluor700.
Assign pan-marker to lowest spillover detector, e.g., CD45 to BUV395.
Assign unique marker to high spillover detector, e.g., PECy5 or PerCpCy5.5.
Assign co-expression markers to different lasers or at least to fluorochromes with the lowest SSM values.
Consider the effect of spillover from high-expression marker to detectors with low sensitivity. For example, CD45 with PerCp-Cy5.5 will reduce resolution of other hematopoietic markers in all related spillover channels.
If a single or mixed cocktail of lineage markers are used to exclude large number of cells, assign this “dump channel” to a fluorochrome with high brightness and high spillover values, e.g., PECy5, since the positively stained events will be ignored in the analysis.
Reserve live-dead stain for less accessible fluorescent channels (e.g., fixable UV or near IR live-dead) since many commercial antibodies do not use these channels.
Use new, improved tandem dye conjugates and protect tandem dyes from light-induced or chemical degradation.
4.3. PMT Voltage Optimization
The purpose of PMT voltage optimization is to establish the optimum sensitivity of a flow cytometer for a given analytical experiment. Every cell exhibits certain autofluorescence (see Subheading 3.1). In addition, every detector is characterized by an inherent limit of sensitivity due to electrical noise. The goal is to ensure that in every detector channel, autofluorescence of unstained cells is clearly detected above this limit of sensitivity. This may seem counterintuitive (see Subheading 3.1), but if we want to distinguish a potentially weak fluorescent signal from background autofluorescence, the minimum criterium is to be able to distinguish autofluorescence from detector noise. Note that this section refers to conventional flow cytometers with PMT detectors. Instruments with high dynamic range APD may not offer detector-specific adjustments. Spectral flow cytometers may also be optimized, but for those instruments, voltage adjustments are typically done on entire arrays of laser-associated detectors, and optimization is more concerned with balanced PMT settings to allow the use of universal spectral libraries (see Subheading 5.3).
There are various methods to optimize PMT voltage starting from simplest (keeping unstained cells in first or second log of fluorescence) to the most sophisticated laser pulser applications. Keeping unstained cells arbitrarily at low fluorescent channel values is the least reliable method and may result in loss of resolution of negative cells from dimly positive cells. Arbitrary increase in PMT voltage also could result in high fluorescent signals to go off the scale and increase spectral spillover spread. Another easy method for PMT optimization is based on fluorescent quality control beads. BD Biosciences instruments use Cytometer Setup and Tracking (CST) beads for this purpose. These are mixed beads with three levels of low, medium, and high fluorescent signal in each detector. A proprietary CST software automatically finds the optimum PMT voltage for each detector with maximum-resolution sensitivity to separate the three signals. The disadvantage of using bead-optimized PMT voltage values is that cells frequently show autofluorescence very different from beads. Another approach, called voltration, records fluorescent signals at incremental increase of PMT voltage from minimum to highest level using antibodies of interest on the target cells. Finally, dedicated laser pulser equipment, such as QuantiFlash™ can monitor PMT performance to utmost accuracy. However, these methods are very time-consuming or require specialized instrumentation and not discussed here further.
The approach described below is based on setting PMT voltage of unstained cells to 2.5–3.0 times over the robust standard deviation (rSD) of background electronic noise of a detector. Although the 2.5–3.0 factor is arbitrary, the electronic noise is determined objectively and highly specific for the instrument. The method here is developed for BD Biosciences conventional flow analyzers (LSRFortessa or FACSymphony) and uses information obtained during initial CST baseline setup with the CST software. The method is medium time-consuming, but once the optimum PMT voltages are established, they can be reused for multiple experiments. Although CST baseline values may change in approximately every 6 months, the BD FACSDiva™ software Application Setting function allows users to save and transfer their optimized PMT voltages to the new settings without having to perform the optimization again. The benefits of using optimized PMT voltages compared to data obtained without optimization in terms of improved signal resolution are shown in Fig. 2.
Fig. 2.
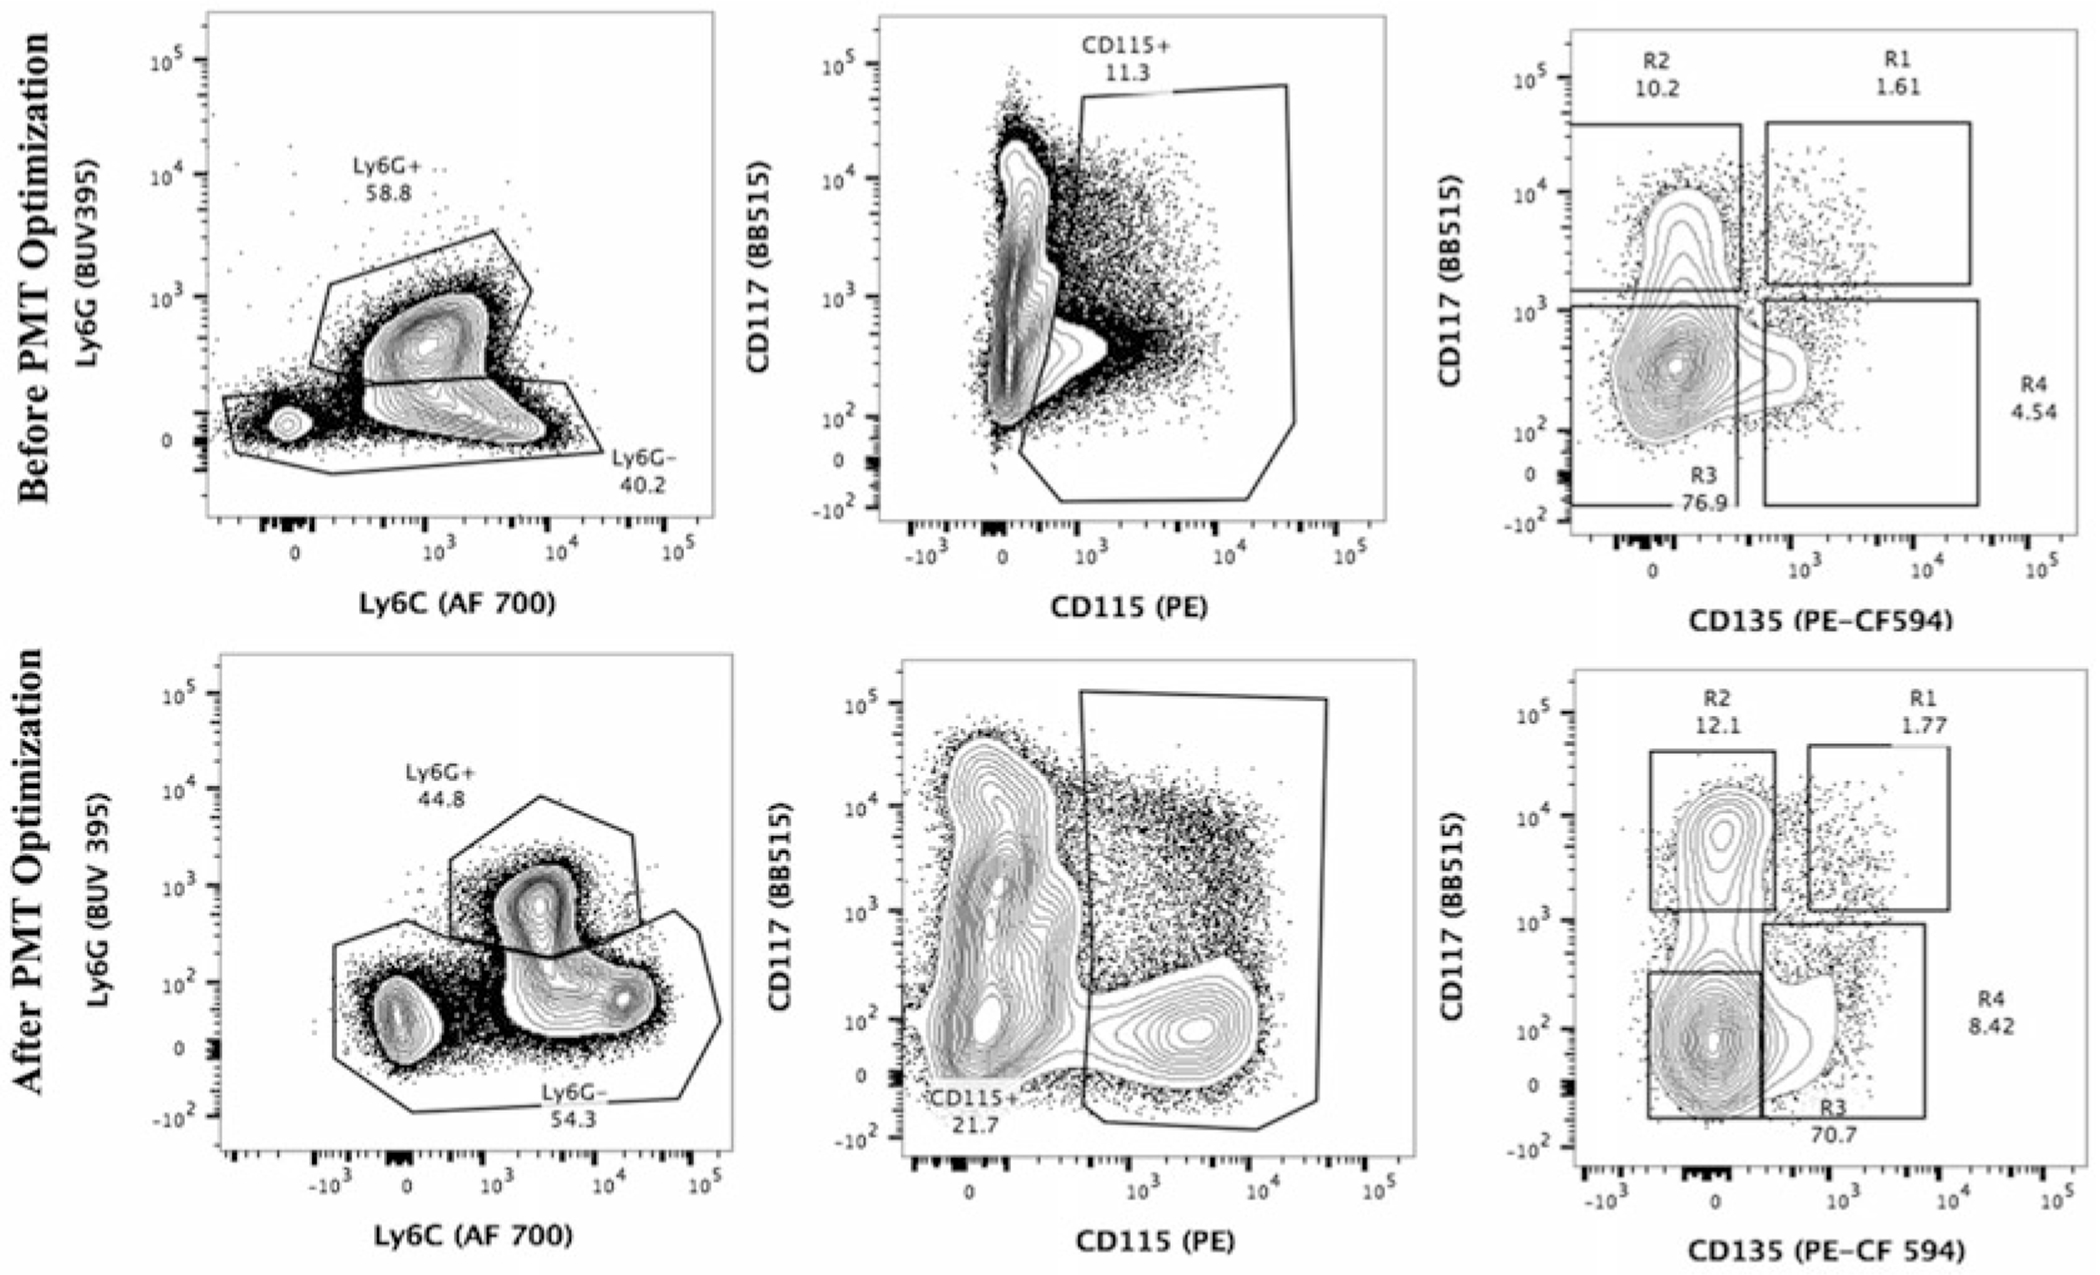
Example of PMT voltage optimization and its effect on data resolution. A 15-color immunophenotypic panel is used to analyze different populations of myeloid cells from mouse bone marrow. Selected plots are shown before (top) and after (bottom) PMT voltage optimization. Note the significant improvement in resolution of CD115-positive cells after PMT optimization (middle panel)
Materials
BD Biosciences flow cytometer, e.g., LSRFortessa or FAC-Symphony instrument.
Values of electronic noise rSD and linearity max channel information from CST baseline report (see example in Fig. 3).
Unstained cells suspended in relatively large volume (~2 ml) from same tissue which is to be used in experiment.
FACS staining buffer: 1× HBSS buffer, 10 mM HEPES buffer, 2 mM EDTA, and 2% fetal bovine serum (pH 7.2).
Plasticware, such as 5 ml FACS™ tubes or 96 well plates.
Fig. 3.
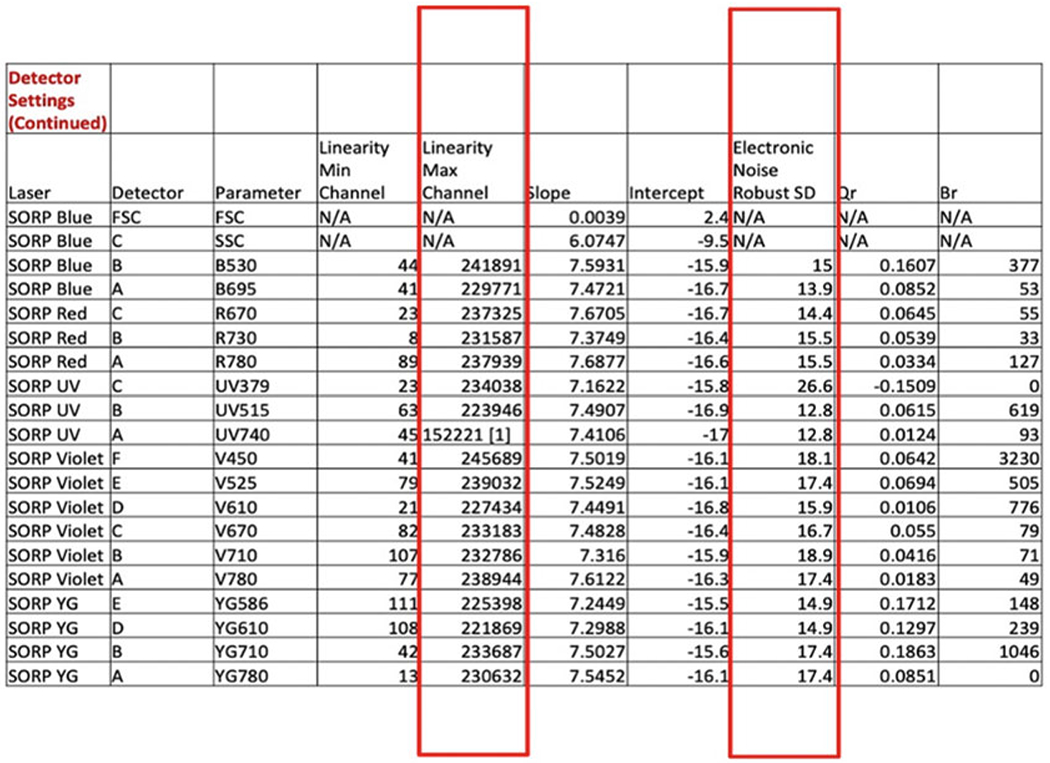
Example of a baseline report from a BD LSRFortessa 18-color flow analyzer. Baseline report measures various parameters, among them electronic noise robust standard deviation (rSD) and the linearity maximum channel. These two parameters are used to optimize PMT voltages in each detector. See further details in text
Methods
User should find performance report in BD Cytometer Setup and Tracking (CST) software and note the cytometer baseline date. Click onto the CST report tab within CST performance tracking window to find various baseline reports with corresponding dates. Click on the baseline date of the CST performance report, export this as CSV file, and convert to MS Excel sheet for further calculations. In the converted MS Excel sheet, look for second table within detector settings containing electronic noise and maximum linearity channel information, which is used for target rSD value calculation (Fig. 3).
-
Calculate 2.5–3 times the value of rSD for each of the detectors as measured in the latest CST baseline and record in Excel sheet in a separate column (Fig. 4).
Optional: Copy maximum linear channel values for each of the detectors in a separate column. The maximum linear value is not needed unless you expect a signal to go out of the linear range in certain experimental condition. In that case, only that high-expression marker maximum linear range can be calculated using stained sample.
Print this sheet such that each detector is arranged in the same order as they appear in the report from the given BD Biosciences instrument (Fig. 4).
Create a New Experiment in FACSDiva™ software, and rename as Application Setting with information for cell type and date. Apply the current CST settings to the experiment. This will be indicated by a blue ball symbol in Cytometer settings within the experiment.
Make a new tube in the Application Setting experiment, and leave all the fluorescent parameters channels open with height and width parameters active only for FSC and SSC. Leaving all the fluorescent channels open is useful even if using fewer colors due to possible future need of expansion of the panel.
Create histogram plot for all the fluorescent channels which are gated on single cells after removal of cell debris using FSC and SSC parameters.
Create statistical view for each channel with rSD values displayed. Using text tool, type the target rSD value for each channel as reference below the statistical window.
Acquire the unstained cells and record minimum of 5000 cells within the singlet gate. Make a note of how far off each calculated value are with respect to the target rSD value. The values will be likely off because the original PMT voltages were determined by CST using beads not the desired target cells.
Check the value of rSD, and adjust PMT voltage by increasing or decreasing it to achieve the target rSD. Record the change of PMT voltage after each tube on the printed Excel sheet (Fig. 5). Repeat steps 7 and 8 until the desired target rSD for each fluorescent parameter is achieved. Figure 5 shows up to seven steps for possible PMT voltage changes, but user may be able to achieve target value in less or more than seven steps. Once the target value is achieved in the respective detector, the user should mark the detector with a remark on the printed table and continue to change PMT voltages only in the remaining detectors to achieve their target rSD values (Fig. 5).
Optional: If you have one or more unusually high-expression marker, record maximum linear channel value using marker specific stained cells. If maximum linear channel value is outside the linear range of the histogram, then must decrease the PMT voltages even if the rSD value falls below the desired target value.
Once Application Settings are saved, they can be used also as a starting point for a different cell type in a new experiment by recording new unstained cells and adjusting PMT voltages until target values are achieved for the new cell type. Save these new cell specific PMT settings as a new Application Settings.
These Application Settings values are valid as long as the instrument is using the same baseline specific to a CST bead lot. However, when the CST baseline changes, the target values from the old bead lot must be transferred to the new bead lot to allow the previous Application Settings to function with the new baseline. This is typically done by the custodian or Core facility staff of the instrument.
Fig. 4.
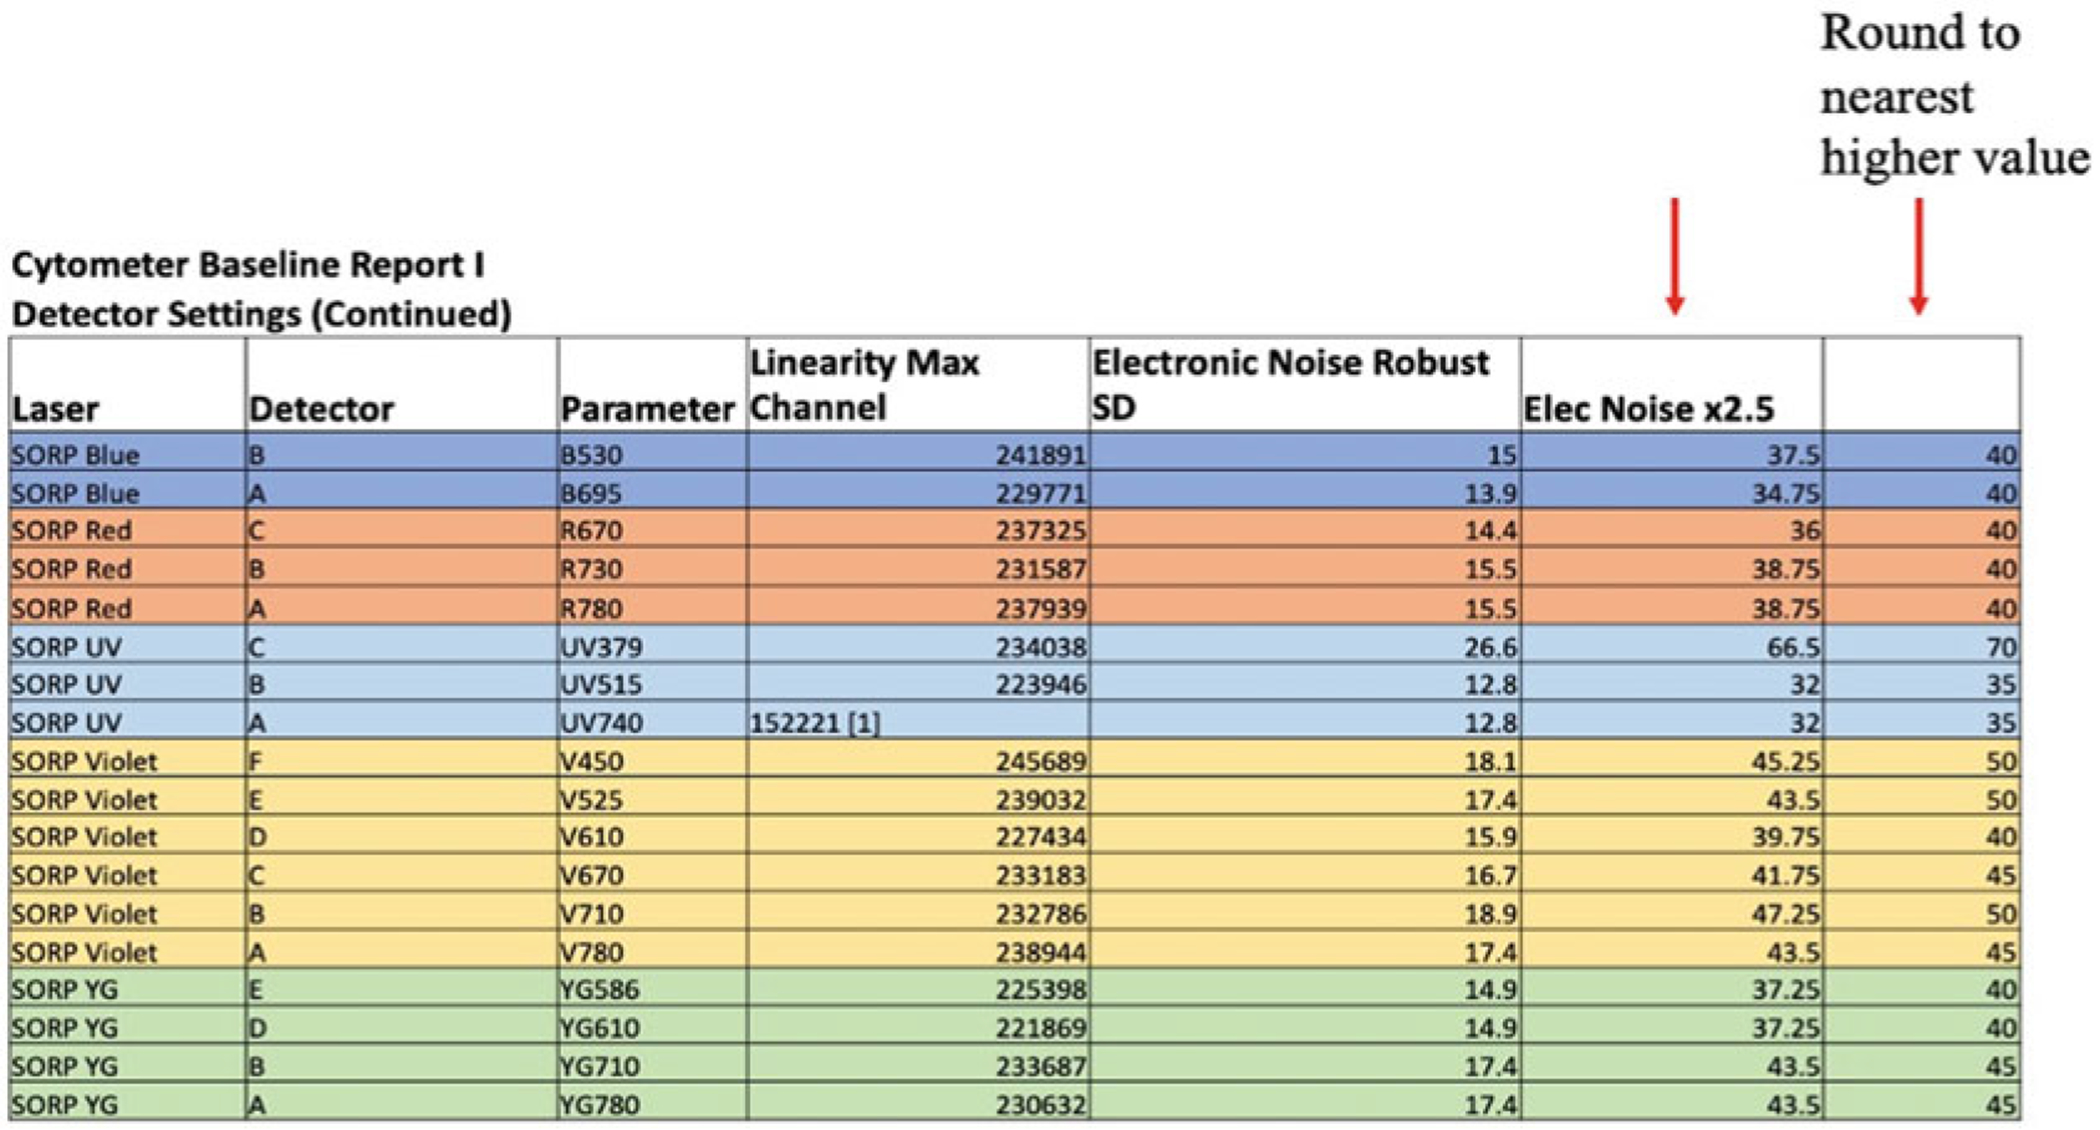
Worksheet using cytometer CST baseline report. After copying rSD and linearity max channel values to a MSExcel sheet, the 2.5 times of rSD value is calculated and rounded up to the nearest value. See further details in text
Fig. 5.
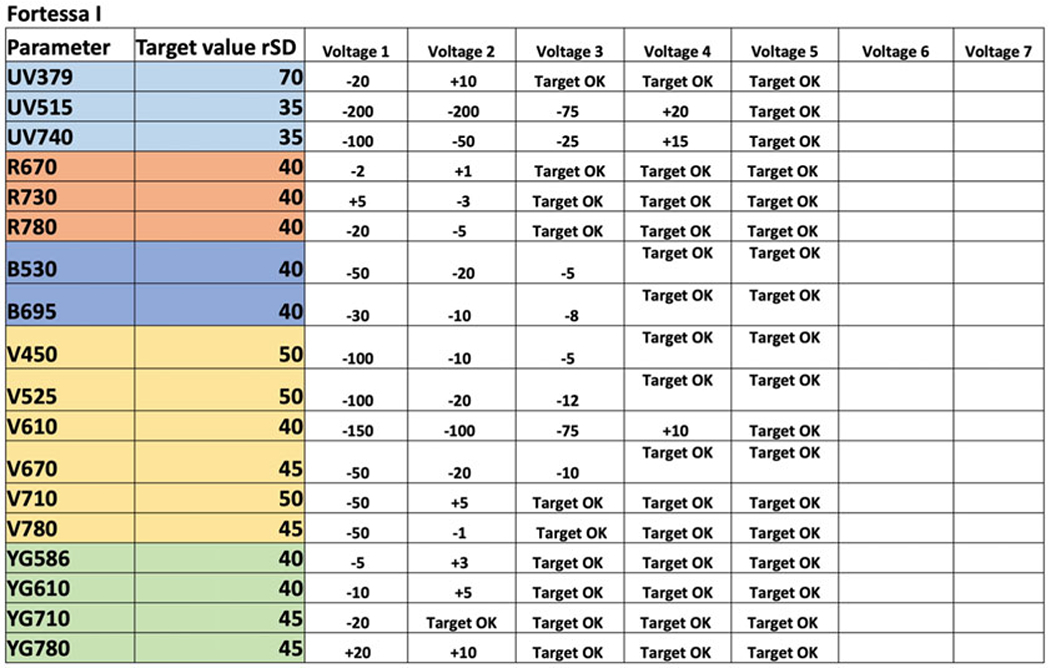
Example of worksheet used for PMT optimization. Target rSD values and PMT voltage changes are shown during each of five rounds of optimization steps. These steps are repeated until desired target values are reached. At every round, when a target value is reached, the detector is marked as “Target OK.” In this example all detectors are optimized in five rounds, but users may need more or less steps to complete PMT voltage optimization. See further details in text
4.4. Antibody Titration
Titration of antibodies is one of the important criteria to get the best resolution and reproducibility in flow cytometry data. Titration calculates the optimal amount of antibody required to get the best discrimination between stained and unstained cells. Addition of suboptimal level of antibody results in lesser separation of positive and negative cells which can be particularly significant in channels where high SSM values already compromise detector sensitivity (see Subheading 4.2). Addition of too much antibody may also result in decreased resolution by increasing background signals on negative cells. In a typical titration experiment, twofold dilution for each antibody is recommended for up to six times.
Materials
Flow cytometer with PMT voltages optimized to target cells saved in Application Setting.
Fluorochrome conjugated antibodies and Fc receptor blocking regent appropriate to the species-specific cell type.
Fixable live-dead reagent.
PBS or HBSS.
FACS staining buffer: 1 × HBSS buffer, 10 mM HEPES buffer, 2 mM EDTA, and 2% fetal bovine serum (pH 7.2).
Fixation/permeabilization reagent for intracellular targets.
Plasticware, such as 5 mL FACS™ tubes or 96 well plates.
Methods
Titration should be done at the same conditions as the experiment but with only one antibody per reaction to minimize spectral spillover-related artifacts.
Perform antibody titration in 96 well U or V bottom plate to ensure consistent washing and uniform suspension. It also facilitates ease of mixing using multichannel pipette to minimize well-to-well variation.
Prepare appropriate amount of stain buffer in a larger tube, and add Fc block at the concentration recommended by the manufacturer.
Add 98ul Fc block-containing staining buffer to first empty well of all the columns where you need to run individual antibody titration. In case of running 12 different antibody titration, first row of 96 well plate will get 98ul volume.
Add 50 uL of remaining volume along each column from well position 2–8.
Add 2 uL of stock containing 4 ug of antibody from original company vial to first well of each column. If the antibody concentration of stock is different, adjust the volume accordingly to achieve 4 ug antibody per well in total volume of 100 ul. Mix thoroughly using multichannel pipette and transfer 50 ul from well 1 to well 2 along the column length. Mix well, and then transfer 50 ul to next well and so on until the last well number 8. Discard 50 ul volume after mixing from last well.
Transfer and mix cell suspension in each well in 50 ul FACS buffer with approximate concentration of 5 × 10⁵ – 1× 10⁶ cells per well.
Incubate cells at room temperature for 20 min in dark followed by adding 100 ul FACS buffer to each well. Centrifuge the plate at 400–500 g for 5 minutes. Flick the supernatant from the plate very carefully in one swift motion over the waste sink, and wick the plate by placing the top of plate upside down on stack of paper towels very carefully.
Repeat this step once more to wash the cells using 200 ul of FACS buffer per well.
Optional: If expecting to have large number of dead cells, then fixable live-dead staining is recommended as per instructions provided with the reagent. Live cells can be gated during acquisition using unstained cells without the use of any fluorescent spillover problem.
Optional: Add 100 ul of 2–4% paraformaldehyde fixative to each well, and incubate for 15 min at room temperature followed by washing as described in steps 9 and 10. Finally, resuspend the cells in 200 ul FACS buffer, and store plate at 4 °C in the dark or proceed to next step.
Acquire all the cells on PMT optimized flow cytometer (see Subheading 4.3.). It is important to record completely unstained cells as well to assess background autofluorescence.
Analyze the data on a flow cytometry data analysis software, e.g., FlowJo.
For every marker, identify positive and negative peaks on histogram plot after gating out cell debris and aggregates.
-
Calculate MFI (mean fluorescence intensity) of positive and negative peaks. Include rSD calculation as well for negative peak. The stain index (SI) formula can be linked in the software to be automatically calculated for each antibody.
Stain index (SI) = MFI (positive peak) – MFI (negative peak)/(2× rSD of negative peak)
Plot the calculated SI value against different dilutions of the antibody.
The highest SI value with lowest dilution is the optimum saturating concentration of an antibody for the tested cell type.
Record the optimum antibody dilution information on a spreadsheet containing all the relevant information, e.g., antibody clone, lot number, and antigen target.
4.5. Compensation Optimization
Compensation is a mathematical calculation of spectral spillover between overlapping fluorescence emission (see Subheading 3.1). Since spectral spillover is unavoidable in high-dimensional flow cytometry, accurate compensation must be calculated in order to obtain accurate data. It is a good idea to dry-run compensation before running full experiment to rule out any potential problems. Compensation may be performed using either stained cells or beads and can even be done using a combination of beads and cells as long as the same type of particle used for both negative and positive signals in a given fluorochrome (see Subheading 3.5). Compensation beads bind antibodies through Fc receptor and typically produce much higher signals than stained cells; therefore compensation beads require separate titration to higher dilutions. The fluorescent molecules must be the same type as the experimental fluorescent molecules. For instance, FITC may not be used as a substitute for GFP as a compensation control. In case of tandem dye conjugates, which typically exhibit lot specific variation in quantum efficiency of FRET, the compensation controls should use the exact same antibodies that are used in the experiment.
Materials
Flow cytometer with PMT voltages optimized to target cells saved in Application Setting.
Fluorochrome conjugated antibody-stained cells.
Optional: Fluorochrome conjugated antibody-stained beads.
Unstained cells or unstained beads which are used as universal negative control.
Optional: Mixture of unstained and stained cells or unstained and stained beads.
PBS or HBSS.
FACS staining buffer: 1× HBSS buffer, 10 mM HEPES buffer, 2 mM EDTA, and 2% fetal bovine serum (pH 7.2).
Fixation/permeabilization reagent for intracellular targets.
Plasticware, such as 5 ml FACS™ tubes.
Methods
Use single-color compensation controls with equal or brighter signal than any of the experimental sample but within linear range of the detector.
Positive and negative signal in compensation control should derive from the same type of particles exhibiting the same level of autofluorescence.
The compensation controls should receive same treatment as the experimental samples. Temperature, light, time, and type of fixative may influence emission property of tandem dyes which will affect compensation calculation.
Acquire briefly, but do not record, a fully stained experimental sample and visually verify that there are no off-scale events in any detector. If antibody titration and PMT optimization were performed correctly, this should not happen. Nonetheless, if off-scale events are seen, the PMT voltage must be lowered until half the value of the max linear channel value of that detector.
Acquire minimum 5000 unstained control events if using a universal negative control.
Acquire minimum 5000 single-color-stained control events. The default recording number of events in FACSDiva™ software is set to 5000, but in case fewer positive events are present, more total events should be collected until at least 200 positive events are recorded.
Optional: Acquire minimum 5000 single-color-stained control events mixed with unstained controls. The default recording number of events in FACSDiva™ software is set to 5000, but in case fewer positive or negative events are available, more total events should be collected until at least 200 events of the lowest population are recorded.
Check every single-color control for spillover issues by monitoring the peak fluorescence on histograms in every channel. If a single-color control shows fluorescent signal in a secondary detector channel which is higher than in its primary detector channel, then the PMT voltage of the primary detector may need to be increased to balance spectral spillover. Decreasing PMT voltage in the secondary, “spillover” channel may compromise resolution of the positive population with that fluoro-chrome. If fluorescence is higher in the secondary channel than in the primary channel, the algorithm will return more than 100% compensation value. This, in itself, does not invalidate the compensation matrix, and, at any rate, spillover spreading error is always a bigger concern than the numerical value of compensation (see Subheading 3.7).
4.6. Data Acquisition and Analysis
It is not uncommon that after weeks of panel design and instrument optimization and following acquisition of more than 20 control tubes, collecting the few actual experimental samples takes the least amount of time. It is a mistake, however, to think that such disproportionate use of time in preparations is a flaw of the experiment. For one, it is possible that the experiment overall took even longer time with long period of immunizations or tumor inoculations in live animal studies. Experimental samples may be sparse and hard to replace. But most importantly, the amount of information gained from high-dimensional flow experiments is in logarithmic relationship to the number of parameters used. High-dimensional experiments do not simply save target cells (which may be useful) or reduce reagents and labware waste (which is probably minimal), but provide novel insight into cellular phenotype that cannot be gained through multiplying the number of smaller, separate staining panels. High-dimensional experiments also propagate technical and statistical errors, most notably through spectral spillover spread and compensation artifacts. For further details on high-dimensional data analysis, we refer the reader to [9] and references therein. Unlike flow analyses with a few, spectrally well-separated antibody conjugates where even considerable mistakes can be manually corrected, high-dimensional flow data analysis is not amenable to manual corrections. This problem is further exacerbated by the rapid assimilation of dimensionality reduction algorithms (tSNE, UMAP, FLOWSOM) that promise simple visual interpretation of complex data (Fig. 7). Many of these algorithms are highly susceptible to seemingly minor errors in raw data that remain undetectable once the original quality control is bypassed or ignored. The result is irreproducible, frequently misleading conclusion which could be rectified only with the outmost care in the design, preparation, and execution of high-dimensional flow cytometry analyses.
Fig. 7.
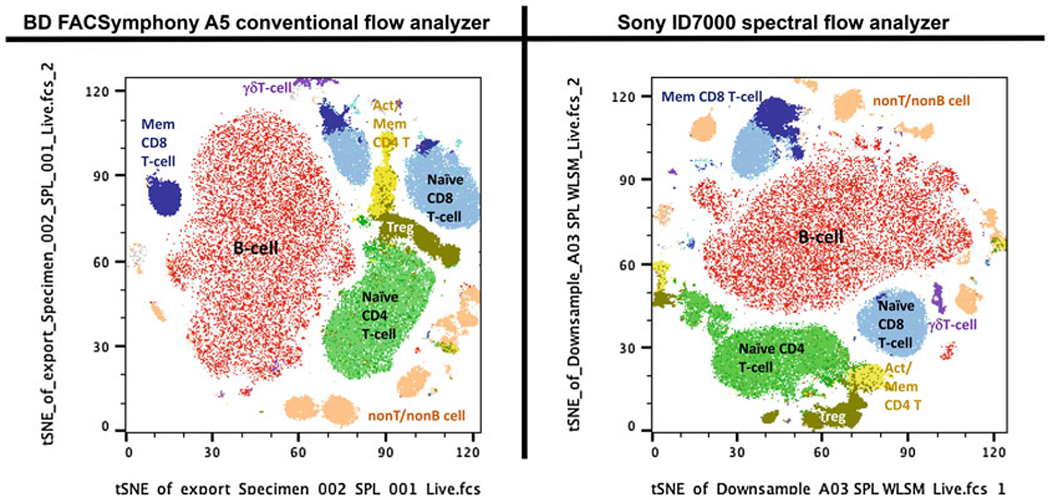
Comparison of tSNE plots of a 19-color high-dimensional flow cytometry panel. The same data files as shown in Fig. 6 are analyzed using t-distributed stochastic neighbor embedding (tSNE) algorithm of FlowJo v10.8.1. Each file was analyzed after downsampling to 50,000 live cells and using 500 iterations with perplexity settings of 30. Several cell populations, as identified in Fig. 6, are mapped onto tSNE islands and shown in different colors
5. General Principles of Creating a High-Dimensional Flow Cytometry Experiment on a Spectral Flow Cytometer
High-dimensional flow cytometry analysis is similar on a spectral flow analyzer. Spectral flow cytometry promises to distinguish even more fluorescent colors than conventional analyzers because of their ability to discriminate between spectrally very closely related fluorescent reagents using not only peak emission but full emitted spectral information (see Subheading 2.2). However, the main limitation, spectral spillover, remains a challenge. Recent introduction of commercial, spatially separated, five to seven laser spectral flow analyzers (ID7000 from Sony Biotechnology, Inc., and Aurora from Cytek Biosciences) have the capability of simultaneously analyzing 40 or more fluorescent colors [14]. Here, we briefly summarize the steps of setting up the Sony ID7000 spectral flow analyzer for high-dimensional flow cytometry experiment, highlighting only the differences compared to the procedure detailed above for conventional flow cytometers (see Subheading 4 above).
5.1. Hypothesis
Designing a high-dimensional flow cytometry experiment for a spectral analyzer is similar to conventional flow cytometers. One main difference is the possibility to use highly similar peak emission fluorochromes simultaneously in spectral analyzers. Unlike conventional instruments, spectral analyzers use many more detectors (up to 144 in the Sony ID7000) which allows them to potentially discriminate very narrow differences in peak emissions. Theoretically, it is possible to incorporate highly similar emission reagents into a spectral analyzer panel. In our experience, however, the practical benefits of such discrimination are modest with the magnitude of fluorescent spillover and associated spreading error so high that such reagent combinations will work only in special occasions.
5.2. Panel Design
Multicolor flow cytometry panel design for spectral flow cytometers should follow the guide outlined for conventional analyzers (see Subheading 4.2). The main difference is that, as explained above, theoretically very similar emission peak reagents may be incorporated into one panel. For example, in an experimental tumor model using GFP-marked tumor cells, it may be feasible to use a FITC-labeled antibody to distinguish tumor-infiltrating lymphocytes from the tumor cells. Still, the compensation-associated distortion due to the very high fluorescent spillover will make the appearance of the cells of interest (lymphocytes) look odd on plots where the FITC parameter is displayed. Both Sony and Cytek spectral analyzers have demonstrated the possible use of close peak emission combinations of GFP and FITC, Alexa 488 and FITC, Alexa 647 and APC, or Pacific Blue and BV421. In no instances should these combinations be used with markers present on the same target cells.
5.3. PMT Voltage Optimization
The Sony ID7000 uses up to 144 PMT detectors, whereas the Cytek Aurora uses up to 50 APD detectors to record spectral emission. Because of the high number of detectors, it becomes impractical to adjust individual detector sensitivity, though both instruments allow it in advanced operations. Instead, the sensitivity of the array of detectors linked to a given laser is adjusted globally. An important difference from conventional cytometers is that traditional PMT sensitivity optimization, as described above in Subheading 4.3, is not performed on spectral analyzers. This is because autofluorescence can be used as an independent parameter on spectral analyzers, and the software allows it to be subtracted from the specific fluorescent signals. Therefore, PMT optimization focuses primarily on keeping the fluorescent signals of fully stained samples below the maximum linear detection limit in every channel. Spectral analyzers allow the user to view fluorescent signals in all detectors in real time with a spectral ribbon viewer. Using this tool, it is possible to adjust the detector array sensitivity (PMT voltage or APD gain) such that no signal exceeds the maximum linearity of any detector channel.
5.4. Antibody Titration
Titration of antibodies should follow the exact same steps as described in Subheading 4.4. Given the significant differences from conventional instruments, optimal antibody concentrations must be reestablished for spectral analyzers. Since detector sensitivity is adjusted globally for each laser, it is even more critical to determine the optimum reagent concentrations and ensure that none of them exceed the maximum linearity limits on a given laser.
5.5. Compensation with Spectral Unmixing
Compensation for spectral spillover is measured and calculated in a fundamentally different way on spectral analyzers than on conventional flow cytometers. The emission spectrum for every single fluorochrome is recorded and stored in a spectral library. When a fully stained sample is measured, the net fluorescence will be the sum of emissions of all fluorochromes used in the experiment. To determine the exact contribution of each reagent to the net signal, a complex fluorescent spectral unmixing algorithm is applied, which in case of the Sony ID7000 instrument uses the weighted least square method (WLSM). Several key points must be emphasized:
Spectral compensation using spectral unmixing algorithms still relies on clean, single-color positive controls where the specific signal is derived exclusively from one fluorochrome.
Autofluorescent background is recorded for cells or beads and used to distinguish negative and positive signals just as in compensation on conventional analyzers.
For base fluorochromes, which do not rely on FRET, specific positive fluorescent signals are recorded and stored in a spectral library that can be reused in multiple experiments if the proportion of PMT voltage (or APD gain) values remain the same across all lasers. The key assumption here is that the shape of a fluorescent spectrum does not change as long as the relative sensitivity of all detectors remains the same. Unfortunately, the correlation between the voltage values of PMT arrays associated with the different lasers is not perfectly linear. One way to ensure such proportionality in the Sony ID7000 instrument is to record maximum peak fluorescent signals for the brightest fluorochromes for each laser at a given PMT setting and then adjust the PMT voltage for each laser-associated array every time one of the PMT voltages is changed. This is a complicated procedure and is best left to be performed by trained instrument engineers or Core facility personnel. Once the correct PMT voltage proportions are established, they can be reused in a wide range of experimental conditions.
For tandem dye conjugates, we still recommend running compensation controls every time due to the highly specific nature of FRET emission of these reagents (see Subheading 3.6).
Spectral unmixing improves the accuracy of spectral compensation. The more data points are collected (i.e., the more detectors and lasers are employed), the more accurate the calculation will be. In fact, advanced flow data analysis software, like FlowJo, offer the option of calculating spectral compensation matrices based on conventional flow cytometry data as long as a large number of detectors were used to record the compensation files.
5.6. Data Acquisition and Analysis
Data acquisition and analysis follow the same principles with spectral flow cytometers as with conventional instruments. Spectral flow cytometers offer better resolution of highly similar peak emission reagents. But one must keep in mind that the basic limitations of multicolor fluorescent flow cytometry remain valid even with the most sophisticated spectral unmixing algorithms. Spectral spillover errors cannot be fully eliminated, and the basic rules of panel design must be followed for successful high-dimensional flow cytometry experiments regardless of the instruments used for data acquisition. As an example, we show the comparison of the same mouse lymphoid samples recorded on a 5-laser/25 color BD FACSymphony A5 conventional cytometer and a 5-laser/110 detector Sony ID7000 spectral analyzer in Figs. 6 and 7. The 19-color panel used in this experiment includes a fluorescent protein (YFP) as well as surface and intracellular antibody staining for a variety of T-cell markers. The results indicate subtle differences in resolution of certain marker combinations (Fig. 6) but generally show comparable quality data obtained on the two different platforms. Further comparison with dimensionality reduction algorithm (tSNE) also shows that cell populations identified on traditional two-by-two plots (Fig. 6) map to similar size “islands” both with conventional and spectral analysis (Fig. 7). We anticipate that with the current rapid pace of advances in technology, the quality and depth of phenotypic and functional analyses of single cells using high-dimensional flow cytometry will also expand in scope and utility.
Fig. 6.
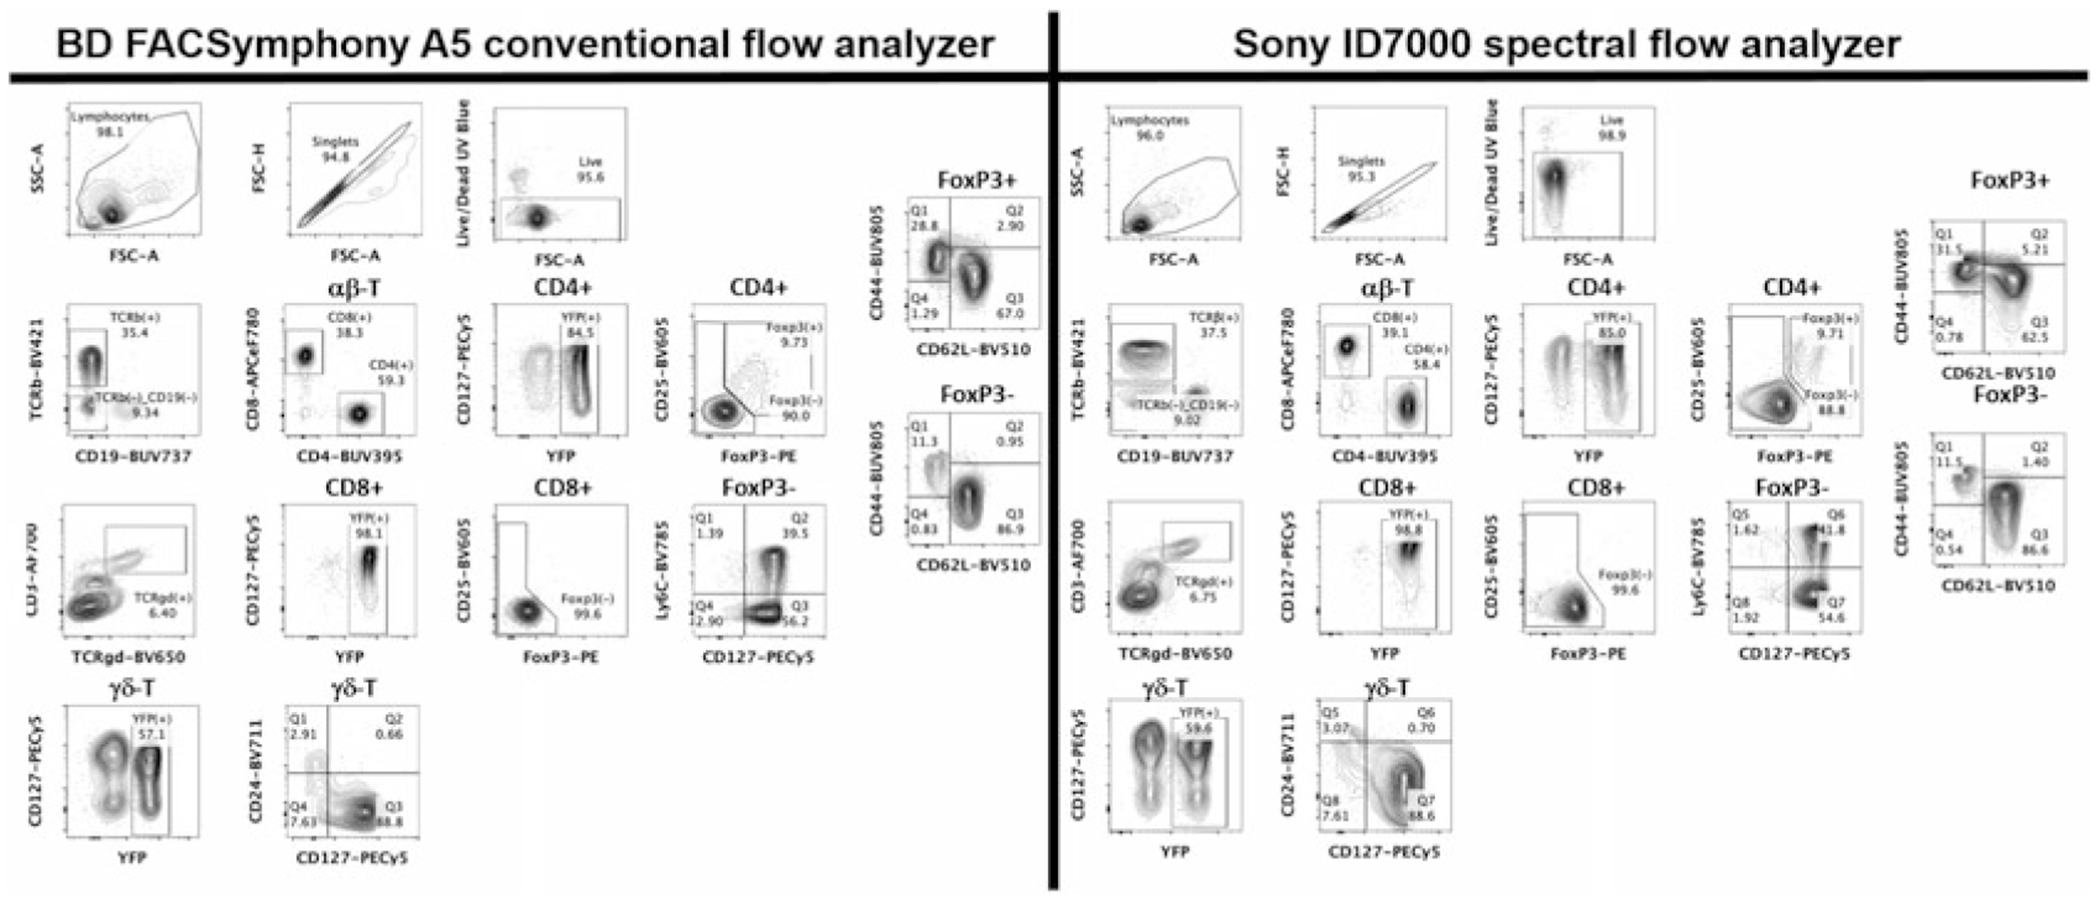
Comparison of high-dimensional flow cytometry data obtained on conventional and spectra flow analyzer. Two-by-two contour plots of a 19-color high-dimensional flow cytometry panel staining of mouse splenocytes for a variety of T-cell markers. The same sample was acquired on a 25-color BD FACSymphony A5 conventional and a 110-detector Sony ID7000 spectral flow analyzer. Both instruments are equipped with the same type of five lasers, though laser powers are different. Major cell types, subpopulations, and their percentage proportions are indicated. Not all parameters are displayed. Analysis was performed in FlowJo v10.8.1
Acknowledgments
The authors wish to acknowledge Karen Wolcott (CCR/LGI Flow Core) for help with training on the Sony ID7000 spectral analyzer, Jeff Clapper (Sony Biotechnology) for helpful discussions and insight in spectral flow cytometry and Hidehiro Yamane, and Mariah Lee (CCR/LCMB, NCI, NIH) for providing unpublished data in Figs. 6 and 7 for the comparison of conventional and spectral flow cytometry analyses.
References
- 1.Bagwell CB, Adams EG (1993) Fluorescence spectral overlap compensation for any number of flow cytometry parameters. Ann N Y Acad Sci 677:167–184. 10.1111/j.1749-6632.1993.tb38775.x [DOI] [PubMed] [Google Scholar]
- 2.Bandura DR, Baranov VI, Ornatsky OI, Antonov A, Kinach R, Lou X, Pavlov S, Vorobiev S, Dick JE, Tanner SD (2009) Mass cytometry: technique for real time single cell multitarget immunoassay based on inductively coupled plasma time-of-flight mass spectrometry. Anal Chem 81:6813–6822. 10.1021/ac901049w [DOI] [PubMed] [Google Scholar]
- 3.Behbehani GK, Bendall SC, Clutter MR, Fantl WJ, Nolan GP (2012) Single-cell mass cytometry adapted to measurements of the cell cycle. Cytometry A 81:552–566. 10.1002/cyto.a.22075 [DOI] [PMC free article] [PubMed] [Google Scholar]
- 4.Brummelman J, Haftmann C, Núñez NG, Alvisi G, Mazza EMC, Becher B, Lugli E (2019) Development, application and computational analysis of high-dimensional fluorescent antibody panels for single-cell flow cytometry. Nat Protoc 14:1946–1969. 10.1038/s41596-019-0166-2 [DOI] [PubMed] [Google Scholar]
- 5.Grégori G, Patsekin V, Rajwa B, Jones J, Ragheb K, Holdman C, Robinson JP (2012) Hyperspectral cytometry at the single-cell level using a 32-channel photodetector. Cytometry A 81:35–44. 10.1002/cyto.a.21120 [DOI] [PubMed] [Google Scholar]
- 6.Habbersett RC, Naivar MA, Woods TA, Goddard GR, Graves SW (2007) Evaluation of a green laser pointer for flow cytometry. Cytometry A 71:809–817. 10.1002/cyto.a.20454 [DOI] [PubMed] [Google Scholar]
- 7.Lansdorp PM, Smith C, Safford M, Terstappen LW, Thomas TE (1991) Single laser three color immunofluorescence staining procedures based on energy transfer between phycoerythrin and cyanine 5. Cytometry 12:723–730. 10.1002/cyto.990120806 [DOI] [PubMed] [Google Scholar]
- 8.Li W, Vacca G, Castillo M, Houston KD, Houston JP (2014) Fluorescence lifetime excitation cytometry by kinetic dithering. Electrophoresis 35:1846–1854. 10.1002/elps.201300618 [DOI] [PMC free article] [PubMed] [Google Scholar]
- 9.Liechti T, Weber LM, Ashhurst TM, Stanley N, Prlic M, Van Gassen S, Mair F (2021) An updated guide for the perplexed: cytometry in the high-dimensional era. Nat Immunol 22:1190–1197. 10.1038/s41590-021-01006-z [DOI] [PubMed] [Google Scholar]
- 10.Maecker HT, Trotter J (2006) Flow cytometry controls, instrument setup, and the determination of positivity. Cytometry A 69:1037–1042. 10.1002/cyto.a.20333 [DOI] [PubMed] [Google Scholar]
- 11.Mair F, Tyznik AJ (2019) High-dimensional Immunophenotyping with fluorescence-based cytometry: a practical guidebook. Methods Mol Biol 2032:1–29. 10.1007/978-1-4939-9650-6_1 [DOI] [PubMed] [Google Scholar]
- 12.Barteneva NS, Vorobjev IA (2016) Imaging flow cytometry, 1st edn. Humana Press. 10.1007/978-1-4939-3302-0 [DOI] [Google Scholar]
- 13.Nguyen R, Perfetto S, Mahnke YD, Chattopadhyay P, Roederer M (2013) Quantifying spillover spreading for comparing instrument performance and aiding in multicolor panel design. Cytometry A 83:306–315. 10.1002/cyto.a.22251 [DOI] [PMC free article] [PubMed] [Google Scholar]
- 14.Park LM, Lannigan J, Jaimes MC (2020) OMIP-069: forty-color full spectrum flow cytometry panel for deep immunophenotyping of major cell subsets in human peripheral blood. Cytometry A 97:1044–1051. 10.1002/cyto.a.24213 [DOI] [PMC free article] [PubMed] [Google Scholar]
- 15.Roederer M, Murphy RF (1986) Cell-by-cell autofluorescence correction for low signal-to-noise systems: application to epidermal growth factor endocytosis by 3T3 fibroblasts. Cytometry 7:558–565. 10.1002/cyto.990070610 [DOI] [PubMed] [Google Scholar]
- 16.Schwann T (1839) Mikroskopische Untersuchungen ueber die Uebereinstimmung in der Struktur und dem Wachstum der Thiere und Pflanzen (Verlag van Sanderschen Buchhandlung; ) [PubMed] [Google Scholar]
- 17.Wade CG, Rhyne RH Jr, Woodruff WH, Bloch DP, Bartholomew JC (1979) Spectra of cells in flow cytometry using a vidicon detector. J Histochem Cytochem 27:1049–1052. 10.1177/27.6.110874 [DOI] [PubMed] [Google Scholar]