

Abstract
With the advancement of nanotechnology, nanoparticles are widely used in many different industrial processes and consumer products. Copper nanoparticles (Cu NPs) are among the most toxic nanomaterials. We investigated Cu NPs toxicity in Human Hepatocellular carcinoma (HepG2) cells by examining signaling pathways, and microRNA/mRNA interactions. We compared the effects of exposures to Cu NPs at various concentrations and CuCl2 was used as a control. The number of differentially expressed mRNA did not follow a linear dose-response relationship for either Cu NPs or CuCl2 treatments. The most significantly altered genes and pathways by Cu NPs exposure were NRF2 (nuclear factor erythroid 2 related factor 2)-mediated oxidative stress response, protein ubiquitination, Tumor protein p53 (p53), phase I and II metabolizing enzymes, antioxidant proteins and phase III detoxifying gene pathways. Messenger RNA-microRNA interaction from MicroRNA Target Filter Analyses revealed more signaling pathways altered in Cu NPs treated samples than transcriptomics alone, including cell proliferation, DNA methylation, endoplasmic reticulum (ER) stress, apoptosis, autophagy, reactive oxygen species, inflammation, tumorigenesis, extracellular matrix/angiogenesis and protein synthesis. In contrast, in the control (CuCl2) treated samples showed mostly changes in inflammation mainly through regulation of the Nuclear Factor Kappa-light-chain-enhancer of Activated B-cells (NFκB). Further, some RNA based parameters that showed promise as biomarkers of Cu NPs exposure including both well and lesser known genes: heme oxygenase 1 (HMOX1), heat shock protein, c-Fos proto-oncogene, DNA methyltransferase, and glutamate-cysteine ligase modifier subunit (GCLM, part of the glutathione synthesis pathway). The differences in signaling pathways altered by the Cu NPs and CuCl2 treatments suggest that the effects of the Cu NPs were not the results of nanomaterial dissolution to soluble copper ions.
Keywords: Cu nanoparticles, transcriptomics, microRNA expression, HepG2 cells, signaling pathways, microRNA target filter analysis
Graphical Abstract

1. Introduction:
The widespread application of nanoparticles (NPs) in industrial and consumer products has raised concerns about their health and environmental effects. Nano-metals are characterized by having a particle size of less than 100 nm. Nanoparticles usually demonstrate chemical properties that are different from the macromaterials of similar chemical composition [1]. Toxicities of nanoparticles depend on many different factors, such as size, shape, surface area, dose, etc., but in general metal nanoparticles are more toxic to human health in comparison to their microparticle and bulk counterpart versions [2]. For particles of the same composition, it has often been suggested that the toxicity observed is proportional to the surface area of nano, micro and macromaterials [3].
Copper is one of the essential nutrients to maintain normal physiological and biochemical functions in animals and humans. Copper nanoparticles (Cu NPs) are widely utilized as catalysts, sensors, and anti-microbial agents. Because copper is an essential nutrient, Cu NPs were also widely used as additives in livestock and poultry feed. The excessive application of Cu NPs increased exposure to human, animals and the environment. Because of the small size of the Cu NPs particles, they can easily penetrate biological membranes, including skin and cell membranes, once entered cells, they can inhibit enzyme activities, block ion channels and interact with DNA molecules. Cu NPs has been reported to be among the most toxic nanomaterials in mammals. Animal studies suggested that oral administration of Cu NPs severely damaged the liver, kidney, spleen, and brain [4–6].
Our group has previously reported on the cytotoxic and biochemical effects of Cu NPs on HepG2 cells, human hepatocellular carcinoma cell line [7]. CuCl2 was used as control for Cu2+ ion, a product of Cu NPs dissolution at low pH. We showed that both Cu NPs and CuCl2 exerted cytotoxicity and oxidative stress, but at different concentrations. Cu NPs showed low cytotoxicity at 3 (equal to 47.2 mM elemental Cu if totally dissolved) to 6 μg/ml, and high cytotoxicity over 10 μg/ml (157.3 mM), while CuCl2 showed high toxicity with concentrations higher than 1 μg/ml (7.44 mM). For oxidative stress related enzymes, Cu NPs showed suppression of the enzyme glutathione reductase (GRD) at 1 μg/ml, but CuCl2 did not cause changes at concentrations ranged from 0.1 to 10 μg/ml. However, both Cu NPs and CuCl2 suppressed G6PDH (glucose-6-phosphate dehydrogenase, enzyme that converts oxidized glutathione disulfide (GSSG) to reduced form, glutathione (GSH)) at concentrations higher than 1 μg/ml (15.73 mM for Cu NPs, 7.44 mM for CuCl2). This is consistent with the literature that both Cu NPs and Cu2+ caused oxidative stress, inflammation and other histopathological changes in the rat liver after oral exposure in rats [8]. However, our results also demonstrated that Cu NPs and CuCl2 had differential biochemical effects on HepG2 cell, for example, gamma glutamyltranspeptidase (GGT) and superoxide dismutase (SOD) were not affected by Cu NPs but were affected by CuCl2[7].
In order to better understand the biological effects of Cu NPs on human liver (HepG2) cells, and the alterations in the signaling pathways, we examined mRNA and microRNA (miRNA) expression profiles after treatments with Cu NPs or CuCl2. These RNA profiling data will give us more in-depth information on the mechanism of action and possible longer-term biological effects compared to cell cytotoxicity and biochemical analysis.
2. Experimental Details
Nanoparticles and their dispersion
Cu NPs was purchased from Aldrich, Cat# 684007–25G, lot # 25896PJ. Their physical chemical properties were reported before [7]. In short, the size of Cu NPs is 2–5 nm by transmission electron microscopy (TEM). The surface area and diameter measured by Brunauer, Emmett, Teller test (BET) are 10.4 m2/g and 64.8 nm respectively. For comparative purposes CuCl2 (Sigma, Cat# C6641) was used as a source of Cu2+.
The dispersion method of these nanoparticles was reported previously [9, 10]. Briefly, Cu NPs were sonicated in solutions containing bovine serum albumin (BSA, 200 mg/ml in deionized water) and corn oil (0.01% v/v) in PBS. Sonication was done at room temperature, with a S-4000 Misonix Ultrasonic Liquid Processors with a 2.5-inch cup horn for two 10 min. cycles of 13 second on, 7 seconds off. This general nanomaterial dispersion method followed the approach of Dr. Dale Porter [11]. After sonication, the unbound BSA and corn oil remaining in the supernatant were removed after centrifugation (9300 × g for 5 minutes), and then the nanomaterials were resuspended in cell culture media. The size and zeta potential of the dispersed Cu NPs were measured by light scattering as determined in a Zetasizer Nano ZS (Malvern Instruments, Worcestershire, UK).
Cell and treatments
Human hepatocellular carcinoma (HepG2) cells were purchased from American Type Culture Collection (ATCC cat# HB-8065) and grown in the medium recommended (Basal Eagle’s Minimal Essential Medium containing 2 mM GlutaMAX™ (Life Technology, Grand Island NY), 1 mM sodium pyruvate and 10% fetal bovine serum). Cell cultures were maintained in a humidified incubator at 37°C and 95% air/5% CO2. Cells were plated at a density of 30,000 cells/cm2 in T25 flasks prior to nanomaterial exposure. Forty-eight hours after plating, cells were treated with Cu NPs, at 10, 5, 2.5 and 1.25 μg/ml, and CuCl2 at 3, 1, 0.5 and 0.25 μg /ml. These 4 exposure concentrations were chosen based on the results of our groups prior cytotoxicity experiments ranging from severe, high, medium, low to no cytotoxicity [7]. For negative control, cells were treated with plain media. Each treatment dose was done in 5 replicates. Cells were treated for 72 hours. At the end of treatments, cells were washed twice with PBS before RNA extraction.
RNA preparations
Total RNA was extracted from cells using mirVana™ RNA extraction kits (Thermo Fisher Scientific, Waltham MA) following the manufacturer’s protocol. The integrity of the extracted RNA was assessed in the Bioanalyzer (model 2100, Agilent Santa Clara, CA), and only RNA with the RNA Integrity Number (RIN) greater than 9.8 were used in RNA and small RNA sequencing.
RNA sequencing for both RNA and small RNA
RNA sequencing: All 96 total RNA samples (1 μg per sample) were processed on an Apollo324 for mRNA selection with Wafergen kit (PrepX polyA mRNA Isolation Kit, 400047) and continued on library prep with a PrepX mRNA 48 Protocol (PrepX RNA-Seq 48 Library Kit for Illumina by Wafergen), then PCR amplification was performed for 15 cycles with 24 index primers. The resulting PCR products were cleaned up on an Apollo324 with PCR Cleanup 48 Protocol. The volume of the purified libraries was 10 μl. One microliter each was taken from every library for a Qubit quantitation check with Qubit dsDNA HS kit by Invitrogen and a Bioanalyzer quality check with High Sensitivity DNA Chips and Reagents by Agilent Technologies. The molar concentration of each library was estimated by using average molecular size from Bioanalyzer data and concentration from Qubit measurement. Then each library was diluted to 2 nM. The diluted libraries were pooled to make the sample pool for the sequencing run and checked by Qubit to confirm the working concentration. The pooled libraries were denatured and diluted according to Illmina NextSeq protocols. The final concentration for sequencing was 3.5 pM + 2% PhiX (a bacteriophage DNA as control) and it was run for 75 cycles SR (Single Read). The sequencing reactions were run in an Illumina NextSeq 500 Sequencer. The sequencing data were stored in Illumina BaseSpace cloud space.
Small RNA sequencing: The total RNA (1.5 μg per sample) was processed on an Apollo324 robot by a Wafergen for small RNA library prep (PrepX Small RNA 48 protocol) with the same reagent kit for RNA-Seq without RNase III digestion step. After 15 cycles PCR, the products were ethanol precipitated and the pellet was resuspended in 30 μl of water. cDNA fragments between 110bp and 180bp (peak at 145bp) were isolated on Pippin Prep 3% agarose gel with marker F by Sage Science (Beverly, MA). The collected 40 μl cDNA solution was concentrated by Eppendorf Vacufuge Plus to about 15 μl and the sample quality was checked by a Bioanalyzer High Sensitivity DNA Chips and Reagents. The cDNA concentration was measured with a Qubit dsDNA HS kit. The molar concentration of each library was estimated by using the average molecular size from Bioanalyzer data and the concentration from Qubit measurement. Then each library was diluted to 2 nM. The diluted libraries were pooled to make the sample pool for a sequencing run and checked by Qubit to confirm the working concentration. The pooled libraries were denatured and diluted according to Illumina NextSeq protocols. The final concentrations for sequencing were around 4 pM + 2% PhiX and it was run for 75 cycles SR (Single Read). The sequencing data were stored in the Illumina BaseSpace Sequence Hub.
Data Analysis
All fastq files generated by NextSeq 500 were first analyzed by FastQC software for data quality assessment. RNA-Seq profiling was quantified using the Partek(E/M) annotation model and the STAR-2.5.3a aligner, aligned to human genome hg19. Normalization and contrast were performed using DESeq2. MicroRNA Expression was quantified with mirDeep2, and normalization and contrast performed using DESeq2 [12, 13]. Benjamini-Hochberg method [14] for multi-testing correction was included in DESeq2.
Ingenuity Pathway Analysis (IPA) and MicroRNA Target Filter Analysis
Differential expressed gene (DEG) lists were uploaded into IPA to delineate the canonical signaling pathways altered by each treatment. In order to find the key molecules in mRNA/miRNA interaction for each chemical treatment, we first found the common DEGs in the mRNA data sets and then found the common microRNAs in microRNA data sets. Then, the information was uploaded into IPA and a microRNA Target Filter Analysis was conducted. For example, to find the common mRNAs for CuCl2 treated samples, we found the intersection of the four DEG files (files of 3, 1, 0.5 and 0.25 μg/ml CuCl2 treated samples), then, found the intersection of the four microRNA files. These common DEG lists were then, uploaded to IPA for microRNA Target Filter Analysis. Very few microRNA were differentially expressed at 2.5 μg/ml Cu NPs, so we used the other 3 doses to find the intersection of microRNAs. For the microRNA Target Filter Analysis, the confidence levels for miRNA-RNA interaction was set to “Experimentally Observed”, which is the highest stringency setting. The “Expression Pairing” filter was not applied since sometime the levels of mRNA were not changed even when the protein translation are affected [15].
3. Results and Discussions
Size and zeta potential of dispersed Cu NPs
The size and zeta potential were reported previously [7]. Briefly, the zeta potential of the Cu NPs was −10 to −15 millivolts (mV). Particle suspensions with zeta potential between +30 and −30 mV are considered not stable and will likely agglomerate in the dispersion media. The observed hydrodynamic size for 3 μg/ml Cu NPs is around 109 +/− 26 nm. This is much larger than the dry primary size range of 2–5 nm. Cu NPs in our dispersion system exhibited agglomeration.
Differentially Expressed Genes (DEG) lists
Table 1 shows the numbers of differential expressed mRNA/miRNAs in each treatment with an adjusted p value ≤ 0.05. The numbers of DEG for both Cu NPs and CuCl2 did not show linear dose responses for both mRNA and microRNA. The highest three concentrations of Cu NPs produced more DEGs than CuCl2 at all doses. Cu NPs at 2.5 μg/ml only caused alterations of 12 microRNAs which was 10-fold less than other concentrations.
Table 1.
Number of differentially expressed mRNA and miRNA (with adj. p ≤ 0.05) in Human hepatocellular carcinoma (HepG2) cells exposed to Cu NPs or CuCl2 for 72 hours.
| concentration μg/ml | mRNA | miRNA | |
|---|---|---|---|
| Cu NPs | 1.25 | 724 | 116 |
| 2.5 | 5,222 | 12 | |
| 5 | 7,336 | 108 | |
| 10 | 7,004 | 164 | |
| CuCl2 | 0.25 | 1,033 | 104 |
| 0.5 | 2,734 | 91 | |
| 1 | 809 | 77 | |
| 3 | 2,987 | 149 |
Canonical pathways
Table 2 shows the top 12 canonical pathways affected in each treatment from IPA. The numbers of altered signaling pathways are listed on the top of Table 2. There are many signaling pathways altered in treatments, e.g., protein ubiquitination pathway, acute phase response signaling, p53 signaling pathway (in some treatments, the p53 pathway did not show up in the top 12, but it did show up at lower rating values). The Cu NPs in all four doses affected more stress related pathways than CuCl2. Copper chloride affected stress related pathways mostly in the highest concentration (3 μg/ml) treatment. All the samples have more than 100 signaling pathways altered (p ≤ 0.05).
Table 2.
Altered canonical pathways in Human hepatocellular carcinoma (HepG2) cells exposed to Cu NPs or CuCl2 for 72 hours.
| Cu NPs | CuCl2 | ||||||||
|---|---|---|---|---|---|---|---|---|---|
| dose (μg/ml) | 10 | 5 | 2.5 | 1.25 | 3 | 1 | 0.5 | 0.25 | |
| # of pathway altered | 253 | 220 | 157 | 100 | 176 | 149 | 161 | 217 | |
| 1 | Protein Ubiquitination Pathway | Protein Ubiquitination Pathway | Protein Ubiquitination Pathway | SPINK1 General Cancer Pathway | Protein Ubiquitination Pathway | Acute Phase Response Signaling | FXR/RXR Activation | mTOR Signaling | |
| 2 | Acute Phase Response Signaling | Acute Phase Response Signaling | NRF2-mediated Oxidative Stress Response | NRF2-mediated Oxidative Stress Response | Acute Phase Response Signaling | Renal Cell Carcinoma Signaling | Pyridoxal 5’-phosphate Salvage Pathway | AMPK Signaling | |
| 3 | NRF2-mediated Oxidative Stress Response | FXR/RXR Activation | Superpathway of Cholesterol Biosynthesis | Coagulation System | Unfolded protein response | Glioma Signaling | Acute Myeloid Leukemia Signaling | Germ Cell-Sertoli Cell Junction Signaling | |
| 4 | Germ Cell-Sertoli Cell Junction Signaling | NRF2-mediated Oxidative Stress Response | Acute Phase Response Signaling | Pancreatic Adenocarcinoma Signaling | NRF2-mediated Oxidative Stress Response | FXR/RXR Activation | Acute Phase Response Signaling | TR/RXR Activation | |
| 5 | ATM Signaling | Hereditary Breast Cancer Signaling | Phagosome Maturation | Mismatch Repair in Eukaryotes | FXR/RXR Activation | SPINK1 General Cancer Pathway | Germ Cell-Sertoli Cell Junction Signaling | Acute Phase Response Signaling | |
| 6 | Aldosterone Signaling in Epithelial Cells | Aldosterone Signaling in Epithelial Cells | Molecular Mechanisms of Cancer | Xenobiotic Metabolism Signaling | LXR/RXR Activation | Mitotic Roles of Polo-Like Kinase | Renal Cell Carcinoma Signaling | Sirtuin Signaling Pathway | |
| 7 | IGF-1 Signaling | Phagosome Maturation | Cholesterol Biosynthesis I | Hereditary Breast Cancer Signaling | Coagulation System | PI3K/AKT Signaling | Endocannabinoid Cancer Inhibition Pathway | Integrin Signaling | |
| 8 | Rac Signaling | Aryl Hydrocarbon Receptor Signaling | Cholesterol Biosynthesis II (via 24,25-dihydrolanosterol) | Serotonin Degradation | Aldosterone Signaling in Epithelial Cells | Non-Small Cell Lung Cancer Signaling | NGF Signaling | EGF Signaling | |
| 9 | Iron homeostasis signaling pathway | Unfolded protein response | Cholesterol Biosynthesis III (via Desmosterol) | Methylglyoxal Degradation III | Xenobiotic Metabolism Signaling | Clathrin-mediated Endocytosis Signaling | Production of Nitric Oxide and Reactive Oxygen Species in Macrophages | ErbB Signaling | |
| 10 | Huntington’s Disease Signaling | Role of BRCA1 in DNA Damage Response | Hereditary Breast Cancer Signaling | Acute Phase Response Signaling | Small Cell Lung Cancer Signaling | ErbB Signaling | Mitotic Roles of Polo-Like Kinase | Mouse Embryonic Stem Cell Pluripotency | |
| 11 | Molecular Mechanisms of Cancer | Molecular Mechanisms of Cancer | Iron homeostasis signaling pathway | N-acetylglucosamine Degradation I | Choline Biosynthesis III | Sirtuin Signaling Pathway | GM-CSF Signaling | Insulin Receptor Signaling | |
| 12 | Remodeling of Epithelial Adherens Junctions | Superpathway of Cholesterol Biosynthesis | Sirtuin Signaling Pathway | Protein Ubiquitination Pathway | Pancreatic Adenocarcinoma Signaling | Apelin Endothelial Signaling Pathway | Telomerase Signaling | Role of Tissue Factor in Cancer | |
| cancer related pathways | |
| stress response pathways | |
| Receptor related pathways | |
| cholesterol metabolism | |
| cell cycle/proliferation related | |
| protein metabolism | |
| Biochemical pathways | |
| does not fit into above |
NRF2-mediated oxidative stress response
Because oxidative stress is one of the major pathways proposed for nanoparticle induced toxicity [16, 17], we examined the NRF2-mediated oxidative stress response more closely (Table 3). In most cases (4 doses of Cu NPs and 1 dose of CuCl2), this pathway is activated in HepG2 cells, indicating a protective effect to reduce the treatment-induced oxidative stress. For most of the genes altered in this signaling pathways, for example, heme oxygenase 1 (HMOX1), c-Fos, glutamate-cysteine ligase modifier subunit (GCLM), a linear dose-response curves was not observed; most of the highest expression levels of gene expression for Cu NPs treated samples occurred at 5 μg/ml, not at 10 μg/ml. This could be explained by the higher cytotoxicity we observed at 10 μg/ml with much less cytotoxicity at lower concentrations [7]. Cu NPs at 10, 5, and 2.5 μg/ml caused much higher induction of genes in this pathway than CuCl2. CuCl2 only activated this pathway at the highest concentration level (3 μg/ml). Several genes at lower CuCl2 treatments were even downregulated.
Table 3.
Gene expression changes (fold response) in the NRF2-mediated oxidative stress response pathway in HepG2 cells following Cu NPs or CuCl2 treatment for 72 hr.
| Chemical | Cu NPs | CuCl2 | |||||||
|---|---|---|---|---|---|---|---|---|---|
| Dosage (μg/ml) | 10 | 5 | 2.5 | 1.25 | 3 | 1 | 0.5 | 0.25 | |
| NRF2-mediated oxidative stress signaling pathway | NRF2 | nc* | nc | nc | nc | nc | −1.3 | −1.3 | −1.3 |
| KEAP1 | 1.4 | 1.5 | nc | nc | nc | nc | nc | nc | |
| PMF-1 | 1.8 | 1.4 | 1.7 | nc | nc | nc | nc | nc | |
| ATF4 | 1.8 | 1.7 | 1.6 | nc | nc | nc | nc | nc | |
| c-FOS | 7.1 | 10 | 3.2 | 1.9 | 2.5 | nc | nc | nc | |
| FRA1 | 1.7 | 5 | 2.7 | nc | nc | nc | nc | nc | |
| phase I and II metabolizing enzymes | GCLC | 1.8 | 2.1 | 1.8 | nc | 1.6 | nc | nc | −1.3 |
| GCLM | 7.2 | 10 | 6.2 | 2.4 | 4.4 | nc | nc | −1.3 | |
| phase III detoxifying proteins | MRP1 | 2.2 | 1.9 | 1.7 | nc | 1.3 | nc | nc | 1.1 |
| MRP2 | 1.9 | 2.2 | 1.4 | nc | 1.6 | nc | nc | nc | |
| MRP4 | 1.4 | 1.5 | 1.2 | nc | nc | −1.2 | −1.2 | −1.2 | |
| antioxidant proteins | TXN | 2.3 | 2.4 | 2.0 | nc | 1.6 | nc | nc | nc |
| SQSTM1 | 5.1 | 4.0 | 3.5 | 2.0 | 2.3 | nc | nc | 1.4 | |
| HMOX-1 | 70 | 86 | 47 | 2.0 | 26 | nc | nc | nc | |
nc = no change
Protein Ubiquitination pathway
In the IPA analysis, the protein ubiquitination pathway is the number one altered pathway at the top three concentrations for Cu NPs and highest concentration for CuCl2 (Table 4). The expression levels of many genes in this pathway were changed, but overall it is difficult to determine whether it is up or down regulated, because of the diversity of responses. The NRF2 signaling pathway and p53 signaling pathway were examined in more details since these two are both stress response-related and both regulated by ubiquitination. Table 4 shows that Kelch-like ECH-associated protein 1 (Keap 1), Cullin 3 (Cul3) and RING-box protein 1 (RBX1) (consist of ubiquitin E3 ligase for NRF2) are slightly up-regulated, while ubiquitin C-terminal hydrolase 1 (UCHL1, deubiquitinase for p53) are highly up-regulated (142-fold induction in 5 μg/ml). HSPA6 (Heat chock protein family A (Hsp 70) member 6, i.e., Hsp70B’), an inducible heat shock protein present in the ubiquitination complex where E3 ligase adds ubiquitin to the proteins, was induced to a very high level (more than 3000-fold in 5 μg/ml Cu NPs treated cells). In fact, HSPA6 is the most highly induced gene in all 4 doses of Cu NPs treated samples and in the highest dose of CuCl2 treated samples.
Table 4.
Gene expression changes (fold change) in the protein ubiquitination pathway of HepG2 cells following Cu NPs or CuCl2 treatment for 72 hr.
| chemical | Cu NPs | CuCl2 | |||||||
|---|---|---|---|---|---|---|---|---|---|
| dosage (μg/ml) | 10 | 5 | 2.5 | 1.25 | 3 | 1 | 0.5 | 0.25 | |
| aUAE | E1 | 1.5 | 1.4 | nc | nc | nc | nc | nc | nc |
| bDUB | UCHL1 | 115 | 142 | 58 | 7.8 | nc | nc | nc | nc |
| DUB | UCHL3 | 2.1 | 1.9 | 1.7 | nc | 1.4 | nc | nc | nc |
| DUB | HSP28 | −1.7 | −1.7 | −1.6 | −1.6 | −1.5 | nc | nc | nc |
| DUB | USP9X | nc | 1.2 | nc | nc | nc | nc | nc | nc |
| cE3 cofactor | CDC20 | 3.2 | 3.1 | 3.0 | nc | 1.8 | 1.9 | 1.8 | 2.2 |
| E3 cofactor | SKP2 | −2.9 | −3.2 | −2.2 | −1.4 | −1.6 | nc | nc | nc |
| E3 cofactor | BTRC | −1.3 | −1.4 | −1.2 | −1.2 | −1.2 | nc | nc | nc |
| NRF2 | Keap 1 | 1.4 | 1.5 | nc | nc | nc | nc | nc | nc |
| NRF2 | nc | nc | nc | nc | nc | −1.3 | −1.3 | −1.3 | |
| Cul 3 | nc | 1.3 | 1.3 | nc | nc | nc | nc | nc | |
| RBX1 | 1.5 | 1.6 | 1.4 | nc | 1.3 | nc | nc | nc | |
| NQO1 | 3.6 | 2 | 1.5 | nc | nc | nc | nc | nc | |
| p53/MDM2 | p53 | nc | −1.5 | nc | nc | nc | nc | nc | nc |
| MDM2 | nc | Nc | 1.5 | nc | nc | nc | nc | −1.4 | |
| MDMX | nc | 1.4 | nc | nc | 1.3 | nc | nc | nc | |
| ATM | nc | −1.6 | −1.3 | nc | nc | nc | nc | −1.3 | |
| UCHL1 | 115 | 142 | 58 | 7.8 | nc | nc | nc | nc | |
| P21 cip1 | 1.7 | 1.4 | 1.4 | nc | nc | nc | nc | nc | |
| HSPA6 | >1400 | >3300 | >1000 | 198 | 631 | nc | nc | nc | |
nc = no change
Ubiquitin-activating enzyme
deubiquitinase
ubiquitin ligase
Metallothionein genes
Metallothionein (MT) is a family of proteins that provide multiple binding sites for heavy metals. The expression of this family of genes was highly induced in both Cu NPs and CuCl2 treated cells as expected (Table 5). The levels of induction for Cu NPs were highest at 5 μg/ml, For CuCl2, some of the MT genes were not induced at all at lower concentrations. Cu NPs induced more MT genes than CuCl2.
Table 5.
Gene expressions for metallothionein genes in HepG2 cells following Cu NPs or CuCl2 treatment for 72 hr.
| Chemical | Cu NPs | CuCl2 | |||||||
|---|---|---|---|---|---|---|---|---|---|
| dosage (μg/ml) | 10 | 5 | 2.5 | 1.25 | 3 | 1 | 0.5 | 0.25 | |
| Metallothionein genes | MT1XP1 | 64 | 116 | 94 | 45 | 66 | nc* | nc | nc |
| MT1X | 68 | 109 | 97 | 33 | 57 | 2.5 | 1.9 | 2.1 | |
| MT1B | 142 | 387 | 168 | 64 | 138 | nc | nc | nc | |
| MT1M | 171 | 340 | 213 | 79 | 198 | nc | nc | nc | |
| MT1G | 204 | 282 | 132 | 50 | 91 | 2.9 | 2.6 | 2.6 | |
| MT1H | 238 | 335 | 291 | 64 | 229 | nc | nc | nc | |
| MT2A | 29 | 33 | 23 | 10 | 16 | 2.0 | nc | 1.5 | |
nc = no change
Differentially expressed MicroRNA
Multiple microRNAs are altered by both Cu NPs and CuCl2 treatments (Table 6). The altered miRNAs can be roughly divided into tumor suppressor or oncogenic miRNAs according to their effects on cancer in general or liver cancer specifically. There were both induction and suppression in both mRNA categories by Cu NPs and CuCl2. The microRNA families that are affected only by Cu NPs and not by CuCl2 are miR-15–16, miR-122, miR-146b, and mRNA-210. MicroRNA-93, a member of miR-17 family (an oncogenic miRNA) was only affected by CuCl2 and not by Cu NPs, an unusual pattern in this study. Again, the top two concentrations of Cu NPs affected more miRNA expression than any of the CuCl2 treated samples. The expression of some of the targets of those altered miRNAs are listed in Table 7.
Table 6:
MicroRNA expression changes (fold change) in HepG2 cells following Cu NPs and CuCl2 treatment for 72 hr.
| chemical | Cu NPs | CuCl2 | |||||||
|---|---|---|---|---|---|---|---|---|---|
| dosage (μg/ml) | 10 | 5 | 2.5 | 1.25 | 0.25 | ||||
| Tumor suppressor | |||||||||
| miR-15–16 | miR-15b-5p | 2 | 2 | 1.9 | 1.4 | nc* | nc | nc | nc |
| miR-15a-5p | nc | 1.8 | 1.8 | nc | nc | nc | nc | nc | |
| miR-16–5p | 1.7 | 2.3 | nc | nc | nc | nc | nc | nc | |
| miR-26 | miR-26b-5p | 1.9 | 1.5 | nc | 2 | 1.9 | 1.6 | 1.8 | 1.7 |
| miR-26a-5p | nc | nc | nc | nc | nc | 1.3 | 1.4 | 1.3 | |
| miR-26a-2 | nc | nc | nc | 2.1 | nc | nc | nc | nc | |
| miR-29 | miR-29a-3p | 1.8 | 1.8 | nc | 1.3 | nc | 1.4 | nc | nc |
| miR-29b-3p | 2.2 | 1.7 | nc | nc | 1.5 | nc | nc | nc | |
| miR-122 | miR-122–5p | −1.5 | −1.5 | nc | nc | nc | nc | nc | nc |
| miR-34 | miR34a-5p | 2.6 | 1.8 | nc | 1.7 | 1.6 | nc | nc | nc |
| miR-375 | mir-375 | −2.6 | −1.6 | nc | −2.4 | −2.5 | nc | −1.8 | −1.9 |
| miR-99a | miR-99a-5p | −1.8 | nc | nc | −2.2 | −2.3 | −1.8 | −1.9 | −1.6 |
| miR-146b-5p | −1.8 | nc | nc | nc | nc | nc | nc | nc | |
| oncogenic | |||||||||
| miR-17–92 | |||||||||
| miR-17 family | miR-17–5p | 1.5 | 1.6 | nc | 1.4 | 1.5 | 1.7 | 1.6 | 1.5 |
| miR-106a-5p | nc | nc | nc | 1.5 | 1.4 | 1.8 | 1.7 | 1.5 | |
| miR-106b-5p | 1.5 | 1.6 | nc | nc | nc | 1.5 | nc | nc | |
| miR-93–5p | nc | nc | nc | nc | nc | nc | 1.6 | nc | |
| miR-92 family | miR-92a-3p | −2.8 | −1.9 | −1.7 | −1.8 | −2.5 | nc | −1.5 | −1.8 |
| miR-25–3p | −1.8 | nc | nc | −1.5 | −1.8 | nc | nc | −1.5 | |
| miR-21 | miR-21–5p | −1.6 | nc | nc | nc | −1.6 | nc | −1.7 | nc |
| miR-221 | miR-221–3p | 2.2 | nc | nc | 1.7 | nc | nc | 1.6 | nc |
| ROS related | miR-210–5p | −2.2 | nc | nc | nc | nc | nc | nc | nc |
nc = no change
Table 7.
Gene expression changes (fold change) of targets of miRNA in HepG2 cells following Cu NPs or CuCl2 treatment for 72 hr.
| Chemical | Cu NPs | CuCl2 | ||||||
|---|---|---|---|---|---|---|---|---|
| Dosage (μg/ml) | 10 | 5 | 2.5 | 1.25 | 0.25 | |||
| miR-210 | −2.2 | nc* | nc | nc | nc | nc | nc | nc |
| ISCU | −1.3 | −1.4 | nc | nc | nc | nc | nc | nc |
| SIN3A | −1.5 | −1.5 | −1.4 | nc | −1.3 | −1.2 | nc | nc |
| CASP8AP2 | −2.3 | −2.2 | −1.9 | nc | −1.4 | nc | nc | nc |
| miR-15b | 2.0 | 2.0 | 1.9 | 1.4 | nc | nc | nc | nc |
| MCL1 | 1.3 | 1.4 | nc | nc | nc | −1.3 | −1.2 | −1.3 |
| CCND1 | nc | −1.2 | −1.1 | nc | −1.2 | −1.2 | −1.2 | nc |
| WNT3 | nc | −1.5 | nc | nc | nc | nc | nc | nc |
| miR-146b | −1.8 | nc | nc | nc | nc | nc | nc | nc |
| TRAF6 | nc | 1.7 | nc | nc | nc | nc | nc | −1.5 |
| MCL1 | 1.3 | 1.4 | nc | nc | nc | −1.3 | −1.2 | −1.3 |
| MALAT1 | −1.6 | nc | nc | nc | 2.1 | nc | nc | nc |
| miR-34a | 2.6 | 1.8 | nc | 1.7 | 1.6 | nc | nc | nc |
| Sirt1 | nc | 1.7 | nc | nc | 1.2 | nc | nc | −1.4 |
| MET | nc | nc | nc | nc | nc | −1.2 | −1.2 | −1.1 |
nc = no change
When all four doses of a treatment show no change, then the treatment chemical block is colored with yellow.
MicroRNA Target Filter Analysis
Figure 1 shows the result of the MicroRNA target filter analysis for the Cu NPs and Figure 2 for CuCl2. The expression levels of mRNAs and microRNAs in the MicroRNA target filter analysis are listed in Table 8. There are many more mRNAs/miRNAs present in the graph for Cu NPs than for CuCl2, and that translated into more pathways altered by Cu NPs.
Fig. 1.
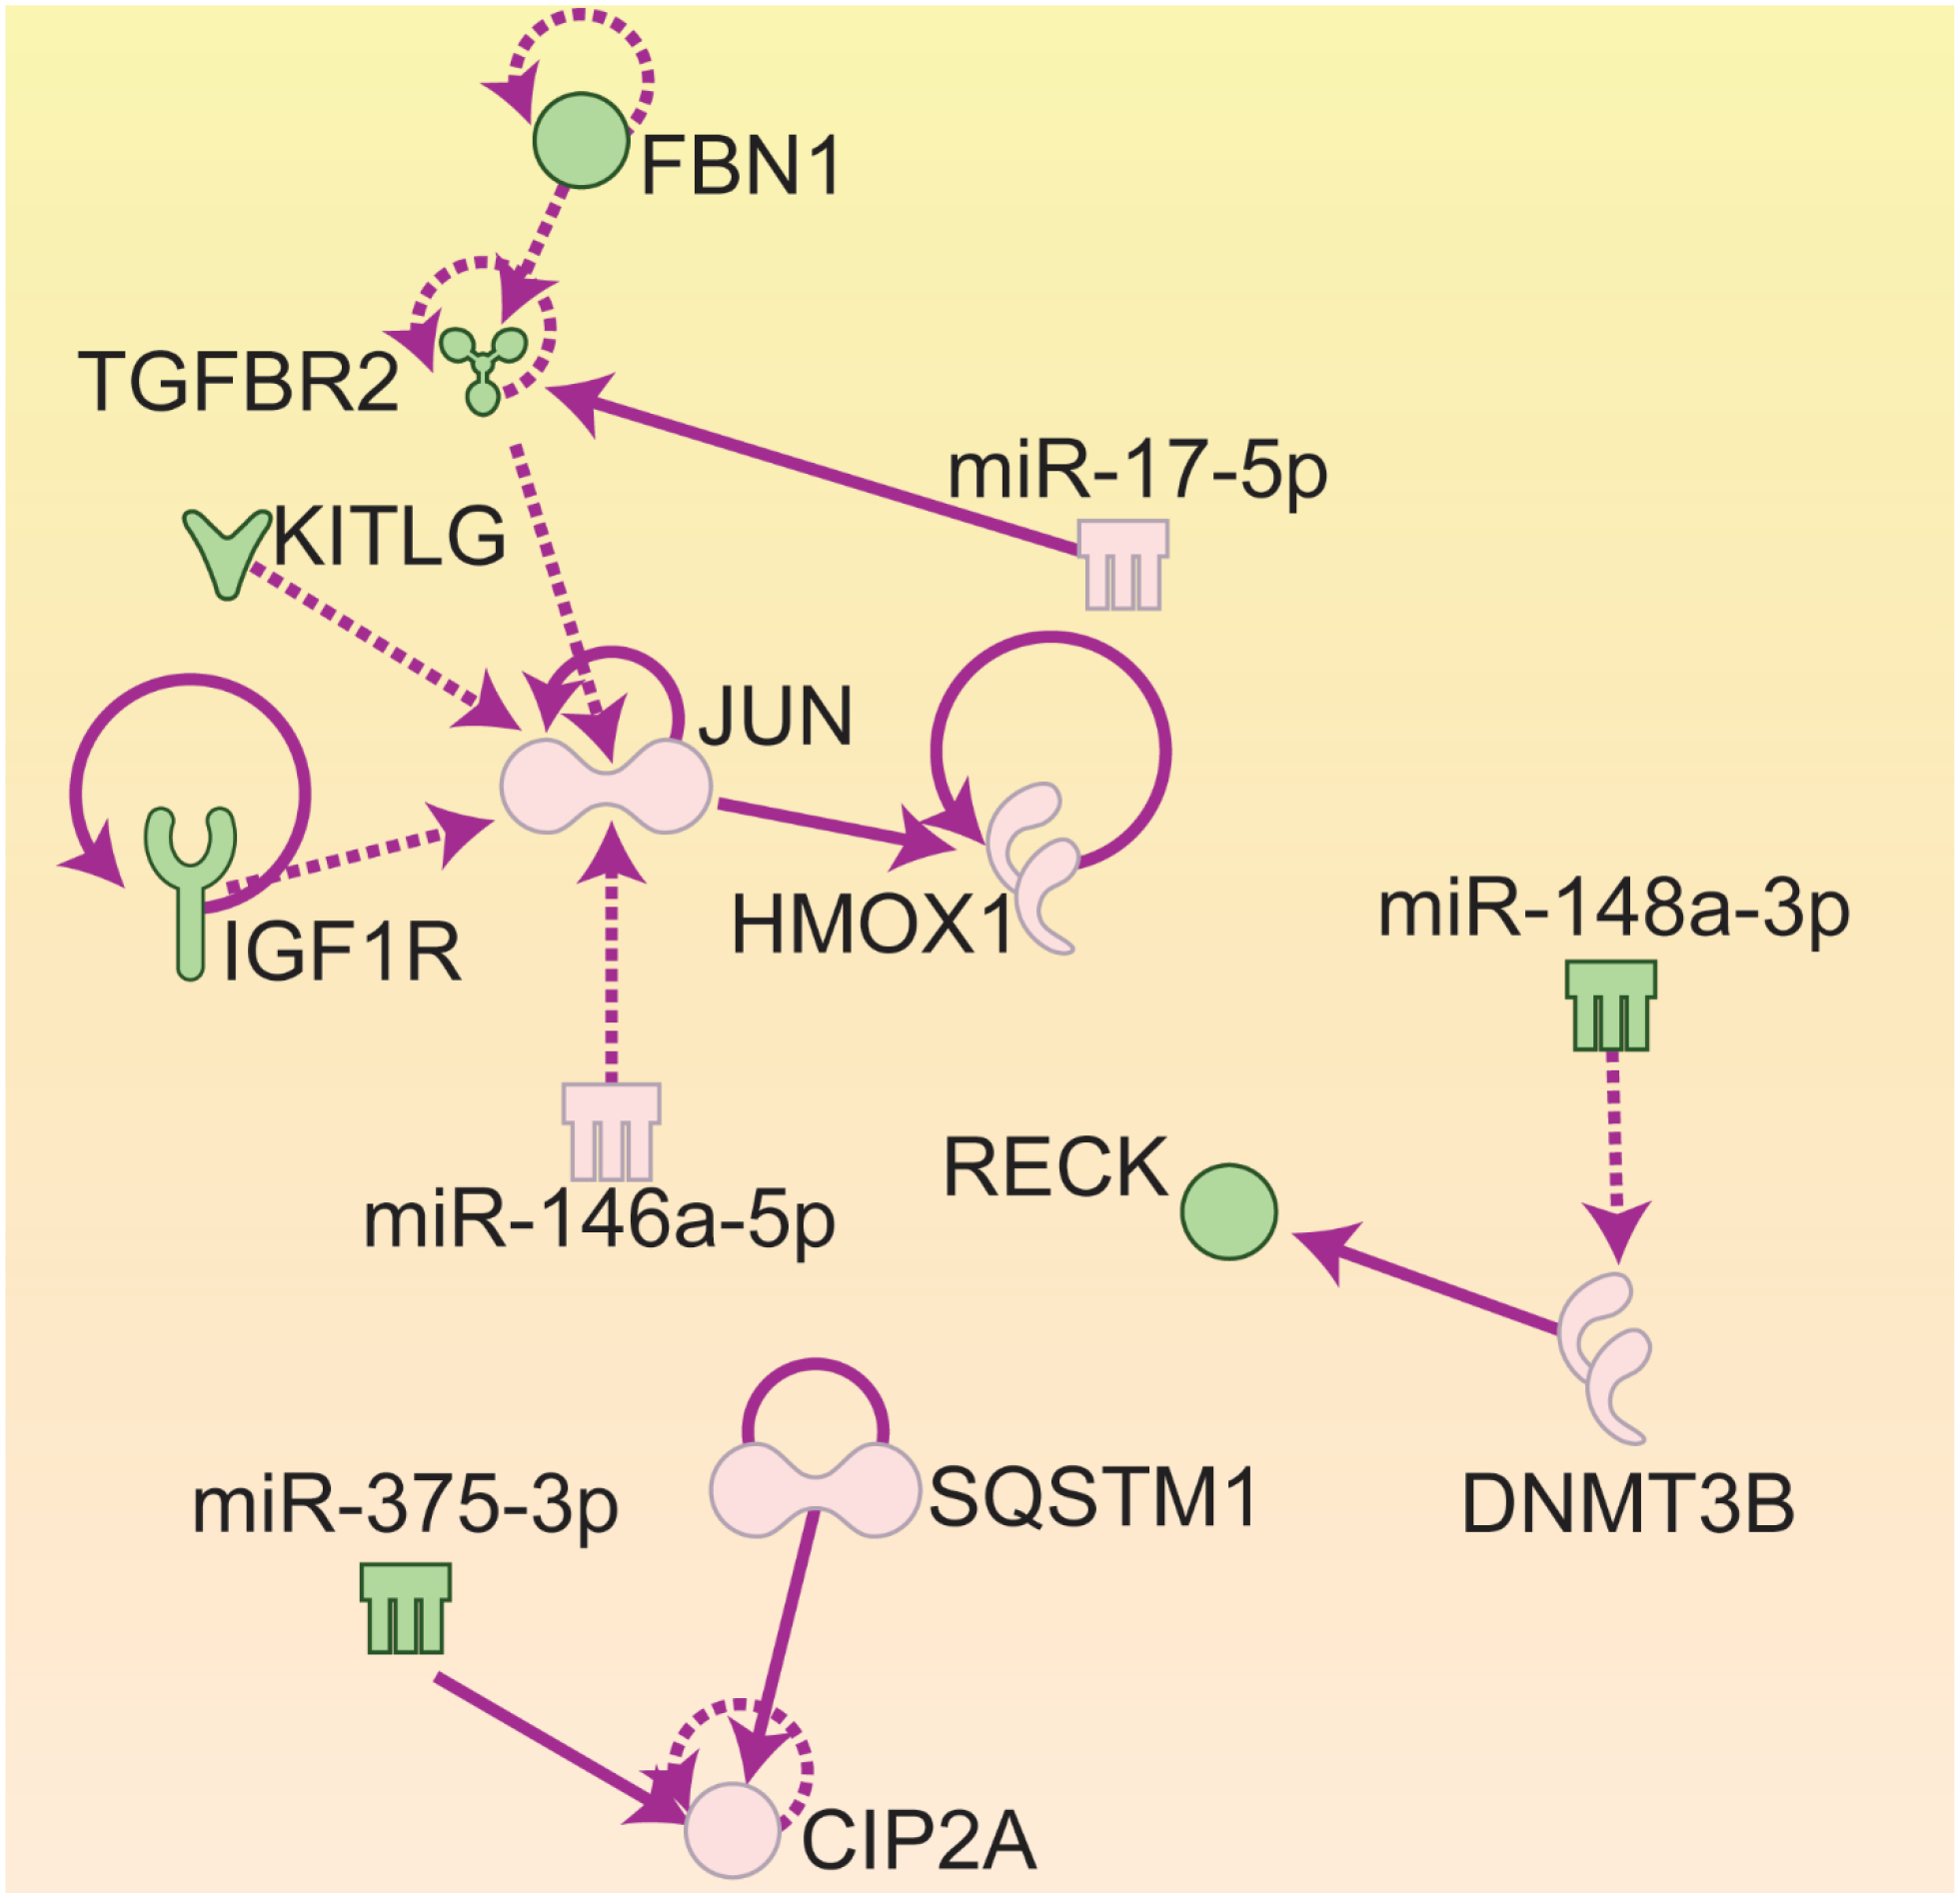
MicroRNA Target filter Analysis results of mRNA and microRNA interaction for HepG2 cells treated with Cu NPs for 72 hours. AP-1: Activator Protein 1; CIP2A: cancerous inhibitor of PP2A; DNMT3B: DNA methyltransferase 3b; FBN1: fibrillin 1; HMOX1: heme oxygenase 1; KITLG: Kit ligand; IGFR1: insulin-like growth factor receptor 1; RECK: reversion-inducing-cysteine-rich protein with kazak motifs; SQSTM1: sequestosome 1; TGFBR2: transforming growth factor receptor 2.
Green: down-regulation
Pink: up-regulation
Solid arrows: direct effects
Dashed arrows: indirect effects
Fig. 2.

MicroRNA Target Filter Analysis results of mRNA and microRNA interaction in HepG2 cells treated with CuCl2 for 72 hours. RUNX1: Run-related transcription factor 1; CHORDC1: cysteine and histidine rich domain containing 1.
Green: down-regulation
Pink: up-regulation
Solid arrows: direct effects
Dashed arrows: indirect effects
Table 8.
Fold changes of mRNA and miRNA in microRNA Target Filter Analyses (in Ingenuity Pathway Analysis) in HepG2 cells following Cu NPs or CuCl2 treatment for 72 hr.
| chemical | Cu NPs | CuCl2 | |||||||
|---|---|---|---|---|---|---|---|---|---|
| dose (μg/ml) | 10 | 5 | 2.5 | 1.25 | 3 | 1 | 0.5 | 0.25 | |
| Cu NPs | JUN | 2.9 | 3.2 | 2.9 | 2.3 | 2.1 | nc* | nc | Nc |
| TGFBR2 | −1.5 | −1.7 | −1.7 | −1.3 | −1.6 | nc | nc | Nc | |
| FBN1 | −2.6 | −2.7 | −1.7 | −1.4 | −1.5 | nc | nc | Nc | |
| KITLG | −2.3 | −1.8 | −1.7 | −1.6 | −1.7 | −1.6 | −1.5 | −1.6 | |
| HMOX1 | 70 | 86 | 47 | 2.0 | 26 | nc | nc | Nc | |
| IGF1R | −1.5 | −1.5 | −1.3 | −1.3 | −1.2 | nc | nc | Nc | |
| CIP2A | 1.7 | 2.7 | 2.1 | 1.6 | 2.0 | nc | nc | Nc | |
| SQSTM1 | 5.1 | 4.0 | 3.5 | 2.0 | 2.3 | nc | nc | 1.4 | |
| DNMT3B | 4.6 | 5.2 | 3.3 | 1.7 | 2.4 | nc | nc | Nc | |
| RECK | −2.7 | −3.1 | −2.1 | −1.5 | −1.5 | nc | nc | Nc | |
| miR-17–5p | 1.5 | 1.6 | nc | 1.4 | 1.5 | 1.7 | 1.6 | 1.5 | |
| miR-146a-5p | 3.5 | 2.0 | nc | 2.7 | 2.9 | 1.8 | 2.2 | 2.0 | |
| miR-375–3p | −2.6 | −1.6 | nc | −2.4 | −2.5 | nc | −1.8 | −1.9 | |
| miR-148a-3p | −1.6 | −1.8 | nc | −2.1 | −1.9 | −1.6 | −1.7 | −1.8 | |
| CuCl2 | RUNX1 | nc | 1.4 | nc | nc | −1.2 | −1.4 | −1.3 | −1.2 |
| CHORDC1 | 2.2 | 5.3 | 2.7 | nc | 2.2 | −1.4 | −1.4 | −1.5 | |
| miR-17–5p | 1.5 | 1.6 | nc | 1.4 | 1.5 | 1.7 | 1.6 | 1.5 | |
| miR-26a-5p | 1.9 | 1.5 | nc | 2.0 | 1.9 | 1.6 | 1.8 | 1.7 | |
nc = no change
4. Discussion
DEGs
In Table 1, there was not a linear dose-response relationship for the total number of altered mRNA or miRNA for either Cu NPs or CuCl2 treatments. This is not surprising since there are many reports of non-linear responses following nanoparticle treatments [10, 18, 19]. This result correlates well with the non-linear responses observed by our group in prior studies in the same cells (HepG2) and same treatments (Cu NPs and CuCl2) with biochemical analyses as the study parameter [7]. However, a dose-response relationship was seen in the expression level of many individual genes and in the number of pathways by Cu NPs. There was a higher cytotoxicity in 10 μg/ml than 5 μg/ml Cu NPs treated samples, that may explain smaller number of DEGs in the higher concentration treated samples.
Canonical pathways
The pathways most altered by Cu NPs are the stress response pathways (highlighted yellow in Table 2), followed by cancer-related pathway (highlighted pink). It was expected that the stress response pathways would be altered since nanoparticles are reported to cause reactive oxygen species (ROS) and other forms of cellular stress [20]. Surprisingly, there were also many cancer-related pathways altered after only 3 days of exposure.
NRF2-mediated oxidative stress signaling pathway
The magnitude of many genes induced by Cu NPs at the three higher concentrations are much higher than the highest concentration of CuCl2 (Table 3). For HMOX1, the expression levels were induced by Cu NPs at the 3 highest doses are about 2-fold higher than CuCl2 at 3 μg/ml. This indicated a much higher degree of oxidative stress was produced by Cu NPs treatments at these higher doses. This is consistent with our findings in the biochemical effects of Cu NPs and CuCl2. Among the biochemical parameters tested in our prior study, glutathione reductase enzyme activity (GRD) is one of the most responsive parameters following Cu NPs and CuCl2 treatments [7]. This enzyme is responsible for reducing GSSG to GSH. GSH protects cells from oxidative stress. Cu NPs exposures decreased GRD enzyme activity to about 70% of control values at 1 and 3 μg/ml and to 27% at 10 μg/ml [7]. However CuCl2 did not affect GRD at any treatment doses, indicating a more severe disturbance of GSH regeneration pathway was caused by Cu NPs exposures [7].
GSH synthesis and homeostasis
Reduced GSH is one of the most prominent cellular defenses against free radicals and oxidative attack. The first step in the biosynthesis of GSH is combining L-glutamate and L-cysteine to form gamma-glutamyl-cysteine. This crucial and rate limiting step is catalyzed by the enzyme glutamate cysteine ligase (GCL). GCL consists of two subunits, a catalytical subunit, GCLC and a modifier subunit, GLCM [21]. In this study, both of the two subunits were elevated in all of the three highest Cu NPs exposures and the highest CuCl2 exposure, suggesting a larger need for cellular GSH synthesis in these four treatment groups. GCLC was elevated between 1.6- and 2.1-fold by Cu NPs or CuCl2 treatments (Table 3). For GCLM, the increases were 7.2, 10, 6.2 and 2.4-fold at 10, 5, 2.5 and 1.25 μg/ml of Cu NPs, respectively. At 3 μg/ml, CuCl2 increased GCLM to 4.4-fold (Table 3). It was reported that the increase in the GLCM has much bigger effects on the enzyme activity of GCL [22]. Therefore, higher increase in GLCM indicated much higher increase in the GLC enzyme activities. One possible interpretation for that is that a larger GSH depletion in several of the Cu NPs and CuCl2 treatment groups of HepG2 cells has called for a massive amount of new synthesis of GSH in the attempt to restore cellular redox homeostasis.
Our in vitro results correlated well with in vivo reports that showed in mouse liver increased ROS, thiobarbituric acid reactive substances, protein carbonyls and 8-hydroxy-2’-dexoyguanosine (8-OHdG) as well as decreased GSH/GSSG ratio were seen after both Cu NPs and CuCl2 administration [23]. Additionally, human liver (HepG2) and lung (A549) cells exposed for one day to 20 – 160 μM CuSO4 produced increased cellular Cu concentration, protein carbonyls, thiobarbituric acid reactive substances, ceruloplasmin and metallothionein and decreased GSH/GSSG ratio and alpha-tocopherol concentrations [24]. These published studies show oxidative stress by several different parameters including altered GSSG/GSH ratios.
Protein Ubiquitination Pathway
Ubiquitination is a post-translational modification of proteins that involves adding one or more ubiquitin, a small 8.6 KD protein, to the to-be-modified protein. Ubiquitin itself can be ubiquitinated at different positions. Only poly-ubiquitination on defined lysine (K29 and K48) is related to degradation by proteasome, while other polyubiquitinations and mono-ubiquitination are involved in regulation of signaling pathways such as stress response, inflammation, endocytic trafficking, translation, DNA repair, cell cycle progression, cancers and many others [25].
Protein ubiquitination is the number one signaling pathway altered at higher concentrations in Cu NPs treated cells; and is only altered in the highest concentration CuCl2 treated cells. It is hard to tell whether this pathway is up- or down-regulated. To better understand the effects of ubiquitination on signaling pathway, the ubiquitination of NRF2 and p53 signaling pathways were examined further (Table 4). Kelch like ECH associated protein 1 (KEAP1) and mouse double minute 2 homolog (MDM2) are part of the enzyme complex for ligating of ubiquitin to the NRF2 and p53 protein, respectively, while ubiquitin carboxy‐terminal hydrolase 1(UCHL1) is a deubiquitinase that is responsible for removing ubiquitin from p53. The gene/protein for deubiquitinase of NRF2 is not known yet.
Under normal levels of oxidative stress, NRF2 and p53 are complexed with KEAP1 and MDM2, respectively, and are directed to be ubiquitinated for subsequent proteasome degradation [26]. Both Cu NPs and CuCl2 induced ROS production. In this high oxidative stress situation, the NRF2 and p53 were in high demand to counter the stress situation and return to homeostasis. In the NRF2 signaling pathway, KEAP1 become oxidized at cysteines and this disrupts the KEAP1-NRF2 complex, and NRF2 is released from the KEAP1 inhibition and promotes its stabilization to induce gene expressions in this pathway. In the p53 signaling pathway, under high oxidative stress condition, MDM2 is destabilized and p53 is released from the complex. In addition, UCHL1 is highly induced, which stabilizes the p53 protein by deubiquitinating p53 [27]. As a result, the p53 signaling pathway is activated and triggers the DNA damage response and cell cycle arrest. UCHL1 is often silenced in breast cancers, nasopharyngeal carcinoma and neuroblastoma [27–29].
Heat shock protein 70’ (HSP70’ or HSPA6) has been shown to stabilize unfolded p53 and cause it to rearrange into correct folding structure. HSPA6 is the most highly induced gene in this entire study of Cu NPs and CuCl2. The fold increase of HSPA6 ranged from 198 to over 3000, with the highest induction in 5 μg/ml Cu NPs treatment (Table 4). HSPA6 has been shown to be highly induced under oxidative stress and can assist in reactivation of heat- or stress-unfolded p53 [30].
There are two major factors in the Cu NPs treated HepG2 cells to keep p53 active: 1) highly induced UCHL1 (p53 deubiquitinase) to keep p53 protein in un-ubiquitinated state to be active and 2) highly upregulated HSPA6 gene, whose protein will help p53 stay in the active conformation which enables p53 to function against ROS mediated oxidative stress.
There is evidence in the literature that NRF2 signaling cross-talks with p53 signaling to increase cells’ ability to reduce oxidative stress [31]. Under oxidative stress, NRF2 activation will lead to induction of NAD(P)H quinone dehydrogenase (NQO1) gene. This NQO1 protein will complex with p53 to stabilize it, leading to more active p53 signaling. One of p53 target genes, CDK interacting protein (p21cip), can bind to KEAP1, inhibiting KEAP1 mediated NRF2 ubiquitination and degradation, hence stabilize NRF2 [31]. Therefore, there is a positive feedback loop between these two signaling pathways (p53 and NRF2). In our experimental system, both p21cip and NQO1 were induced in Cu NPs treated samples but not in CuCl2 treated samples (Table 4). Induction of both these two genes (p21cip and NQO1) will make the induction of NRF2 and p53 signaling pathways even stronger. This is another indication that Cu NPs triggers more severe oxidative stress responses than CuCl2.
NRF2 and p53 are just two examples that demonstrate the wide effects of ubiquitination on the cell signaling pathway. There are other signaling pathways that heavily rely on ubiquitination for regulation of activities, for examples, cell cycle progression. Cyclin kinase inhibitors, e.g., p21cip, p27kip1, p57kip2 are all regulated by ubiquitination. Many proteins that are important in cell proliferation, cell cycle controls such as phosphatase and tensin homolog (PTEN), c-Myc, c-Jun, transforming growth factor beta receptor 1 (TGFBR1), Notch, mechanistic target of rapamycin (mTOR), NF-kappa-B essential modulator (NEMO also known as inhibitor of nuclear factor kappa-B kinase subunit gamma (IKK-γ, regulates nuclear factor kappa-light-chain-enhancer of activated B cells (NFκB)), and many more are regulated by ubiquitination [32, 33]. Because ubiquitination was the top affected pathway in this study of Cu NPs and CuCl2, there could be countless pathways affected through the ubiquitination process. In addition, there are cross-talks between these signaling pathways, so, these treatments of Cu NPs and CuCl2 can cause complicated signaling pathways changes.
Metallothionein genes
Nanoparticles of different metals have been reported to up-regulate the expression of metallothionein genes [34, 35]. There are two metallothionein genes (MT1 and MT2) in the liver that are inducible by metal exposure. There are different isoforms for each gene family. The protein expressed by these genes binds and detoxifies the effects of the heavy metals [36]. As expected, the expression of these two genes were induced in both Cu NPs (10- to 387-fold) and CuCl2 (no change to 229-fold) treated cells (Table 5).
Metallothionein has been shown to scavenge hydroxyl radicals in vitro, because of its cysteinyl thiolate groups, and act as antioxidant to reduced oxidative stress [37]. Cu NPs induced much higher expression of this group of genes than CuCl2 treatment, another indication that Cu NPs caused much higher oxidative stress than CuCl2.
MicroRNA expression
MicroRNAs (miRNA) regulates gene expression post-transcriptionally by binding to the target mRNAs in a sequence specific manner. One miRNA can regulate multiple genes and one gene can be regulated by multiple miRNAs. There are two ways that miRNA can regulate mRNA expression, one is by causing degradation of the mRNA and the other is just blocking the translation of that mRNA. In the latter case, the levels of that mRNA may not be different where total number of that transcript are measured either by microarray or RNA sequencing [15]. A large number of genes that are regulated by miRNAs seem to play important roles in signaling pathways, therefore, the miRNAs regulating them are playing important roles in regulating those signaling pathways.
1. MicroRNA-122
MicroRNA-122 is one of the microRNAs that is altered only by Cu NPs treatment, but not by CuCl2 treatments (Table 6). MicroRNA-122 is the most abundant microRNA in the liver and is considered liver-specific microRNA accounting for approximately 70% of the total miRNA population [38]. MicroRNA-122 regulates multiple signaling pathways including endoplasmic reticulum (ER) stress and unfolded protein response (UPR) signaling pathway [39]. Even though miR-122 expression level was only altered in Cu NPs 10 and 5 μg/ml treatments and not in any other treatments, ER stress and UPR were altered in lower concentration Cu NPs treatments and CuCl2 higher concentration treatments in IPA analysis but ranked lower and did not show up on the top 12 signaling pathways in Table 2 (data not shown). ER is a specialized organelle for the folding and trafficking of proteins. Alterations in the protein-folding environment cause accumulation of misfolded proteins in the ER that profoundly affect a variety of cellular signaling processes including energy production, inflammation, apoptosis, and reduction-oxidation homeostasis. Elevated ROS in the cells can induce ER stress, which then in turn, induces UPR. The expression patterns of the genes in the ER stress and UPR are very similar to the patterns of NRF-2 mediated oxidative stress response, indicating the ER stress and UPR might be a direct result of ROS. ER stress and UPR may lead to alterations in many downstream signaling pathways/adverse outcome pathways and eventually disease states. There are many studies from human liver and animal disease models that have indicated a crucial role of ER stress and the UPR signaling pathways in the pathogenesis of liver diseases [40]. There are reports showing the importance of miR-122 in liver homeostasis [41]. The expression of miR-122 is high in hepatocytes but is either silent or very low in human and mouse hepatocellular carcinoma [42].
Part of the reason why Cu NPs caused alteration in the ER stress and UPR could be that after the nanoparticles enter the cells, they are often physically present in the lysosomes and in the ER [43] and subsequently disrupt the normal function of both the ER and lysosomes. So, the physical presence of Cu NPs in lysosomes maybe one of the reasons it induced much higher ROS related parameters than any of the CuCl2 treatments.
2. MicroRNA-210
There are three other microRNA families altered by Cu NPs but not CuCl2, miR-15–16, miR-146b, and miR-210. MicroRNA-210 is a ROS induced microRNA, it is involved in regulating many signaling pathways including mitochondrial metabolism [44]. It targets the mitochondrial iron sulfur scaffold protein (ISCU). ISCU is required for assembly of iron-sulfur clusters, cofactors in Krebs cycle, electron transport, and iron metabolism [45]. MicroRNA-210 also regulates apoptosis by suppressing the expression of key molecules of apoptosis-related cell signaling pathways, including ISCU, Caspase 8 associated protein 2 (CASP8AP2), and SIN3 transcription regulator homolog A (SIN3A) [46, 47]. The expression of these three genes was altered more in Cu NPs 10 and 5 μg/ml treated samples than in CuCl2 treated samples (Table 7). These data suggest that in 10 and 5 μg/ml Cu NPs treated samples, Krebs cycle, mitochondrial functions, ion metabolism and apoptosis maybe altered by the alteration of miR-210 expression.
3. MicroRNA-15–16 family
The miR-15–16 is a family of tumor suppressor microRNA that inhibit cell proliferation, promote apoptosis of cancer cells and suppresses tumorigenicity. It exerts its tumor-suppressor function by targeting oncogenes such as Induced Myeloid Leukemia Cell Differentiation protein (MCL1), Cyclin D1 (CCND1), WNT family member 3 (WNT3) and others [48]. CCND1, WNT3 and MCL1 are altered in some of the Cu NPs and CuCl2 treated samples (Table 7). Thus, this family of microRNA are working to regulate the cell proliferation and apoptosis in these samples, mostly in the 2 highest dose of Cu NPs treated samples. Even though the miR-15–16 family is not altered in CuCl2 treated cells, some of their target genes are altered. There are changes in other genes whose expression may affect the expression of these genes. The HepG2 cells are probably still trying to return to homeostasis by activating different pathways/genes.
4. MicroRNA-146b
MicroRNA 146b, a microRNA in the microRNA-99 family, is down-regulated only in 10 μg/ml Cu NPs. It was reported that down-regulation of miR-146b by long non-coding RNA MALAT1 (metastasis associated lung adenocarcinoma transcript 1) in hepatocellular carcinoma promotes cancer growth and metastasis and its target is the TRAF6 (TNF receptor-associated factor 6) gene [49]. TRAF6 in turn, phosphorylates protein kinase B (PKB a.k.a. AKT), and phosphorylated AKT increased cell proliferation through induction of MCL1 and other genes. TRAF6 is up regulated in 5 μg/ml Cu NPs treated samples, and MCL1 is upregulated in both 5 and 10 μg/ml treated samples, indicating miR-146b may be partially responsible for inducing cell growth in these 2 samples (Table 7). MicroRNA-146b also regulates inflammation responses, apoptosis, autophagy [50, 51], some of these pathways are also affected by Cu NPs exposures. At 72 hours after treatments, MALAT1 was down-regulated by Cu NPs and was up-regulated by CuCl2, while MCL1 and TRAF6 were up-regulated by Cu NPs but down-regulated by CuCl2.
5. MicroRNA-34a
MiR-34a is induced by p53, and in turn suppresses Sirtuin 1 (SIRT 1, which suppresses p53), a feed-forward loop to enhance p53 activity [52]. MiR-34a also targets c-Met gene (a proto-oncogene, tyrosine-protein kinase Met or hepatocyte growth factor receptor, HGFR) [53]. When miR-34a is over-expressed, it will result in p53 mediated apoptosis and less hepatocyte growth. MicroRNA-34a is up-regulated in 3 of the Cu NPs and the highest dose of CuCl2 treated cells indicating that growth of these cells and the apoptosis signaling pathways could be altered by these treatments.
In summary, the microRNA expression analysis showed some microRNAs were only altered by Cu NPs, e.g., miR-15–16, miR-122, miR-146–5p and miR-210; some were altered only by CuCl2, e.g., miR-93–5p. There were many different signaling pathways altered, some of which work in opposition of each other. For example, both tumor suppressing microRNA and oncogenic microRNA are altered in both Cu NPs and CuCl2 treated samples. Similarly, both apoptosis and cell growth pathways are also altered. This demonstrates that HepG2 cells at 3 day of exposure are still displaying significant changes, and homeostasis has not yet been achieved.
MicroRNA Target Filter Analysis
MicroRNA Target Filter Analysis in IPA allows easy connection of microRNAs and their targets. We utilized this IPA analysis to find the interactions between our RNA data sets and miRNA data sets. The expression levels for genes and miRNAs in Cu NPs and CuCl2 microRNA target filter analyses are presented in Table 8. There are up- and down-regulation of the miRNAs/genes, and because it was only 3 days post treatment, most likely cells are still trying to reach homeostatic condition, and what we detected was just a disturbed expression state. Therefore, we pay more attention to the signaling pathways altered than the actual direction of the change, i.e., up- or down-regulation of the genes/miRNAs.
1. Cu NPs microRNA target filter analysis.
Figure 1 shows the MicroRNA Target Filter Analysis results from genes and microRNAs that are common to Cu NPs treatments. There are 3 nodes in this figure, node 1 to 3, and the center of each node is JUN, CIP2A (cancerous inhibitor of PP2A) and DNMT3B (DNA methyltransferase 3b), respectively.
Node 1: JUN, HMOX1, TGFBR2, KITLG, IGF1R, FBN1, miR-17 and miR-146a-5p
At the center of this node is the gene JUN, which encodes the protein c-JUN. JUN is a proto-oncogene which can be directly induced by ROS. JUN dimerizes with c-Fos to form Activator Protein 1 (AP-1) transcription factor. C-Fos is another gene that is up-regulated in all 4 Cu NPs and 3 μg/ml CuCl2 treated cells. AP-1 up-regulation increases cell proliferation/growth.
MicroRNA-146 was only altered in Cu NPs treated cells. MicroRNA-146 targets and suppresses TNF associated factor 6 (TRAF6), a ubiquitin conjugating enzyme that activates NFκB. Therefore, upregulation of miR-146 results in reduced TRAF6, hence, reduced NFκB signaling activity [54]. However, miR-146 is also induced by NFκB [55], so, there is a negative feed-back loop between NFκB and miR-146 to reduce the inflammation response once NFκB is activated [56].
MicroRNA 17, an oncogenic miRNA, regulates cell proliferation through targeting transforming growth factor beta receptor 2 (TGFBR2). TGFBR2 is one of the receptors for transforming growth factor beta and has important roles in signaling transduction of Transforming growth factor-beta (TGF-β). TGFBR2 dimerizes with TGFBR1, and TGF-βs binds to these dimerized receptors. This receptor/ligand complex then, phosphorylates SMAD proteins, and the phosphorylated SMADs, then, translocate into the nucleus and regulates gene expressions involved in cell proliferation, wound healing, fibrosis, tumorigenesis, inflammation and immunosuppression [57]. Fibrillin-1 (FBN1) is induced in the liver (in vivo) and liver cells (in vitro) by profibrogenic mediator TGF-β1 [58]. KIT ligand (KITLG) also called stem cell factor, and its receptor, c-Kit, a proto-oncogene, are important in hepatocyte proliferation. Insulin-like growth factor 1 receptor (IGF1R) is also involved cell proliferation and was recently shown to induce the expression of JUN gene [59]. In this node, signaling pathways related to cell proliferation, fibrosis, inflammation, tumorigenesis and immunity are altered by Cu NPs exposures.
Node 2: DNMT3B, RECK and miR-148a
DNA methyltransferase 3 beta (DNMT3B) encodes an enzyme that methylates DNA. DNA methylation is important in mammalian development. CpG methylation is an epigenetic modification that is important for embryonic development, imprinting, and X-chromosome inactivation [60]. Alteration in this DNA methylation gene indicates that the changes induced by the treatments can be carried into later biological stages or even the next generation. MicroRNA-148a, a member of the miR-148/152 family, has been found to be down-regulated in several tumor types and was suggested to be a tumor suppressor gene. This microRNA represses the expression of DNMT3B post-transcriptionally [61].
RECK (reversion-inducing cysteine-rich protein with Kazal motifs) plays an important role in the balance between destructive and constructive features of the extracellular matrix (ECM). RECK expression is correlated to new blood vessels formation in vivo [62]. The RECK gene is expressed widely in normal organs but is undetectable in many tumor-derived cell lines. When RECK gene is artificially introduced into tumor cell lines, RECK suppresses the invasive and metastatic activities [63]. RECK is regulated by the methylation of the promoter site. It has been reported that the hypermethylation of this gene resulted in less RECK mRNA, and also poor survival in hepatocellular carcinoma [64]. RECK also plays an important role in ER stress regulation by binding to and sequestering the ER stress sensor and activate ER stress [65].
In this node, DNA methylation (DNMT3B) regulates RECK gene expression. The expression of DNMT3B is regulated by miR-148a. RECK in turn, regulates ER stress, and ECM/angiogenesis.
Node 3: CIP2A, SQSTM1 and miR-375:
CIP2A is an oncogene that inactivates Protein Phosphatase 2A (PP2A). PP2A is a critical tumor suppressor, which suppresses the activity of AKT, MYC and E2F1 (E2 promoter binding factor 1) [66, 67]. CIP2A also up-regulates mTOR (mammalian target of rapamycin) and inhibits autophagy. CIP2A is polyubiquitinated and guided by Sequestosome 1 (SQSTM1/p62) to the autophagy machinery to be degraded [68]. Therefore, upregulation of SQSTM1/p62 will lead to lower activity of CIP2A. MicroRNA-375 is a tumor suppressor miRNA. It suppresses tumorigenesis through suppressing the expression of CIP2A [69] by reducing the translation of the gene. There are 5 functional binding sites for miR-375 on CIP2A mRNA [69].
SQSTM1/p62 is a multifunctional signaling hub and autophagy adaptor with many binding partners. SQSTM1/p62 is expressed in many cell types and accumulates in many human liver diseases, including nonalcoholic steatohepatitis (NASH) and hepatocellular carcinoma [70]. The expression of SQSTM1/p62 is induced by NRF2, NFκB [71, 72], Ras-ERK (extracellular-signal-regulated kinase), JNK (c-JUN N-terminal kinase) signaling [73] and ER stress [74]. SQSTM1/p62 in turn regulates NRF2, NFκB and mTOR which in turn affects ROS, inflammation, protein synthesis, cell proliferation and autophagy [70, 75]. SQSTM1/p62 is rapidly and constantly degraded by autophagy and elevated SQSTM1/p62 is used as an indicator of autophagy impairment [76]. In this node, signaling pathways affected are autophagy, oxidative stress (NRF2), inflammation (NFκB), mTOR/protein synthesis, cell proliferation and tumorigenesis.
In summary, from all 3 nodes of the MicroRNA target filter analysis of Cu NPs treated HepG2 cells, many signaling pathways such as inflammation, oxidative stress, cell proliferation, tumorigenesis, DNA methylation, protein synthesis (mTOR and AKT), immunity, fibrosis, tumorigenesis, ECM/angiogenesis, ER stress and autophagy are altered.
2. MicroRNA Target filter analysis results for CuCl2.
In MicroRNA Target Filter Analysis results from all CuCl2 treated samples, there are only 2 genes and 2 miRNAs: Cysteine and histidine containing domain 1 (CHORDC1), Run-related transcription factor 1 (RUNX1), miR-17 and miR-26a that are common to all CuCl2 treatments (Fig. 2). CHORDC1, cysteine and histidine rich domain containing 1, aka Morgana, is an essential component of the IκB kinase (IKK) complex. IKK complex plays a critical role in NFκB signaling and is consisted of IKK-a, IKK-b and IKK-g. CHORDC1 is required for IKK-b to induce phosphorylation on IκBα (NF-kappa-B inhibitor alpha). IκBα binds to and inhibits NFκB. But once phosphorylated by CHORDC1, it dissociates from NFκB, and NFκB becomes active, migrates to the nucleus and activates the expression of at least 150 genes for inflammation [77]. Therefore, upregulation of CHORDC1 gene up-regulates the NFκB signaling pathway, which in turn, up-regulates inflammation response. MicroRNA-26a binds to the 3’ untranslated region (3’ UTR) of CHORDC1 gene and decrease the protein translation, but the mRNA level of CHORDC1 is not affected [78].
Runt-related transcription factor 1 (RUNX1), also known as acute myeloid leukemia 1 (AML1), plays a role in the regulation of immune responses, cell proliferation, apoptosis, and cell cycle [79]. RUNX1 regulates NFκB pathway through interacting with IKK complex or by interaction with the NFκB subunit p50 [80]. Downregulation of RUNX1 attenuates immune response [81]. RUNX1 expression is suppressed by miR-17, the protein of RUNX1, in turn, repress the transcription of miR-17. This feedback loop would result in more miR-17 upregulation and further impair RUNX1 expression [82]. So, the genes and microRNAs in this graph revealed the common interactions for CuCl2 among all four concentrations mainly involved in inflammation through regulating NFκB signaling pathway.
In summary, the microRNA filter analysis is showing that Cu NPs and CuCl2 are affecting different genes/microRNAs in HepG2 cells. Cu NPs affected signaling pathways like inflammation, oxidative stress, cell proliferation, tumorigenesis, DNA methylation, protein synthesis (mTOR and AKT), immunity, fibrosis, tumorigenesis, ECM/angiogenesis, ER stress and autophagy. In contrast to Cu NPs, CuCl2 affected mainly the NFκB signaling pathway.
Biomarkers
Possible RNA biomarkers of effect for Cu NPs are presented in Table 9. Some of these RNA biomarkers are already well known in the literature to respond to extra cellular stressors and chemical exposures such as Cu NPs (HMOX-1, FOS, HSPA6, Growth Arrest and DNA Damage Inducible gamma (GADD45G), JUN and MT1M) [83, 84]. Other RNA study parameters that responded reliably and to a large extent among the four Cu NPs treatment groups and that are lesser known include GCLM, UCHL1, SQSTM1, DNMT3B and RECK. At lower exposures of Cu NPs (1.25 μg/ml), HMOX-1 (2 fold), UCHL1 (7.8 fold), GADD45 (28 fold) and HSPA6 (198 fold) still showed easy-to-detect elevations. However, at the highest exposure of 10 μg/ml Cu NPs, there were extremely large elevations in these three RNA parameters - HMOX-1 (70 fold), UCHL1 (115 fold), GADD45 (105 fold) and HSPA6 (1,430 fold), a useful property for effective biomarkers (Table 9). Among these genes, GADD45G and UCHL1 were only altered by Cu NPs and not by CuCl2; and may serve to distinguish Cu NPs from CuCl2 effects.
Table 9.
Possible mRNA biomarkers for Cu NPs and CuCl2 treatments in HepG2 cells.
| Chemical | Cu NPs | CuCl2 | ||||||
|---|---|---|---|---|---|---|---|---|
| dose (μg/ml) | 10 | 5 | 2.5 | 1.25 | 3 | 1 | 0.5 | 0.25 |
| HMOX-1 | 70 | 87 | 47 | 2.0 | 26 | nc | nc | nc |
| cFOS | 7.1 | 10 | 3.2 | 1.9 | 2.5 | nc | nc | nc |
| GCLM | 7.2 | 10.3 | 6.2 | 2.4 | 4.4 | nc | nc | −1.3 |
| SQSTM1 | 5.1 | 4.0 | 3.5 | 2.0 | 2.3 | nc | nc | 1.4 |
| DNMT3B | 4.6 | 5.2 | 3.3 | 1.7 | 2.4 | nc | nc | nc |
| RECK | −2.7 | −3.1 | −2.1 | −1.5 | −1.5 | nc | nc | nc |
| GADD45G | 105 | 149 | 90 | 28 | nc | nc | nc | nc |
| UCHL1 | 115 | 143 | 59 | 7.8 | nc | nc | nc | nc |
| HSPA6 | >1400 | >3300 | >1000 | 198 | 631 | nc | nc | nc |
| MT1M | 172 | 340 | 213 | 79 | 198 | nc | nc | nc |
nc= no change
Conclusions:
We treated human hepatocellular carcinoma (HepG2) cells with Cu NPs and CuCl2 at 4 different concentrations. The differentially expressed genes were put into Ingenuity Pathway Analysis to delineate the canonical pathways altered, and MicroRNA Target Filter Analysis in IPA was used to find mRNA and microRNA interactions that were altered by treatments.
From the mRNA expression analyses, our data showed that NRF2-mediated signaling pathway, ubiquitination pathway, p53 signaling are among the most significantly altered pathways. The expression patterns for NRF2 signaling, p53 signaling, ubiquitination pathways (UCHL1, HSPA6, NQO1 and p21cip1), and GSH synthesis (GCLC and GCLM) indicated that Cu NPs is causing a much stronger oxidative stress response than CuCl2 treatments.
From the microRNA expression analyses, the microRNA expression patterns were different between Cu NPs and CuCl2. Some of the microRNA altered by Cu NPs are involved in ER stress, UPR (miR-122), cell proliferation, apoptosis (miR-15/16 family, miR-210, miR-146b), and mitochondrial function, ion metabolism (miR-210). And signaling pathways that have effects oppose each other are altered pointing to the possibility that at 72 hours of treatments, the cells were probably still trying to get back to homeostasis.
From MicroRNA Target Filter Analysis, many more signaling pathways are altered in Cu NPs treated samples, including cell proliferation, DNA methylation, ER stress, fibrosis, autophagy, ROS, inflammation, tumorigenesis, ECM/angiogenesis and protein synthesis. In CuCl2 treated HepG2 samples, the MicroRNA Target Filter Analysis showed the main alteration was in inflammation regulation through NFκB signaling.
In summary, our data showed that Cu NPs can cause numerous and severe changes in signaling pathways, many of which may result in changes in ROS production, stress response, ubiquitination signaling, cell proliferation, and inflammation. The CuCl2 treatment elicited less sever and different changes in the treated cells. These differences indicated that the changes caused by Cu NPs were not mainly the results of nanomaterial dissolution to copper ions.
The long-term effects of these RNA changes await future in vitro and in vivo studies. We also report some new RNA expression data that can serve as biomarkers of Cu NPs treatment of human HCC cells.
Acknowledgements:
This paper is a product of the NHEERL nano-materials research team, directed by Dr. William Boyes that provided the resources and the opportunity to perform this research. We thank our colleagues, particularly Drs. Michael Hughes, Carl Blackman and Ms. Gail Nelson for helpful suggestions during the course of this work and manuscript review. We also thank Ms. Molly Windsor for her skillful, arty drawings of the figures.
Footnotes
Declaration of interest:
The authors declare that they have no potential conflicts of interest.
Disclaimer:
The information in this document has been funded wholly (or in part) by the U. S. Environmental Protection Agency. It has been subjected to review by the Biomolecular and Computational Toxicology Division in Center for Computational Toxicology and Exposure and approved for publication. Approval does not signify that the contents reflect the views of the Agency, nor does mention of trade names or commercial products constitute endorsement or recommendation for use.
References
- 1.Bahadar H, Maqbool F, Niaz K, Abdollahi M: Toxicity of Nanoparticles and an Overview of Current Experimental Models. Iran Biomed J 2016, 20(1):1–11. [DOI] [PMC free article] [PubMed] [Google Scholar]
- 2.Donaldson K, Stone V, Tran CL, Kreyling W, Borm PJ: Nanotoxicology. Occup Environ Med 2004, 61(9):727–728. [DOI] [PMC free article] [PubMed] [Google Scholar]
- 3.Oberdorster G, Maynard A, Donaldson K, Castranova V, Fitzpatrick J, Ausman K, Carter J, Karn B, Kreyling W, Lai D et al. : Principles for characterizing the potential human health effects from exposure to nanomaterials: elements of a screening strategy. Part Fibre Toxicol 2005, 2:8. [DOI] [PMC free article] [PubMed] [Google Scholar]
- 4.Chen Z, Meng H, Xing G, Chen C, Zhao Y, Jia G, Wang T, Yuan H, Ye C, Zhao F et al. : Acute toxicological effects of copper nanoparticles in vivo. Toxicol Lett 2006, 163(2):109–120. [DOI] [PubMed] [Google Scholar]
- 5.Lei R, Wu C, Yang B, Ma H, Shi C, Wang Q, Wang Q, Yuan Y, Liao M: Integrated metabolomic analysis of the nano-sized copper particle-induced hepatotoxicity and nephrotoxicity in rats: a rapid in vivo screening method for nanotoxicity. Toxicol Appl Pharmacol 2008, 232(2):292–301. [DOI] [PubMed] [Google Scholar]
- 6.Liao M, Liu H: Gene expression profiling of nephrotoxicity from copper nanoparticles in rats after repeated oral administration. Environ Toxicol Pharmacol 2012, 34(1):67–80. [DOI] [PubMed] [Google Scholar]
- 7.Kitchin KT, Richards JA, Robinette BL, Wallace KA, Coates NH, Castellon BT, and Grulke EA: Biochemical effects of copper nanomaterials in human hepatocellular carcinoma (HepG2) cells. J Cell Biology and Toxicology 2020. (In Press). [DOI] [PubMed] [Google Scholar]
- 8.Tang HX, Lue M, Zhao J, Ye L, Shi G, Lr F, Chen C, Wang H, Y. and Li Y: Liver toxicity assessments in rats following sub-chronic oral exposure to copper nanoparticles. Environmental Science Europe 2019, 31(30). [Google Scholar]
- 9.Kitchin KT, Richards JA, Robinette BL, Wallace KA, Coates NH, Castellon BT, Grulke EA, Kou J & Varma RS: Biochmical effects of silver nanomaterials in human hepatocellular carcinoma (HepG2) cells. Journal of Nanoscience and Nanotechnology 2020. (in Press). [DOI] [PMC free article] [PubMed] [Google Scholar]
- 10.Thai SF, Wallace K. A., Jones CP, Ren H, Castellon BT, Crooks J, Grulke EA, Kitchin KT: Differential Genomic Effects on Signaling Pathways by Two Different CeO2 Nanoparticles in HepG2 Cells. J Nanosci Nanotechnol 2015, 15(12):9925–9937. [DOI] [PubMed] [Google Scholar]
- 11.Porter DKS, Wolfarth W, Jefferson A, Sshwegler-Berry D, M. and V. C : A biocompatible medium for nanoparticle dispersion. Nanotoxicology 2008, 2:144. [Google Scholar]
- 12.Friedlander MR, Mackowiak SD, Li N, Chen W, Rajewsky N: miRDeep2 accurately identifies known and hundreds of novel microRNA genes in seven animal clades. Nucleic Acids Res 2012, 40(1):37–52. [DOI] [PMC free article] [PubMed] [Google Scholar]
- 13.Love MI, Huber W, Anders S: Moderated estimation of fold change and dispersion for RNA-seq data with DESeq2. Genome Biol 2014, 15(12):550. [DOI] [PMC free article] [PubMed] [Google Scholar]
- 14.Benjamini Y, Hochberg Y: Controlling the False Discovery Rate - a Practical and Powerful Approach to Multiple Testing. J Roy Stat Soc B Met 1995, 57(1):289–300. [Google Scholar]
- 15.Cai Y, Yu X, Hu S, Yu J: A brief review on the mechanisms of miRNA regulation. Genomics Proteomics Bioinformatics 2009, 7(4):147–154. [DOI] [PMC free article] [PubMed] [Google Scholar]
- 16.Sharma K, Joshi N, Goyal C: Critical review of Ayurvedic Varnya herbs and their tyrosinase inhibition effect. Anc Sci Life 2015, 35(1):18–25. [DOI] [PMC free article] [PubMed] [Google Scholar]
- 17.Jeevanandam J, Barhoum A, Chan YS, Dufresne A, Danquah MK: Review on nanoparticles and nanostructured materials: history, sources, toxicity and regulations. Beilstein J Nanotechnol 2018, 9:1050–1074. [DOI] [PMC free article] [PubMed] [Google Scholar]
- 18.Iavicoli I, Calabrese EJ, Nascarella MA: Exposure to nanoparticles and hormesis. Dose Response 2010, 8(4):501–517. [DOI] [PMC free article] [PubMed] [Google Scholar]
- 19.Thai SF, Jones CP, Nelson GB, Vallanat B, Killius M, Crooks JL, Ward WO, Blackman CF, Ross JA: Differential Effects of Nano TiO(2) and CeO(2) on Normal Human Lung Epithelial Cells In Vitro. J Nanosci Nanotechnol 2019, 19(11):6907–6923. [DOI] [PMC free article] [PubMed] [Google Scholar]
- 20.Li N, Xia T, Nel AE: The role of oxidative stress in ambient particulate matter-induced lung diseases and its implications in the toxicity of engineered nanoparticles. Free Radic Biol Med 2008, 44(9):1689–1699. [DOI] [PMC free article] [PubMed] [Google Scholar]
- 21.Lu SC: Glutathione synthesis. Biochim Biophys Acta 2013, 1830(5):3143–3153. [DOI] [PMC free article] [PubMed] [Google Scholar]
- 22.Lee JI, Kang J, Stipanuk MH: Differential regulation of glutamate-cysteine ligase subunit expression and increased holoenzyme formation in response to cysteine deprivation. Biochem J 2006, 393(Pt 1):181–190. [DOI] [PMC free article] [PubMed] [Google Scholar]
- 23.Manna P, Ghosh M, Ghosh J, Das J, Sil PC: Contribution of nano-copper particles to in vivo liver dysfunction and cellular damage: role of IkappaBalpha/NF-kappaB, MAPKs and mitochondrial signal. Nanotoxicology 2012, 6(1):1–21. [DOI] [PubMed] [Google Scholar]
- 24.Arnal N, de Alaniz MJ, Marra CA: Effect of copper overload on the survival of HepG2 and A-549 human-derived cells. Hum Exp Toxicol 2013, 32(3):299–315. [DOI] [PubMed] [Google Scholar]
- 25.Lecker SH, Goldberg AL, Mitch WE: Protein degradation by the ubiquitin-proteasome pathway in normal and disease states. J Am Soc Nephrol 2006, 17(7):1807–1819. [DOI] [PubMed] [Google Scholar]
- 26.Motohashi H, Yamamoto M: Nrf2-Keap1 defines a physiologically important stress response mechanism. Trends Mol Med 2004, 10(11):549–557. [DOI] [PubMed] [Google Scholar]
- 27.Li L, Tao Q, Jin H, van Hasselt A, Poon FF, Wang X, Zeng MS, Jia WH, Zeng YX, Chan AT et al. : The tumor suppressor UCHL1 forms a complex with p53/MDM2/ARF to promote p53 signaling and is frequently silenced in nasopharyngeal carcinoma. Clin Cancer Res 2010, 16(11):2949–2958. [DOI] [PubMed] [Google Scholar]
- 28.Xiang T, Li L, Yin X, Yuan C, Tan C, Su X, Xiong L, Putti TC, Oberst M, Kelly K et al. : The ubiquitin peptidase UCHL1 induces G0/G1 cell cycle arrest and apoptosis through stabilizing p53 and is frequently silenced in breast cancer. PLoS One 2012, 7(1):e29783. [DOI] [PMC free article] [PubMed] [Google Scholar]
- 29.Gu Y, Lv F, Xue M, Chen K, Cheng C, Ding X, Jin M, Xu G, Zhang Y, Wu Z et al. : The deubiquitinating enzyme UCHL1 is a favorable prognostic marker in neuroblastoma as it promotes neuronal differentiation. J Exp Clin Cancer Res 2018, 37(1):258. [DOI] [PMC free article] [PubMed] [Google Scholar]
- 30.Hageman J, van Waarde MA, Zylicz A, Walerych D, Kampinga HH: The diverse members of the mammalian HSP70 machine show distinct chaperone-like activities. Biochem J 2011, 435(1):127–142. [DOI] [PubMed] [Google Scholar]
- 31.Rotblat B, Melino G, Knight RA: NRF2 and p53: Januses in cancer? Oncotarget 2012, 3(11):1272–1283. [DOI] [PMC free article] [PubMed] [Google Scholar]
- 32.Haglund K, Dikic I: Ubiquitylation and cell signaling. EMBO J 2005, 24(19):3353–3359. [DOI] [PMC free article] [PubMed] [Google Scholar]
- 33.Teixeira LK, Reed SI: Ubiquitin ligases and cell cycle control. Annu Rev Biochem 2013, 82:387–414. [DOI] [PubMed] [Google Scholar]
- 34.Bulcke F, Dringen R: Copper oxide nanoparticles stimulate glycolytic flux and increase the cellular contents of glutathione and metallothioneins in cultured astrocytes. Neurochem Res 2015, 40(1):15–26. [DOI] [PubMed] [Google Scholar]
- 35.Luther EM, Schmidt MM, Diendorf J, Epple M, Dringen R: Upregulation of metallothioneins after exposure of cultured primary astrocytes to silver nanoparticles. Neurochem Res 2012, 37(8):1639–1648. [DOI] [PubMed] [Google Scholar]
- 36.Calvo J, Jung H, Meloni G: Copper metallothioneins. IUBMB Life 2017, 69(4):236–245. [DOI] [PubMed] [Google Scholar]
- 37.Sato M, Bremner I: Oxygen free radicals and metallothionein. Free Radic Biol Med 1993, 14(3):325–337. [DOI] [PubMed] [Google Scholar]
- 38.Jopling C: Liver-specific microRNA-122: Biogenesis and function. RNA Biol 2012, 9(2):137–142. [DOI] [PMC free article] [PubMed] [Google Scholar]
- 39.Yang F, Zhang L, Wang F, Wang Y, Huo XS, Yin YX, Wang YQ, Zhang L, Sun SH: Modulation of the unfolded protein response is the core of microRNA-122-involved sensitivity to chemotherapy in hepatocellular carcinoma. Neoplasia 2011, 13(7):590–600. [DOI] [PMC free article] [PubMed] [Google Scholar]
- 40.Ziaoying Liu RMG: Endoplasmic reticulum stress and liver diseases. Liver Research 2019, 3(1):55–64. [DOI] [PMC free article] [PubMed] [Google Scholar]
- 41.Xu H, He JH, Xiao ZD, Zhang QQ, Chen YQ, Zhou H, Qu LH: Liver-enriched transcription factors regulate microRNA-122 that targets CUTL1 during liver development. Hepatology 2010, 52(4):1431–1442. [DOI] [PubMed] [Google Scholar]
- 42.Kutay H, Bai S, Datta J, Motiwala T, Pogribny I, Frankel W, Jacob ST, Ghoshal K: Downregulation of miR-122 in the rodent and human hepatocellular carcinomas. J Cell Biochem 2006, 99(3):671–678. [DOI] [PMC free article] [PubMed] [Google Scholar] [Retracted]
- 43.Behzadi S, Serpooshan V, Tao W, Hamaly MA, Alkawareek MY, Dreaden EC, Brown D, Alkilany AM, Farokhzad OC, Mahmoudi M: Cellular uptake of nanoparticles: journey inside the cell. Chem Soc Rev 2017, 46(14):4218–4244. [DOI] [PMC free article] [PubMed] [Google Scholar]
- 44.Bavelloni A, Ramazzotti G, Poli A, Piazzi M, Focaccia E, Blalock W, Faenza I: MiRNA-210: A Current Overview. Anticancer Res 2017, 37(12):6511–6521. [DOI] [PubMed] [Google Scholar]
- 45.Favaro E, Ramachandran A, McCormick R, Gee H, Blancher C, Crosby M, Devlin C, Blick C, Buffa F, Li JL et al. : MicroRNA-210 regulates mitochondrial free radical response to hypoxia and krebs cycle in cancer cells by targeting iron sulfur cluster protein ISCU. PLoS One 2010, 5(4):e10345. [DOI] [PMC free article] [PubMed] [Google Scholar]
- 46.Kim HW, Haider HK, Jiang S, Ashraf M: Ischemic preconditioning augments survival of stem cells via miR-210 expression by targeting caspase-8-associated protein 2. J Biol Chem 2009, 284(48):33161–33168. [DOI] [PMC free article] [PubMed] [Google Scholar]
- 47.Yang W, Sun T, Cao J, Liu F, Tian Y, Zhu W: Downregulation of miR-210 expression inhibits proliferation, induces apoptosis and enhances radiosensitivity in hypoxic human hepatoma cells in vitro. Exp Cell Res 2012, 318(8):944–954. [DOI] [PubMed] [Google Scholar]
- 48.Pekarsky Y, Croce CM: Role of miR-15/16 in CLL. Cell Death Differ 2015, 22(1):6–11. [DOI] [PMC free article] [PubMed] [Google Scholar]
- 49.Li C, Miao R, Liu S, Wan Y, Zhang S, Deng Y, Bi J, Qu K, Zhang J, Liu C: Down-regulation of miR-146b-5p by long noncoding RNA MALAT1 in hepatocellular carcinoma promotes cancer growth and metastasis. Oncotarget 2017, 8(17):28683–28695. [DOI] [PMC free article] [PubMed] [Google Scholar]
- 50.Gao S, Zhao Z, Wu R, Wu L, Tian X, Zhang Z: MiR-146b inhibits autophagy in prostate cancer by targeting the PTEN/Akt/mTOR signaling pathway. Aging (Albany NY) 2018, 10(8):2113–2121. [DOI] [PMC free article] [PubMed] [Google Scholar]
- 51.Tahamtan A, Teymoori-Rad M, Nakstad B, Salimi V: Anti-Inflammatory MicroRNAs and Their Potential for Inflammatory Diseases Treatment. Front Immunol 2018, 9:1377. [DOI] [PMC free article] [PubMed] [Google Scholar]
- 52.Yamakuchi M, Lowenstein CJ: MiR-34, SIRT1 and p53: the feedback loop. Cell Cycle 2009, 8(5):712–715. [DOI] [PubMed] [Google Scholar]
- 53.Li N, Fu H, Tie Y, Hu Z, Kong W, Wu Y, Zheng X: miR-34a inhibits migration and invasion by down-regulation of c-Met expression in human hepatocellular carcinoma cells. Cancer Lett 2009, 275(1):44–53. [DOI] [PubMed] [Google Scholar]
- 54.Paik JH, Jang JY, Jeon YK, Kim WY, Kim TM, Heo DS, Kim CW: MicroRNA-146a downregulates NFkappaB activity via targeting TRAF6 and functions as a tumor suppressor having strong prognostic implications in NK/T cell lymphoma. Clin Cancer Res 2011, 17(14):4761–4771. [DOI] [PubMed] [Google Scholar]
- 55.Taganov KD, Boldin MP, Chang KJ, Baltimore D: NF-kappaB-dependent induction of microRNA miR-146, an inhibitor targeted to signaling proteins of innate immune responses. Proc Natl Acad Sci U S A 2006, 103(33):12481–12486. [DOI] [PMC free article] [PubMed] [Google Scholar]
- 56.Habibi F, Ghadiri Soufi F, Ghiasi R, Khamaneh AM, Alipour MR: Alteration in Inflammation-related miR-146a Expression in NF-KB Signaling Pathway in Diabetic Rat Hippocampus. Adv Pharm Bull 2016, 6(1):99–103. [DOI] [PMC free article] [PubMed] [Google Scholar]
- 57.Engel ME, Datta PK, Moses HL: Signal transduction by transforming growth factor-beta: a cooperative paradigm with extensive negative regulation. J Cell Biochem Suppl 1998, 30–31:111–122. [PubMed] [Google Scholar]
- 58.Lorena D, Darby IA, Reinhardt DP, Sapin V, Rosenbaum J, Desmouliere A: Fibrillin-1 expression in normal and fibrotic rat liver and in cultured hepatic fibroblastic cells: modulation by mechanical stress and role in cell adhesion. Lab Invest 2004, 84(2):203–212. [DOI] [PubMed] [Google Scholar]
- 59.Aleksic T, Gray N, Wu X, Rieunier G, Osher E, Mills J, Verrill C, Bryant RJ, Han C, Hutchinson K et al. : Nuclear IGF1R Interacts with Regulatory Regions of Chromatin to Promote RNA Polymerase II Recruitment and Gene Expression Associated with Advanced Tumor Stage. Cancer Res 2018, 78(13):3497–3509. [DOI] [PMC free article] [PubMed] [Google Scholar]
- 60.Auclair G, Guibert S, Bender A, Weber M: Ontogeny of CpG island methylation and specificity of DNMT3 methyltransferases during embryonic development in the mouse. Genome Biol 2014, 15(12):545. [DOI] [PMC free article] [PubMed] [Google Scholar]
- 61.Duursma AM, Kedde M, Schrier M, le Sage C, Agami R: miR-148 targets human DNMT3b protein coding region. RNA 2008, 14(5):872–877. [DOI] [PMC free article] [PubMed] [Google Scholar]
- 62.Takahashi C, Sheng Z, Horan TP, Kitayama H, Maki M, Hitomi K, Kitaura Y, Takai S, Sasahara RM, Horimoto A et al. : Regulation of matrix metalloproteinase-9 and inhibition of tumor invasion by the membrane-anchored glycoprotein RECK. Proc Natl Acad Sci U S A 1998, 95(22):13221–13226. [DOI] [PMC free article] [PubMed] [Google Scholar]
- 63.Furumoto K, Arii S, Mori A, Furuyama H, Gorrin Rivas MJ, Nakao T, Isobe N, Murata T, Takahashi C, Noda M et al. : RECK gene expression in hepatocellular carcinoma: correlation with invasion-related clinicopathological factors and its clinical significance. Reverse-inducing--cysteine-rich protein with Kazal motifs. Hepatology 2001, 33(1):189–195. [DOI] [PubMed] [Google Scholar]
- 64.Zhang C, Ling Y, Zhang C, Xu Y, Gao L, Li R, Zhu J, Fan L, Wei L: The silencing of RECK gene is associated with promoter hypermethylation and poor survival in hepatocellular carcinoma. Int J Biol Sci 2012, 8(4):451–458. [DOI] [PMC free article] [PubMed] [Google Scholar]
- 65.Chen Y, Tsai YH, Tseng SH: HDAC Inhibitors and RECK Modulate Endoplasmic Reticulum Stress in Tumor Cells. Int J Mol Sci 2017, 18(2). [DOI] [PMC free article] [PubMed] [Google Scholar]
- 66.Soofiyani SR, Hejazi MS, Baradaran B: The role of CIP2A in cancer: A review and update. Biomed Pharmacother 2017, 96:626–633. [DOI] [PubMed] [Google Scholar]
- 67.Janghorban M, Farrell AS, Allen-Petersen BL, Pelz C, Daniel CJ, Oddo J, Langer EM, Christensen DJ, Sears RC: Targeting c-MYC by antagonizing PP2A inhibitors in breast cancer. Proc Natl Acad Sci U S A 2014, 111(25):9157–9162. [DOI] [PMC free article] [PubMed] [Google Scholar]
- 68.Bjorkoy G, Lamark T, Johansen T: p62/SQSTM1: a missing link between protein aggregates and the autophagy machinery. Autophagy 2006, 2(2):138–139. [DOI] [PubMed] [Google Scholar]
- 69.Jung HM, Patel RS, Phillips BL, Wang H, Cohen DM, Reinhold WC, Chang LJ, Yang LJ, Chan EK: Tumor suppressor miR-375 regulates MYC expression via repression of CIP2A coding sequence through multiple miRNA-mRNA interactions. Mol Biol Cell 2013, 24(11):1638–1648, S1631–1637. [DOI] [PMC free article] [PubMed] [Google Scholar]
- 70.Taniguchi K, Yamachika S, He F, Karin M: p62/SQSTM1-Dr. Jekyll and Mr. Hyde that prevents oxidative stress but promotes liver cancer. FEBS Lett 2016, 590(15):2375–2397. [DOI] [PMC free article] [PubMed] [Google Scholar]
- 71.Jain A, Lamark T, Sjottem E, Larsen KB, Awuh JA, Overvatn A, McMahon M, Hayes JD, Johansen T: p62/SQSTM1 is a target gene for transcription factor NRF2 and creates a positive feedback loop by inducing antioxidant response element-driven gene transcription. J Biol Chem 2010, 285(29):22576–22591. [DOI] [PMC free article] [PubMed] [Google Scholar]
- 72.Ling J, Kang Y, Zhao R, Xia Q, Lee DF, Chang Z, Li J, Peng B, Fleming JB, Wang H et al. : KrasG12D-induced IKK2/beta/NF-kappaB activation by IL-1alpha and p62 feedforward loops is required for development of pancreatic ductal adenocarcinoma. Cancer Cell 2012, 21(1):105–120. [DOI] [PMC free article] [PubMed] [Google Scholar]
- 73.Puissant A, Robert G, Fenouille N, Luciano F, Cassuto JP, Raynaud S, Auberger P: Resveratrol promotes autophagic cell death in chronic myelogenous leukemia cells via JNK-mediated p62/SQSTM1 expression and AMPK activation. Cancer Res 2010, 70(3):1042–1052. [DOI] [PubMed] [Google Scholar]
- 74.Liu XD, Ko S, Xu Y, Fattah EA, Xiang Q, Jagannath C, Ishii T, Komatsu M, Eissa NT: Transient aggregation of ubiquitinated proteins is a cytosolic unfolded protein response to inflammation and endoplasmic reticulum stress. J Biol Chem 2012, 287(23):19687–19698. [DOI] [PMC free article] [PubMed] [Google Scholar]
- 75.Carroll B, Otten EG, Manni D, Stefanatos R, Menzies FM, Smith GR, Jurk D, Kenneth N, Wilkinson S, Passos JF et al. : Oxidation of SQSTM1/p62 mediates the link between redox state and protein homeostasis. Nat Commun 2018, 9(1):256. [DOI] [PMC free article] [PubMed] [Google Scholar]
- 76.Jiang P, Mizushima N: LC3- and p62-based biochemical methods for the analysis of autophagy progression in mammalian cells. Methods 2015, 75:13–18. [DOI] [PubMed] [Google Scholar]
- 77.Fusella F, Secli L, Busso E, Krepelova A, Moiso E, Rocca S, Conti L, Annaratone L, Rubinetto C, Mello-Grand M et al. : The IKK/NF-kappaB signaling pathway requires Morgana to drive breast cancer metastasis. Nat Commun 2017, 8(1):1636. [DOI] [PMC free article] [PubMed] [Google Scholar]
- 78.Zhao F, Xu G, Zhou Y, Wang L, Xie J, Ren S, Liu S, Zhu Y: MicroRNA-26b inhibits hepatitis B virus transcription and replication by targeting the host factor CHORDC1 protein. J Biol Chem 2014, 289(50):35029–35041. [DOI] [PMC free article] [PubMed] [Google Scholar]
- 79.Zhang L, Fried FB, Guo H, Friedman AD: Cyclin-dependent kinase phosphorylation of RUNX1/AML1 on 3 sites increases transactivation potency and stimulates cell proliferation. Blood 2008, 111(3):1193–1200. [DOI] [PMC free article] [PubMed] [Google Scholar]
- 80.Tang X, Sun L, Wang G, Chen B, Luo F: RUNX1: A Regulator of NF-kB Signaling in Pulmonary Diseases. Curr Protein Pept Sci 2018, 19(2):172–178. [DOI] [PMC free article] [PubMed] [Google Scholar]
- 81.Luo MC, Zhou SY, Feng DY, Xiao J, Li WY, Xu CD, Wang HY, Zhou T: Runt-related Transcription Factor 1 (RUNX1) Binds to p50 in Macrophages and Enhances TLR4-triggered Inflammation and Septic Shock. J Biol Chem 2016, 291(42):22011–22020. [DOI] [PMC free article] [PubMed] [Google Scholar]
- 82.Rossetti S, Sacchi N: RUNX1: A microRNA hub in normal and malignant hematopoiesis. Int J Mol Sci 2013, 14(1):1566–1588. [DOI] [PMC free article] [PubMed] [Google Scholar]
- 83.Zhou X, Zhao L, Luo J, Tang H, Xu M, Wang Y, Yang X, Chen H, Li Y, Ye G et al. : The Toxic Effects and Mechanisms of Nano-Cu on the Spleen of Rats. Int J Mol Sci 2019, 20(6). [DOI] [PMC free article] [PubMed] [Google Scholar]
- 84.Marra M, Sordelli IM, Lombardi A, Lamberti M, Tarantino L, Giudice A, Stiuso P, Abbruzzese A, Sperlongano R, Accardo M et al. : Molecular targets and oxidative stress biomarkers in hepatocellular carcinoma: an overview. J Transl Med 2011, 9:171. [DOI] [PMC free article] [PubMed] [Google Scholar]