

Abstract
Aims
MicroRNAs play a role in pathogenic mechanisms leading to heart failure. We measured a panel of 754 miRNAs in the myocardial tissue and in the serum of patients with heart failure with reduced ejection fraction due to dilatative idiopathic cardiomyopathy (DCM, N = 10) or ischaemic cardiomyopathy (N = 3), referred to left ventricular assist device implant. We aim to identify circulating miRNAs with high tissue co‐expression, significantly associated to echocardiographic and haemodynamic measures.
Methods and results
We have measured a panel of 754 miRNAs in the myocardial tissue [left ventricular (LV) apex] and in the serum obtained at the same time in a well selected study population of end‐stage heart failure with reduced ejection fraction due to either DCM or ischaemic cardiomyopathy, referred to continuous flow left ventricular assist device implant. We observed moderate agreement for miR‐30d, miR‐126‐3p, and miR‐483‐3p. MiR‐30d was correlated to LV systolic as well as diastolic volumes (r = 0.78, P = 0.001 and r = 0.80, P = 0.005, respectively), while miR‐126‐3p was associated to mPAP and PCWP (r = −0.79, P = 0.007 and r = −0.80, P = 0.005, respectively). Finally, serum miR‐483‐3p had an association with right ventricular end diastolic diameter (r = −0.73, P = 0.02) and central venous pressure (CVP) (r − 0.68 p 0.03).
Conclusions
In patients with DCM, few miRNAs are co‐expressed in serum and tissue: They are related to LV remodelling (miR‐30d), post‐capillary pulmonary artery pressure (miR‐126‐3p), and right ventricular remodelling/filling pressures (miR‐483‐3p). Further studies are needed to confirm their role in diagnosis, prognosis or as therapeutic targets in heart failure with reduced ejection fraction.
Keywords: Biomarkers, Cardiomyopathy, Diagnosis, Heart failure, MicroRNAs, Prognosis
Introduction
Heart failure with reduced ejection fraction (HFrEF) is a multi‐faceted and life‐threatening syndrome characterized by significant morbidity and mortality, poor functional capacity and quality of life, and high costs, affecting more than 64 million people worldwide. 1
MicroRNAs (miRNA, ∼22 nucleotides in length) are involved in several cell processes by repressing messenger RNA (mRNA) translation, thus modulating gene expression. A variety of miRNAs play a role in pathogenic mechanisms leading to heart failure, such as remodelling, hypertrophy, and apoptosis. 2 , 3 However, the inconsistency of miRNA expression limits their clinical application. In the present study, we have measured a panel of 754 miRNAs in the myocardial tissue [left ventricular (LV) apex] and in the serum obtained at the same time in a well selected study population of end‐stage HFrEF due to either dilatative idiopathic cardiomyopathy (DCM) or ischaemic cardiomyopathy (ICM), referred to continuous flow left ventricular assist device (CF‐LVAD) implant.
In summary, aims of present study were twofold: (i) to define a panel of miRNAs that are consistently down‐ or up‐regulated in non‐ischaemic dilatative cardiomyopathy and (ii) to identify oligonucleotides of immediate clinical usefulness as diagnostic and prognostic biomarkers or potential therapeutic targets, by assessing association with laboratory, echocardiographic, or haemodynamic measures.
Methods
Study population
After Bioethical Committee approval, starting November 2010, all HFrEF patients referred to HeartWare HVAD/CF‐LVAD (HeartWare, Oakville, California) implantation at IRCCS ISMETT have been included in a centralized registry, built on clinical, biochemical, imaging and cath‐lab data, collected as a result of the standard pre‐operative work‐up routinely performed on our study population. The investigation conforms with the principles outlined in the Declaration of Helsinki (Br Med J 1964;ii:177). Written, informed consent was obtained for all patients enrolled. Patients with HFrEF due to non‐dilatative cardiomyopathy (N = 2), or patients judged unsuitable to left ventricular assist device (LVAD, N = 22) by the Heart Team, were excluded. In conclusion, 13 patients with advanced HFrEF due to dilatative cardiomyopathy were enrolled and divided into two groups, according to the aetiology: Group 1 patients with non‐ischaemic (DCM, N = 10) and Group 2 patients with ischaemic (ICM, N = 3) dilatative cardiomyopathy. Although we measured and compared either serum as well as tissue miRNAs levels in both groups, agreement analysis was performed on DCM group only, as the most represented and statistically significant. All LVAD implants in our study were performed electively, and in order to minimize risk of acute right ventricular (RV) failure post‐implant, all patients by protocol were admitted 3 days ahead of surgery, to undergo IV diuretic therapy as needed to grant euvolemic status in the operating room.
Collected variables
Demographic, clinical, and echocardiographic data were collected within 72 h preceding the LVAD implant, while invasive haemodynamic measurements by right heart catheterization were obtained 5–7 days ahead of surgery. Blood withdrawal for miRNAs and biochemical measurements were performed within 2 h preceding the LVAD implant.
Standard echocardiography
All echocardiographic examinations were performed within 24 h from right heart catheterization, and a commercially available instrument (Vivid E90 System; Vingmed, General Electric, Milwaukee, Wisconsin) was used. Standard LV systolic and diastolic parameters from 2D and Doppler echocardiography, as well as pulsed‐wave tissue Doppler imaging of the mitral medial annulus, were acquired and measured as previously described. 4 To obtain tricuspid annulus plane systolic excursion, the apical 4‐chamber view was used, and an M‐mode cursor was placed through the lateral tricuspid annulus in real time. RV systolic pressure was calculated by inserting the tricuspid regurgitation velocity, obtained with continuous‐wave Doppler, into the simplified Bernoulli equation.
Right heart catheterization
The pressure transducers were balanced before data acquisition with the zero level at mid‐axillary line. Pulmonary artery (PA) catheters were used to measure PA pressure (P) systolic (s), mean (m), diastolic (d), mean central venous pressure and pulmonary capillary wedge pressure (PCWP). Cardiac output and cardiac index were derived by the thermodilution technique and by the Fick equation through sampling of a mixed central venous blood gas taken in the PA and of an arterial blood gas. The varying RR intervals in patients with atrial fibrillation data from 10 consecutive beats were averaged.
Blood sampling and RNA preparation
Blood samples were collected and processed for all the subject involved in the study within 4 h after collection. Briefly, 10 mL of blood was collected, and 500 μL aliquots of whole blood were stored in long‐term storage cryogenic vials at 80°C until use.
Standard LVAD/HVAD implant requires resection of a large portion of the left ventricular (LV) apex. The tissues obtained in the operating room were harvested and immediately snap frozen using 100% ethanol and dry ice and stored at −80°C until used.
Total RNA from whole blood was extracted using the RiboPure™‐Blood RNA Purification Kit (Thermo Fisher Scientific, Loughborough, UK) and following the manufacturer's instructions. Total RNA from biopsies was isolated using miRVana microRNA isolation kit (Thermo Fisher Scientific, Waltham, MA, USA). Frozen tissue samples were weighed and processed on ice to prevent thawing. In preparation for RNA extraction, 5–10 mg of tissue was added to 700 μL of lysis buffer. Samples were homogenized using a TissueLyser II (Qiagen) with 5 mm stainless steel beads for 3 × 1 min cycles at 30 Hz, with resting on ice in between. Homogenates were subjected to a single freeze/thaw cycle to aid cell lysis and then cleared by centrifugation at 10 000× g for 5 min at 4°C. RNA extractions were performed according to manufacturer's instructions. RNA was eluted in 35 μL of RNase free water and stored at −80°C. The quantity of isolated RNA was subsequently determined by spectrophotometry using a ND‐1000 NanoDrop (Thermo Fisher Scientific, Waltham, MA 02451 USA), and quality was assessed using a Tapestation 2200 (Agilent Technologies, CA, USA).
MicroRNA profiling
TaqMan low‐density arrays for miRNAs profiling
MicroRNA profiling of samples was done with TaqMan Array Human MicroRNA panels A and B (Life Technologies, Thermo Fisher Scientific) to analyse 754 human miRNAs. Reverse transcription and pre‐amplification were done following the manufacturer's instructions (Life Technologies, Thermo Fisher Scientific). QRT‐PCR was performed with the Applied Biosystems 7900 HT Real‐Time PCR system. For each miRNA, the expression level was determined by the equation 2−ΔΔCT.
Data analysis
Descriptive statistics, group comparisons, and agreement analysis were all performed using STATA version 17.1 (Stata‐Corp LP, College Station, TX). Collected variables including miRNA levels in serum and myocardial tissue were compared between Group 1 (DCM) and 2 (ICM) using the two‐sided t‐test or the Mann–Whitney test according to normal/non‐normal distribution and Fisher exact test for categorical variables. Serum and tissue levels of miRNAs and serum levels of NT‐proBNP, blood urea nitrogen, creatinine, and alanine transaminase were log‐transformed, and Shapiro–Wilk test was used to assure the distributional assumptions (see Table S3).
Paired Wilcoxon rank sum test was used to compare expression of each miRNA in serum and tissue, in both DCM and ICM groups, respectively, and post hoc Bonferroni correction was used to counteract the multiple comparison issue, while linear regression, Bland–Altman plots, 5 intra‐class correlation coefficients, 6 and concordance correlation coefficients 7 were used to test agreement between serum and myocardial tissue expression for each microRNA, considering just patients in Group 1 (DCM group). Finally, focusing on the DCM group only, Spearman's linear correlation was used to test covariance between miRNAs and collected standard biochemical, echocardiographic, or haemodynamic markers of advanced HFrEF. Data are presented as mean (SD), median (interquartile range [IQR]), or number (percentage). A difference was considered statistically significant at α level of 0.05.
Results
Clinical, laboratory, echocardiographic, and right heart catheterization characteristics
Demographic, clinical, and laboratory characteristics were comparable in recruited patients, irrespective to HFrEF aetiology (Table 1 ). In particular, prevalence of NYHA III/IV or INTERMACS 1–3 classes, as well as number of patients referred to CRT‐D and on guideline‐directed medical therapy was comparable between Groups 1 and 2. Most patients needed high dose diuretics, and BNP levels were abnormally high in both groups.
Table 1.
Demographic, laboratory, echocardiography, and right heart catheterization description
| Demographic and Laboratory | ||||
|---|---|---|---|---|
| All patients | Idiopathic dilatative cardiomyopathy | Ischaemic dilatative cardiomyopathy | P‐value | |
| Mean ± SD, N (%), or median (IQR) | (N = 13) | (N = 10) | (N = 3) | |
| Age (years) | 56 ± 9 | 60 ± 3 | 55.4 ± 10.2545 | 0.40 |
| Females, N (%) | 2 (15) | 2 (20) | 0.57 | |
| Body mass index | 27.7 ± 3.8 | 23.8 ± 2.8 | 28.5605 ± 3.5835 | 0.11 |
| Body surface area (cm2) | 1.9 ± 0.2 | 1.8 ± 0.2 | 1.9324 ± 0.184 | 0.33 |
| Systolic blood pressure (mmHg) | 97 ± 11 | 89 ± 11.3 | 98.9 ± 11.2096 | 0.39 |
| Diastolic blood pressure (mmHg) | 58 ± 11 | 62 ± 16 | 57.6 ± 10.4584 | 0.45 |
| Heart rate (b.p.m.) | 84 ± 16 | 93 ± 8 | 82.2 ± 16.9036 | 0.39 |
| NYHA III/IV, N (%) | 9 (90) | 8 (89) | 2 (67) | 0.90 |
| INTERMACS Class 1 | 1 (8) | 1 (10) | 1 (33) | 1.00 |
| Class 2 | 2 (17) | 2 (20) | 2 (67) | |
| Class 3 | 5 (42) | 4 (40) | 0 (0) | |
| Class 4 | 4 (33) | 3 (30) | 0 (0) | |
| Intra‐cardiac defibrillator, N (%) | 11 (85) | 8 (80) | 3 (100) | 1.00 |
| Cardiac resynch. therapy, N (%) | 3 (23) | 2 (20) | 1 (33) | 0.68 |
| ACE inhibitors/angiotensin receptor blockers, N (%) | 7 (58) | 5 (50) | 2 (67) | 0.09 |
| Beta‐blockers, N (%) | 9 (75) | 8 (80) | 1 (33) | 0.45 |
| Mineralocorticoid receptor antagonists N (%) | 7 (58) | 7 (70) | 2 (67) | 0.15 |
| High dose furosemide N (%) | 12 (92) | 9 (90) | 2 (67) | 0.98 |
| Serum albumin, g/dL | 3.2 (3.05, 3.5) | 3.2 (3, 3.6) | 3.35 (3.3, 3.4) | 0.39 |
| Serum ALT, U/Lit | 32.5 (23, 52) | 34 (24, 62) | 25.5 (19, 32) | 0.28 |
| Serum AST, U/Lit | 25 (18, 30.5) | 25 (18, 31) | 23 (17, 29) | 0.52 |
| Brain natriuretic peptide, ng/Lit | 4246 (2044.5, 11 200) | 5502.5 (2150, 11,600) | 2298 (1147, 3449) | 0.20 |
| Blood urea nitrogen, mg/dL | 39 (35, 42) | 39 (34, 43) | 38 (36, 40) | 0.75 |
| Total cholesterol (serum), mg/dL | 146 (113.5, 170) | 146 (114, 168) | 150 (113, 187) | 0.83 |
| Serum creatinine, mg/dL | 1.1 (0.95, 1.15) | 1.05 (0.9, 1.2) | 1.1 (1.1, 1.1) | 0.66 |
| Haemoglobin, g/L | 10.55 (9.85, 11.75) | 10.65 (10, 12.1) | 9.9 (9.1, 10.7) | 0.39 |
| Haematocrit, % | 33.75 (31.7, 36.5) | 34.7 (31.8, 36.8) | 30.9 (27.7, 34.1) | 0.28 |
| International normalized ratio | 1.05 (1.02, 1.1) | 1.055 (1.01, 1.07) | 1.08 (1.03, 1.13) | 0.75 |
| Serum sodium, mEq/L | 136 (134, 139) | 137.5 (136, 139) | 131.5 (128, 135) | 0.09 |
| Platelets, 10 3 /mm 3 | 197 (158.5, 256) | 185 (151, 253) | 293.5 (214, 373) | 0.13 |
| Serum total bilirubin, mg/dL | 0.85 (0.71, 1.4) | 1.01 (0.72, 1.4) | 0.64 (0.51, 0.77) | 0.20 |
| Serum uric acid, mg/dL | 5.9 (4, 8.4) | 5.9 (4.3, 7.4) | 6.15 (3.9, 8.4) | 0.81 |
| Glomerular filtration rate (MDRD), mL/min | 68.2 (63.6, 76.6) | 67.8 (62.8, 77.3) | 68.5 (68.1, 68.9) | 0.83 |
| Echocardiography | ||||
| Left ventricular (LV) end diastolic diameter, mm | 71 ± 10 | 69.5 ± 19.09 | 71.3 ± 9.4 | 0.67 |
| Left ventricular (LV) end diastolic diameter index, mm/m2 | 37 ± 4.8 | 37.2181 ± 6.7 | 37.0 ± 4.76 | 1.00 |
| LV end systolic diameter, mm | 65 ± 10.8 | 62.5 ± 17.7 | 66.2 ± 9.5 | 0.44 |
| LV end systolic diameter index, mm/m2 | 32.9 ± 3.5 | 33.4561 ± 6.3 | 32.7 ± 2.9 | 1.00 |
| LV end diastolic volume, mL | 318.8 ± 93.9 | 346 ± 9.9 | 313.4 ± 102.9 | 0.39 |
| LV end diastolic volume index, mL/m2 | 166.3 ± 46.2 | 188.04 ± 23.5 | 162.01 ± 49.2 | 0.39 |
| LV end systolic volume, mL | 249.2 ± 83.4 | 284 ± 7.1 | 242.2 ± 90.4 | 0.39 |
| LV end systolic volume index, mL/m2 | 129.8 ± 40.7 | 153.9 ± 11.04 | 125.03 ± 43.1 | 0.28 |
| LV ejection fraction, % | 22 ± 5.8 | 17.5 ± 3.5 | 23.06 ± 5.8 | 0.24 |
| Left atrial volume, mL | 128.4 ± 31.4 | 161 ± 74.9 | 121.9 ± 17.2 | 0.52 |
| Left atrial volume index, mL/m2 | 67 ± 15.2 | 85.4 ± 32.2 | 63.32 ± 8.7 | 0.28 |
| Mitral regurgitation (moderate/severe), N (%) | 4 (25) | 3 (30) | 1(33) | 0.27 |
| Right ventricular end diastolic diameter (base, mm) | 41.1 ± 7.3 | 42 ± 7.4 | 39 ± 8.5 | 0.37 |
| Right ventricular fractional area change, % | 42 ± 14 | 41 ± 14 | 48 ± 17 | 0.56 |
| Right ventricular tricuspid annular plane systolic excursion, mm | 20.6 ± 5.3 | 18.5 ± 9.2 | 21 ± 4.9 | 0.52 |
| Tricuspid regurgitation (moderate/severe), N (%) | 3 (19) | 2 (20) | 1 (33) | 1.00 |
| Right atrial area, cm2 | 19.9 ± 5.2 | 17 ± 11.3 | 20.5 ± 4.1 | 0.83 |
| Right atrial pressure (estimated), mmHg | 8.5 ± 3.2 | 7.5 ± 3.5 | 8.8 ± 3.3 | 0.63 |
| Right heart catheterization | ||||
| Cardiac output, L/min | 3.9 ± 0.8 | 4.65 ± 0.5 | 3.8 ± 0.8 | 0.09 |
| Cardiac index, L/min/m2 | 2.1 ± 0.5 | 2.5 ± 0.5 | 2.04 ± 0.47 | 0.20 |
| Central venous pressure, mmHg | 8.2 ± 5.1 | 3.5 ± 2.1 | 9.1 ± 5.04 | 0.10 |
| Pulmonary artery pressure (systolic), mmHg | 52.4 ± 16.4 | 32 ± 5.7 | 58.3 ± 13.2 | 0.06 |
| Pulmonary artery pressure (mean), mmHg | 37.5 ± 10.6 | 28 ± 4.2 | 39.4 ± 10.6 | 0.13 |
| Pulmonary artery pressure (diastolic), mmHg | 31.5 ± 10.7 | 25 ± 2.8 | 33.4 ± 11.5 | 0.24 |
| Pulmonary capillary wedge pressure, mmHg | 23.6 ± 4.9 | 20.5 ± 3.5 | 24.3 ± 5.0 | 0.19 |
Cardiac chambers were dilated, and LV ejection fraction was significantly reduced in all enrolled patients, and similarly in ischaemic or non‐ischaemic HFrEF aetiology.
Right heart catheterization showed low cardiac index and high right and left ventricular filling pressures, as detected by CVP and PCWP, respectively. sPAP was greater in Group 2 as compared to Group 1 patients, the difference being marginally significant.
MicroRNA serum and myocardial tissue expression profiles in patients with dilatative idiopathic cardiomyopathy versus ischaemic cardiomyopathy
MiRNA expression patterns in serum and myocardial tissues in Group 1 and Group 2 are presented in Tables 2 and 3 , Table S1a and S1b, and Figure 1 A–E .
Table 2.
Comparison of miRNA expression in serum and myocardial tissue between patients with idiopathic and ischaemic cardiomyopathy
| microRNAs expression in serum (circulating) | microRNAs expression in myocardial tissue | P‐values, Group 1 vs. Group 2 | ||||||
|---|---|---|---|---|---|---|---|---|
| Median (IQR) | All patients (N = 13) | Idiopathic CMP (Group 1, N = 10) | Ischaemic CMP (Group 2, N = 3) | All patients (N = 13) | Idiopathic CMP (Group 1, N = 10) | Ischaemic CMP (Group 2, N = 3) | Serum | Tissue |
| miR‐1260 | 0.0099 (0.0006, 0.0232) | 0.0167 (0.0044, 0.0361) | 0 (0, 0.0073) | 0.1087 (0.0004, 1.0731) | 0.1902 (0.0004, 1.0731) | 0.0012 (0, 1.6508) | 0.043 | 0.612 |
| miR‐139‐3p | 0.0056 (0.0021, 0.0071) | 0.0063 (0.0054, 0.009) | 0.0021 (0.0002, 0.0022) | 0.0416 (0.0103, 0.1632) | 0.0449 (0.0103, 0.1632) | 0.0192 (0.0006, 2.4112) | 0.043 | 0.735 |
| miR‐148b | 0.0001 (0, 0.0002) | 0.0002 (0.0001, 0.0003) | 0 (0, 0) | 0.0026 (0.0013, 0.0103) | 0.0025 (0.0013, 0.0103) | 0.0048 (0.0006, 0.0693) | 0.043 | 0.735 |
| miR‐15b | 0.001 (0.0008, 0.0037) | 0.0027 (0.001, 0.0043) | 0.0001 (0.0001, 0.0008) | 0.0103 (0.0024, 0.0131) | 0.0109 (0.0024, 0.0214) | 0.0086 (0.0006, 0.0113) | 0.043 | 0.31 |
| miR‐193b | 0.031 (0.0129, 0.0403) | 0.0321 (0.0209, 0.0419) | 0.0122 (0.0043, 0.029) | 0.0335 (0.0111, 0.0901) | 0.0267 (0.0111, 0.0901) | 0.0335 (0.0006, 0.1502) | 0.043 | 0.866 |
| miR‐197 | 0.0126 (0.0008, 0.0235) | 0.0182 (0.0076, 0.0238) | 0.0003 (0.0001, 0.0027) | 0.2176 (0.0454, 0.8761) | 0.3395 (0.0454, 0.8761) | 0.2054 (0.0006, 1.1071) | 0.028 | 0.735 |
| miR‐30c | 0.0766 (0.0141, 0.3027) | 0.2044 (0.016, 0.4548) | 0.0076 (0.0005, 0.0289) | 0.2732 (0.024, 0.5908) | 0.3126 (0.024, 0.5908) | 0.0384 (0.0006, 2.1133) | 0.043 | 0.735 |
| miR‐328 | 0.0009 (0.0002, 0.0054) | 0.0028 (0.0007, 0.0067) | 0.0001 (0, 0.0002) | 0.1182 (0.0543, 0.2308) | 0.1278 (0.0666, 0.2308) | 0.0543 (0.0006, 0.2675) | 0.028 | 0.499 |
| miR‐331 | 0.0112 (0.0022, 0.0247) | 0.0175 (0.0032, 0.032) | 0.001 (0.0001, 0.0058) | 0.0166 (0.0065, 0.3999) | 0.1025 (0.0065, 0.3999) | 0.0113 (0.0006, 1.5522) | 0.043 | 0.612 |
| miR‐378‐3p | 0.0001 (0, 0.0002) | 0.0002 (0.0001, 0.0002) | 0 (0, 0) | 0.0024 (0.0006, 0.0201) | 0.0023 (0.0004, 0.0591) | 0.0024 (0.0012, 0.0041) | 0.028 | 0.866 |
| miR‐378‐5p | 0.0111 (0.0045, 0.0291) | 0.0191 (0.0073, 0.0313) | 0.0002 (0, 0.0048) | 0.0146 (0.0046, 0.0439) | 0.0158 (0.0046, 0.0439) | 0.0093 (0.0018, 0.0721) | 0.028 | 0.866 |
| miR‐423‐3p | 0.0002 (0.0001, 0.0003) | 0.0002 (0.0001, 0.0005) | 0.0001 (0.0001, 0.0001) | 0.0131 (0.0026, 0.0378) | 0.026 (0.0026, 0.0416) | 0.0039 (0.0006, 0.0086) | 0.043 | 0.176 |
| miR‐532‐3p | 0.0005 (0.0002, 0.0009) | 0.0007 (0.0002, 0.0009) | 0.0002 (0.0001, 0.0005) | 0.0103 (0.0026, 0.0224) | 0.0134 (0.0054, 0.0416) | 0.0006 (0.0006, 0.0086) | 0.063 | 0.043 |
| miR‐625‐3p | 0.0005 (0.0004, 0.0007) | 0.0006 (0.0005, 0.001) | 0.0004 (0, 0.0004) | 0.02 (0.0036, 0.0286) | 0.0201 (0.0036, 0.0286) | 0.017 (0.0012, 0.0971) | 0.043 | 0.866 |
| miR‐720 | 0.3384 (0.0723, 1.0532) | 0.5696 (0.2112, 1.9087) | 0.0014 (0, 0.2642) | 7.9413 (1.6295, 18.457) | 9.8106 (1.6295, 20.0701) | 3.3519 (0.0097, 14.3779) | 0.043 | 0.31 |
| miR‐92a | 0.0013 (0.0002, 0.0047) | 0.0028 (0.0002, 0.0058) | 0.0001 (0.0001, 0.0004) | 0.5291 (0.3655, 1.3686) | 0.5962 (0.4945, 1.3686) | 0.3655 (0.0006, 1.8314) | 0.043 | 0.398 |
| miR‐99b | 0.0059 (0.0007, 0.0117) | 0.0073 (0.0016, 0.0157) | 0.0003 (0.0001, 0.0029) | 0.0103 (0.0026, 0.111) | 0.0111 (0.0026, 0.111) | 0.01 (0.0006, 1.8756) | 0.043 | 0.866 |
Table 3.
Agreement analysis of microRNA expression in serum and myocardial tissue, stratified by groups
| Median (IQR) | All patients together (N = 13) | Dilatative non‐ischaemic CMP (N = 10) | Dilatative ischaemic CMP (N = 3) | ||||||
|---|---|---|---|---|---|---|---|---|---|
| R 2 (linear regress.) | Concordance corr. coeff. | Intra‐class corr coeff. | R 2 (linear regress.) | Concordance corr. coeff. | Intra‐class corr coeff. | R 2 (linear regress.) | Concordance corr. coeff. | Intra‐class corr coeff. | |
| miR‐30d | 0.712 | 0.359 | 0.35 | 0.712 | 0.345 | 0.34 | 0.918 | −0.237 | 0.14 |
| miR‐126‐3p | 0.149 | −0.329 | 0.25 | 0.103 | −0.285 | 0.31 | 0.980 | −0.206 | 0.23 |
| miR‐483‐3p | 0.122 | 0.003 | −0.39 | 0.394 | 0.005 | −0.37 | 0.083 | −0.003 | −0.30 |
Figure 1.
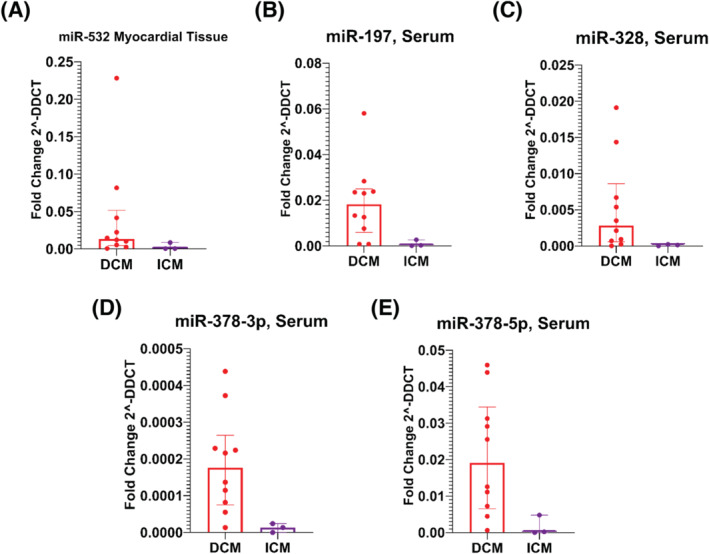
Bar graphs of different miRNAs expression profiles in serum and tissue, by groups [dilatative idiopathic cardiomyopathy (DCM) versus ischaemic cardiomyopathy (ICM)], expressed as median ± IQR.
According to adjusted P‐values, miR‐532‐3p was the only miRNA measured in myocardial tissue, with a different expression profile between groups, being highly expressed in patients with DCM as compared with patients with ICM. Such difference was only marginally significant considering serum levels of miR‐532‐3p (Table 2 and Figure 1 A ). On the other hand, several circulating miRNAs had different expression profile between groups; in particular, miR‐1260a, miR‐139‐3p, miR‐148b‐3p, miR‐15b, miR‐193b‐3p, miR‐197‐3p, miR‐30c‐5p, miR‐328‐3p, miR‐331‐3p, miR‐378a‐5p, miR‐378‐3p, miR‐423‐3p, miR‐625‐3p, miR‐720, miR‐92a‐3p, and mir‐99b‐5p, had a greater expression profile in DCM as compared to ICM (Table 2 and Figure 1 B–E ).
Agreement analysis of myocardial tissue and serum expression profile for each miRNA
Consistently with unpaired comparisons, paired analysis has shown significantly different values in serum and myocardial tissue expression for most of the collected miRNAs, specifically in the DCM group (Table S1a). According to the agreement analysis, miR‐30d had the greatest agreement in tissue and serum expressions in the DCM group, although the agreement level was at most moderate (concordance correlation coefficient = 0.34, intra‐class correlation coefficient = 0.35, see Table 3 and Figure 2 A ). Mild to moderate agreement between tissue and serum expression profiles was also present for miR‐126‐3p, and miR‐483‐3p (Figure 2 B–D ).
Figure 2.
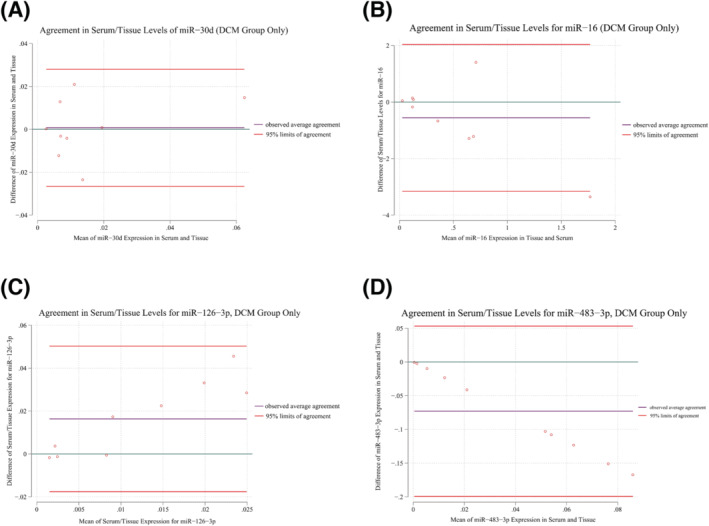
Bland–Altman plots of agreement analysis between serum and myocardial tissue expression profile, DCM group only.
Correlation analysis with demographic, laboratory, echocardiographic, and right heart catheterization measurements
No miRNA, expressed either in myocardial tissue or circulating, had association with BNP levels. Limiting the analysis to the DCM group (the most represented, by number of patients) Spearman's correlation analysis showed positive, significant, and moderate association between miR‐30d expression and LV end systolic as well as end‐diastolic volumes, and the observation was consistent looking at both myocardial tissue and serum expression profile (Table 4a and 4b , and Figure 3 A,B ). Circulating miR‐126‐3p was negatively and moderately associated to both mPAP and PCWP (Table 2 b and Figure 3 C,D , association with both sPAP and dPAP showed a similar trend but was only marginally significant). Finally, serum miR‐483‐3p had a moderate inverse association with RV end diastolic diameter and area, as well as with central venous pressure.
Table 4a.
Correlation between consistent tissue miRNAs and demographic, Lab, ECHO or RHC variables (idiopathic cardiomyopathy group only, N = 10)
| Pearson's correl. coefficient (r) | Tissue miR‐30d | |
|---|---|---|
| r | P‐value | |
| Brain natriuretic peptide | 0.38 | 0.278 |
| LV ejection fraction | −0.236 | 0.511 |
| LV end systolic diameter | 0.478 | 0.415 |
| LV end systolic diameter index | 0.281 | 0.647 |
| LV end diastolic volume | 0.8 | 0.005 |
| LV end diastolic volume Index | 0.759 | 0.011 |
| LV end systolic volume | 0.781 | 0.008 |
| LV end systolic volume index | 0.745 | 0.013 |
| Left atrial volume | −0.365 | 0.3 |
| Right atrial area | 0.233 | 0.517 |
| Right ventricular end diastolic diameter | 0.455 | 0.186 |
| Cardiac index | −0.307 | 0.389 |
| Cardiac output | −0.249 | 0.488 |
| Central venous pressure | 0.477 | 0.163 |
| Systolic pulmonary artery pressure | 0.009 | 0.984 |
| Pulmonary capillary wedge pressure | 0.018 | 0.96 |
Table 4b.
Correlation between consistent serum (circulating) miRNAs and demographic, Lab, ECHO or RHC variables (idiopathic cardiomyopathy group only, N = 10)
| Pearson's correl. coefficient (r) | Serum miR‐30d | Serum miR‐126‐3p | Serum miR‐483‐3p | |||
|---|---|---|---|---|---|---|
| r | P‐value | r | P‐value | r | P‐value | |
| Brain natriuretic peptide | 0.254 | 0.479 | −0.133 | 0.714 | −0.296 | 0.407 |
| LV ejection fraction | −0.314 | 0.377 | −0.313 | 0.378 | 0.176 | 0.628 |
| LV end diastolic volume | 0.677 | 0.032 | −0.161 | 0.657 | −0.188 | 0.602 |
| LV end diastolic volume index | 0.507 | 0.135 | −0.011 | 0.977 | −0.105 | 0.773 |
| LV end systolic volume | 0.69 | 0.027 | −0.089 | 0.806 | −0.203 | 0.574 |
| Left atrial volume | −0.085 | 0.816 | 0.022 | 0.952 | 0.519 | 0.124 |
| Right atrial volume | 0.408 | 0.242 | −0.283 | 0.428 | −0.615 | 0.059 |
| Right ventricular end diastolic diameter | 0.229 | 0.525 | −0.315 | 0.375 | −0.734 | 0.016 |
| RV end diastolic area | 0.359 | 0.309 | 0.039 | 0.916 | −0.646 | 0.043 |
| Central venous press. | 0.611 | 0.06 | −0.555 | 0.096 | −0.685 | 0.029 |
| Cardiac output | −0.214 | 0.553 | 0.09 | 0.804 | −0.031 | 0.933 |
| Cardiac index | −0.374 | 0.287 | 0.314 | 0.377 | 0.065 | 0.858 |
| Systolic pulmonary artery pressure | −0.291 | 0.527 | −0.725 | 0.065 | 0.314 | 0.493 |
| Diastolic pulmonary artery pressure | −0.593 | 0.161 | −0.731 | 0.062 | 0.097 | 0.836 |
| Mean pulmonary artery pressure | 0.181 | 0.617 | −0.787 | 0.007 | −0.235 | 0.513 |
| Pulmonary capillary wedge pressure | −0.073 | 0.841 | −0.803 | 0.005 | −0.095 | 0.793 |
Figure 3.
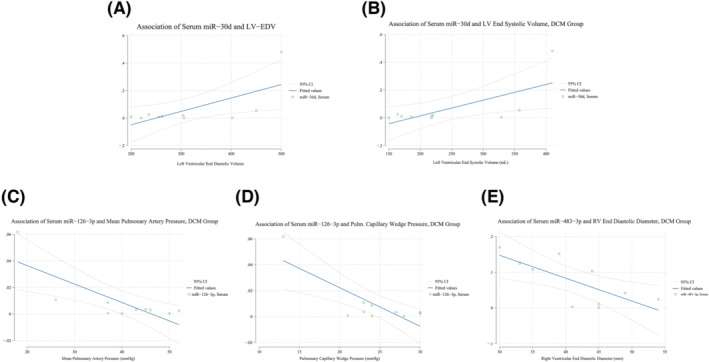
Linear regression plots of circulating miRNAs and laboratory, echocardiographic or right heart catheterization measurements, dilatative non‐ischaemic cardiomyopathy (DCM) group only.
Considering all patients together (both DCM and ICM groups, N = 13), tissue miR‐30d was positively associated to atrial volumes as measured by ECHO (r = 0.64, P = 0.02 and r = 0.62, P = 0.03 for left and right atrial volume, respectively, Table S2b ), while both serum miR‐126‐3p and miR‐483‐3p had a negative and moderate association with right atrial area and volume (Table S2d ). Finally, tissue miR‐483‐3p was inversely related to both central venous pressure and cardiac output, and serum miR‐483‐3p was inversely related to central venous pressure, as well as right atrial and RV dimensions.
Discussion
To our knowledge, this is the first study to have tested agreement between serum and myocardial tissue expression profile for an extensive number of microRNAs in patients with end stage HFrEF due to DCM or ICM. Furthermore, covariation with laboratory, echocardiographic, and invasively assessed haemodynamic measures was assessed as well.
The current investigation has several main findings. First, miRNA expression profile in LV myocardial tissue is comparable in patients with end‐stage HFrEF due to either DCM or ICM and does not seem influenced, at such advanced stage, by the initial aetiology of dilatative cardiomyopathy. Although agreement between tissue and serum expression was acceptable for a minimal subset of the collected miRNAs only, and of moderate degree, miR‐30d was higher in DCM patients with greater LV dimensions, in both tissue and serum, and considering either LV systolic or diastolic volumes, irrespectively of BNP level. Furthermore, circulating miR‐126‐3p was lower in patients with the highest levels of mPAP and PCWP, suggesting a relation of such oligonucleotide with endothelial dysfunction affecting pulmonary vascular bed in our population. Finally, miR‐483‐3p was down‐regulated in patients with the highest RV filling pressure (as detected by CVP) and most dilated right cardiac chambers (both right atrium and ventricle), possibly for a rise in after‐load due to a combination of primary LV systolic impairment and pathological vasoconstriction in the lung small arteries.
miR‐532‐3p (myocardial tissue)
Looking at the myocardial tissue and serum expression profiles, miR‐532‐3p was the only up‐regulated miRNA in the LV myocardial tissue of DCM patients as compared with ICM group. This is, at some extent, consistent with Li et al. 8 who reported that in patients with advanced dilatative cardiomyopathy, more than half of the dysregulated miRNAs in the heart had normal circulating levels. Besides, as we have, by study design, enrolled patients with such an advanced HFrEF to make artificial LV pump (i.e. CF‐LVAD) implantation mandatory, it is reasonable to hypothesize that miRNA expression from myocardial cells at such advanced stage of disease is more related to terminal LV remodelling and dysfunction, and thus less dependent on the initial pathogenesis of the disease; in other words, miRNA dysregulation comparing DCM or ICM at this stage may be inapparent. However, it is interesting to note that miR‐532‐3p seems to have a protective action, up‐regulating the caspase recruitment domain (ARC) in mouse heart and cardiomyocytes upon doxorubicin (an antitumor drug with cardiotoxic side effect) treatment. 9
Besides, differently from tissue expression profile, and consistently with previous reports, several circulating microRNAs were differently expressed in our patients as well, being mainly up‐regulated in DCM group as compared with ICM group. This is not unexpected considering the reported high variability of circulating miRNAs in the literature. Nevertheless, it is reassuring that the up‐regulated miRNAs in serum of DCM patients are all cardiac‐enriched miRNAs: circulating miR‐197 up‐regulation has been recently reported in a cohort of patients with stage C or D HFrEF (due to both non‐ischaemic and ischaemic cardiomyopathy). In the same study, serum levels were also associated with myocardial fibrosis detected by late gadolinium enhanced cardiac MRI, and miR‐197 was an independent predictor of major adverse cardiovascular events in that population. 10 MiR‐328 has an established role in determining adverse electrical remodelling in atrial fibrillation. 11 Also, in a mouse model of cardiac fibrosis following myocardial infarct, miR‐328 up‐regulation applied a potent pro‐fibrotic effect, and it was identified as a determinant of cardiac fibrosis in diseased heart, possibly by targeting TGFβRIII. 12 Finally, miR‐378‐3p/5p has been reported to repress cardiomyocyte hypertrophy by the mitogen‐activated protein kinases pathway. 13 Although it is difficult to explain the observed up‐regulation of such miRNA in DCM patients as compared with ICM group, it is possible to hypothesize that miR‐378‐3p/5p might be involved in a compensatory action, with the scope of contrasting severe LV dysfunction, a pathway that is, for some reason, more effective in patients with non‐ischaemic cardiomyopathy as compared with ICM.
In order to identify circulating miRNAs that can be effectively used as diagnostic or prognostic biomarkers of LV structure or function, we have deployed several, well established, statistical metrics 14 to assess agreement between tissue and serum expression. In order to reduce risk of type I error, we have limited such analysis to the most represented DCM group of patients, excluding patients with ischaemic cardiomyopathy upfront. Such agreement is mild to moderate at most, and significant for just three miRNAs out of the pool of microRNAs that was tested initially. This is not necessarily disappointing, as we focus now on an affordable number of oligonucleotides with promising role in end‐stage HFrEF pathophysiology.
miR‐30d (serum)
The miR‐30 family is abundantly expressed in the heart. 15 The miRNAs belonging to the family share the same seed sequence but have different compensatory sequences near the 3′ end, allowing the miR‐30 family members to target different genes and therefore diverse biological pathway. 16 Although the role of several components of the family (i.e. miR‐30, 17 miR‐30a, 18 miR‐30c, 19 and miR‐30e 20 ) in the pathophysiology of LV hypertrophy or dilatation due to different aetiologies has already been reported, in our study, miR‐30d seems to be specifically associated to LV remodelling in HFrEF: Melman et al. have elegantly demonstrated that miR‐30d expression is up‐regulated in response to the increased ventricular wall stress due to dyssynchrony but decreases with the concomitant decrease in wall stress after resynchronization. 21 Moreover, overexpression of miR‐30d in cardiomyocytes mediates cardiomyocyte growth, with molecular features most consistent with adaptive hypertrophy, at the same time inhibiting TNF‐α‐mediated apoptosis in cardiomyocytes, suggesting that miR‐30d may be protective against the maladaptive effects of TNF‐α. Others have highlighted the role of miR‐30d in the process of extra‐cellular matrix fibrosis by regulating TGF‐β1 and CTGF protein levels. 22 Clinically, miR‐30d has been tested also as prognostic biomarker: In a cohort of patients with acute HF followed‐up for 1 year, not only serum miR‐30d was significantly higher in patients who survived, but it was an independent and the most significant predictor of cardiovascular mortality. 23 Consistently with heretofore mentioned reports, we observed positive and high correlation between miR‐30d expression and either systolic or diastolic LV volumes in patients with end‐stage HFrEF and dilative cardiomyopathy, either idiopathic or ischaemic, and it is reassuring to confirm such association in both myocardial tissue and serum. Unfortunately, we could not compare miR‐30d signature with a control group, but it is tempting to speculate that our patients could overcome the severe LV impairment, and reach LVAD implant, in part because their cardiomyocytes were able to produce effectively protective circulating miR‐30d. Finally, it is noteworthy to report the lack of covariance in miR‐30d and BNP levels, suggesting they act on different and perhaps complementary compensatory mechanisms to counteract LV failure/maladaptive remodelling.
miR‐126‐3p (serum)
MiR‐126 is one of the most highly expressed miRNA in the vascular endothelium and highly preserved in lung and heart vasculature. 24 Both microRNA‐126‐3p and microRNA‐126‐5p have protective vascular function: miR‐126‐3p promotes angiogenic growth factor signalling during endothelial repair through targeting Spred1, VCAM‐1, and PIK3R2. Reduced circulating levels of miR‐126‐3p testify an altered balance between angiogenic growth versus endothelial repair capacity and have been observed in patients with acute myocardial Infarct due to unstable coronary atherosclerotic plaques as well as in patients with cardiac allograft vasculopathy developed after heart transplant. 25 In the present study, we extend the above‐mentioned reports showing for the first time a negative and high association between circulating miR‐126‐3p and mPAP as well as PCWP (similar trend was observed with systolic and diastolic PAP, but it was only marginally significant). It is well known that LV dysfunction and the associated increase in LV filling pressure (i.e. PCWP) leads to a specific and common form of post‐capillary pulmonary hypertension. It is therefore reasonable to hypothesize that miR‐126‐3p exerts a protective vascular function not only at the coronary level but also in the lung microvascular endothelial cells. A failure of such compensatory mechanism (i.e. a failure of producing adequate levels of miR‐126‐3p) entails the most severe grade of pulmonary hypertension. The lack of miR‐126‐3p in myocardial tissue is certainly consistent with the peripheral/vascular production of such oligonucleotide and the association with right atrial and RV dilatation observed in patients with the lowest levels of miR‐126‐3p is likely an effect of greater mPAP/PCWP and the consequent rise in after‐load applied to right cardiac chambers.
miR‐483‐3p (serum)
MiR‐483‐3p and miR‐483‐5p are intronic miRNAs that are encoded together with insulin‐like growth factor 2 (IGF2). 26 RNA‐seq analyses showed that miR‐483 (and miR‐483‐3p in particular) targets several genes, including those involved in TGF‐β signalling (e.g. TGF‐β and TGFBR2), inflammation (e.g. IL‐1β), and vasoconstriction (e.g. ET‐1). With respect to endothelial biology, miR‐483 enhances endothelial cell function, in part via its anti‐fibrogenic effect. Moreover, lower circulating miR‐483 expression has been reported in patients with idiopathic pulmonary artery hypertension and correlate inversely with the severity of clinical manifestations. 27 However, the role of miR‐483‐3p in the setting of HFrEF could also involve a different mechanism: Morley‐Smith et al. reported that circulating levels of miR‐483‐3p, initially down‐regulated in patients with advanced HFrEF, showed a progressive up‐regulation 3, 6, and 12 months following. 28 Indeed, the authors identify miR‐483‐3p primarily as a biomarker of LV unloading, helpful in monitoring LVAD therapy. Although miR‐483‐3p tissue expression was higher in patients with the lowest cardiac output, the inverse (negative) correlation we observed in miR‐483‐3p circulating levels with CVP, as well as right atrial and RV dimensions, is difficult to explain in the light of no correlation with measures of pulmonary artery pressure, as it is the case with miR‐126‐3p. Nevertheless, it is intriguing to hypothesize miR‐483‐3p as a biomarker of ventricular/vascular coupling, related to a combination of LV systolic function, loading conditions, as well as vasoconstriction and/or endothelial dysfunction in the pulmonary vascular bed. Finally, observing such association not only in the DCM group but in ICM patients as well, is reassuring and support the significance of such result.
Our study has certainly some limitations that need to be mentioned: The small sample size is probably the most important one. However, selection of a highly homogeneous cohort, which acted at the same time as patients and controls, providing both myocardial tissue and serum for miRNA assessment, minimize such downside and make our observations valid in the specific population under analysis. On the other hand, considering the minimal sample enrolled in ICM group, analyses performed on these patients must be evaluated with great caution. Moreover, this was a single‐centre study, performed at a tertiary transplant centre and enrolling patients with end‐stage HFrEF, so that selection bias is possible. Considering the extensive number of miRNA involved in the comparison and agreement analyses, the risk of type I statistical error is worrisome. We minimized such risk excluding ICM group (N = 3) from the agreement analysis and focused on miRNAs with established role in the cardiovascular pathophysiology and molecular pathways of dilatative non‐ischaemic cardiomyopathy. Finally, our study, although lacking direct and immediate clinical implications, has demonstrated the influence of miRNAs in determining clinically significant ECHO and haemodynamic measures, such as LV dimensions or pulmonary artery pressure, that are nowadays generally considered surrogate clinical outcomes.
Conclusions
Our understanding of the roles of miRNAs in signalling pathways is growing rapidly. In the present analysis, we have extended available knowledge on miRNAs signatures in advanced HFrEF, identifying three miRNAs that are expressed in myocardial tissue being at the same time detectable as circulating biomarkers: If confirmed by studies enrolling a greater sample of patients with extended follow‐up, miR‐30d, miR‐126‐3p, and miR‐483‐3p could be helpful not only for diagnostic or prognostic purposes but, more importantly, as therapeutic targets in patients with end‐stage HFrEF.
Funding
This work was supported by Ministero della Salute (grant number 2774461) (Ricerca Corrente 2022): ‘Messa a punto di applicazioni di genomica e trascrittomica al fine di individuare biomarcatori rilevanti nei processi fisio‐patogenetici e negli approcci diagnostici e terapeutici delle insufficienze di organo, nonché dei processi di rigenerazione cellulare/tissutale e trasformazione tumorale’.
Conflict of interest
The authors declare no conflict of interest.
Supporting information
Figure S1: Linear Regression Plot of Serum miR‐126‐3p Expression and Pulmonary Capillary Wedge Pressure (PCWP) by Right Heart Catheterization, including both Dilatative non Ischemic (DCM) and Dilatative Ischemic Cardiomyopathy (ICM) groups.
Figure S2: Linear Regression Plot of Serum miR‐483‐3p Expression and Right Ventricular End Diastolic Diameter by ECHO (A), Linear Regression Plot of Serum miR‐483‐3p Expression and Central Venous Pressure (CVP) by Right Heart Catheterization (B), Linear Regression Plot of Serum miR‐483‐3p Expression and Cardiac Output by Right Heart Catheterization (C), including both Dilatative non Ischemic (DCM) and Dilatative Ischemic Cardiomyopathy (ICM) groups.
Table S1a: Comparison of miRNA Expression in Serum and Myocardial Tissue between Patients with Idiopathic and Ischemic Cardiomyopathy.
Table S1b: Agreement Analysis of MicroRNA Expression in Serum and Myocardial Tissue.
Table S2a: Correlation between Consistent Tissue miRNAs and Demographic, Lab, ECHO or RHC variables (Idiopathic Cardiomyopathy Group Only, N = 10).
Table S2b: Correlation between Consistent Tissue miRNAs and Demographic, Lab, ECHO or RHC variables (All Patients Together, N = 13).
Table S2c: Correlation between Consistent Serum (Circulating) miRNAs and Demographic, Lab, ECHO or RHC variables (DCM Group Only, N = 10).
Table S2d: Correlation between Consistent Serum (Circulating) miRNAs and Demographic, Lab, ECHO or RHC variables (All Patients Together, N = 13).
Table S3: Log Transformed miRNA Levels in Myocardial Tissue and Serum, All Patients considered together (N = 13) p‐value refers to the result of the Shapiro–Wilk test for normality assumption.
Acknowledgements
Open access funding provided by BIBLIOSAN.
Gallo, A. , Agnese, V. , Sciacca, S. , Scardulla, C. , Cipriani, M. , Pilato, M. , Oh, J. K. , Pasta, S. , Maalouf, J. , Conaldi, P. G. , and Bellavia, D. (2024) MicroRNA‐30d and ‐483‐3p for bi‐ventricular remodelling and miR‐126‐3p for pulmonary hypertension in advanced heart failure. ESC Heart Failure, 11: 155–166. 10.1002/ehf2.14546.
Pier Giulio Conaldi and Diego Bellavia made equal contributions as last authors.
Contributor Information
Alessia Gallo, Email: agallo@ismett.edu.
Diego Bellavia, Email: bellavia.diego@mac.com.
References
- 1. Savarese G, Becher PM, Lund LH, Seferovic P, Rosano GMC, Coats AJS. Global burden of heart failure: a comprehensive and updated review of epidemiology. Cardiovasc Res 2023;118:3272–3287. doi: 10.1093/cvr/cvac013 [DOI] [PubMed] [Google Scholar]
- 2. Melman YF, Shah R, Das S. MicroRNAs in heart failure: is the picture becoming less miRky? Circ Heart Fail 2014;7:203–214. doi: 10.1161/CIRCHEARTFAILURE.113.000266 [DOI] [PubMed] [Google Scholar]
- 3. Tijsen AJ, Pinto YM, Creemers EE. Non‐cardiomyocyte microRNAs in heart failure. Cardiovasc Res 2012;93:573–582. doi: 10.1093/cvr/cvr344 [DOI] [PubMed] [Google Scholar]
- 4. Lang RM, Badano LP, Mor‐Avi V, Afilalo J, Armstrong A, Ernande L, et al. Recommendations for cardiac chamber quantification by echocardiography in adults: an update from the American Society of Echocardiography and the European Association of Cardiovascular Imaging. J Am Soc Echocardiogr 2015;28:1–39.e14. doi: 10.1016/j.echo.2014.10.003 [DOI] [PubMed] [Google Scholar]
- 5. Bland JM, Altman DG. Statistical methods for assessing agreement between two methods of clinical measurement. Lancet 1986;327:307–310. doi: 10.1016/S0140-6736(86)90837-8 [DOI] [PubMed] [Google Scholar]
- 6. Bonett DG. Sample size requirements for estimating intraclass correlations with desired precision. Stat Med 2002;21:1331–1335. doi: 10.1002/sim.1108 [DOI] [PubMed] [Google Scholar]
- 7. Lin LI. A concordance correlation coefficient to evaluate reproducibility. Biometrics 1989;45:255–268. doi: 10.2307/2532051 [DOI] [PubMed] [Google Scholar]
- 8. Li H, Fan J, Yin Z, Wang F, Chen C, Wang DW. Identification of cardiac‐related circulating microRNA profile in human chronic heart failure. Oncotarget 2016;7:33–45. doi: 10.18632/oncotarget.6631 [DOI] [PMC free article] [PubMed] [Google Scholar]
- 9. Wang JX, Zhang XJ, Feng C, Sun T, Wang K, Wang Y, et al. MicroRNA‐532‐3p regulates mitochondrial fission through targeting apoptosis repressor with caspase recruitment domain in doxorubicin cardiotoxicity. Cell Death Dis 2015;6:e1677. doi: 10.1038/cddis.2015.41 [DOI] [PMC free article] [PubMed] [Google Scholar]
- 10. Liu W, Zheng J, Dong J, Bai R, Song D, Ma X, et al. Association of miR‐197‐5p, a circulating biomarker for heart failure, with myocardial fibrosis and adverse cardiovascular events among patients with stage C or D heart failure. Cardiology 2019;141:212–225. doi: 10.1159/000493419 [DOI] [PubMed] [Google Scholar]
- 11. Lu Y, Zhang Y, Wang N, Pan Z, Gao X, Zhang F, et al. MicroRNA‐328 contributes to adverse electrical remodeling in atrial fibrillation. Circulation 2010;122:2378–2387. doi: 10.1161/CIRCULATIONAHA.110.958967 [DOI] [PubMed] [Google Scholar]
- 12. du W, Liang H, Gao X, Li X, Zhang Y, Pan Z, et al. MicroRNA‐328, a potential anti‐fibrotic target in cardiac interstitial fibrosis. Cell Physiol Biochem 2016;39:827–836. doi: 10.1159/000447793 [DOI] [PubMed] [Google Scholar]
- 13. Ganesan J, Ramanujam D, Sassi Y, Ahles A, Jentzsch C, Werfel S, et al. MiR‐378 controls cardiac hypertrophy by combined repression of mitogen‐activated protein kinase pathway factors. Circulation 2013;127:2097–2106. doi: 10.1161/CIRCULATIONAHA.112.000882 [DOI] [PubMed] [Google Scholar]
- 14. Watson PF, Petrie A. Method agreement analysis: a review of correct methodology. Theriogenology 2010;73:1167–1179. doi: 10.1016/j.theriogenology.2010.01.003 [DOI] [PubMed] [Google Scholar]
- 15. Zhang X, Dong S, Jia Q, Zhang A, Li Y, Zhu Y, et al. The microRNA in ventricular remodeling: the miR‐30 family. Biosci Rep 2019;39:BSR20190788. doi: 10.1042/BSR20190788 [DOI] [PMC free article] [PubMed] [Google Scholar]
- 16. Yang SJ, Yang SY, Wang DD, Chen X, Shen HY, Zhang XH, et al. The miR‐30 family: versatile players in breast cancer. Tumour Biol 2017;39:101042831769220. doi: 10.1177/1010428317692204 [DOI] [PubMed] [Google Scholar]
- 17. Nakagawa Y, Nishikimi T, Kuwahara K, Fujishima A, Oka S, Tsutamoto T, et al. MiR30‐GALNT1/2 axis‐mediated glycosylation contributes to the increased secretion of inactive human prohormone for brain natriuretic peptide (proBNP) from failing hearts. J Am Heart Assoc 2017;6:e003601. doi: 10.1161/JAHA.116.003601 [DOI] [PMC free article] [PubMed] [Google Scholar]
- 18. Maciejak A, Kostarska‐Srokosz E, Gierlak W, Dluzniewski M, Kuch M, Marchel M, et al. Circulating miR‐30a‐5p as a prognostic biomarker of left ventricular dysfunction after acute myocardial infarction. Sci Rep 2018;8:9883. doi: 10.1038/s41598-018-28118-1 [DOI] [PMC free article] [PubMed] [Google Scholar]
- 19. Wijnen WJ, van der Made I, van den Oever S, Hiller M, de Boer BA, Picavet DI, et al. Cardiomyocyte‐specific miRNA‐30c over‐expression causes dilated cardiomyopathy. PLoS ONE 2014;9:e96290. doi: 10.1371/journal.pone.0096290 [DOI] [PMC free article] [PubMed] [Google Scholar]
- 20. Lai L, Chen J, Wang N, Zhu G, Duan X, Ling F. MiRNA‐30e mediated cardioprotection of ACE2 in rats with doxorubicin‐induced heart failure through inhibiting cardiomyocytes autophagy. Life Sci 2017;169:69–75. doi: 10.1016/j.lfs.2016.09.006 [DOI] [PubMed] [Google Scholar]
- 21. Melman YF, Shah R, Danielson K, Xiao J, Simonson B, Barth A, et al. Circulating microRNA‐30d is associated with response to cardiac resynchronization therapy in heart failure and regulates cardiomyocyte apoptosis: a translational pilot study. Circulation 2015;131:2202–2216. doi: 10.1161/CIRCULATIONAHA.114.013220 [DOI] [PMC free article] [PubMed] [Google Scholar]
- 22. Rubiś P, Totoń‐Żurańska J, Wiśniowska‐Śmiałek S, Holcman K, Kołton‐Wróż M, Wołkow P, et al. Relations between circulating microRNAs (miR‐21, miR‐26, miR‐29, miR‐30 and miR‐133a), extracellular matrix fibrosis and serum markers of fibrosis in dilated cardiomyopathy. Int J Cardiol 2017;231:201–206. doi: 10.1016/j.ijcard.2016.11.279 [DOI] [PubMed] [Google Scholar]
- 23. Xiao J, Gao R, Bei Y, Zhou Q, Zhou Y, Zhang H, et al. Circulating miR‐30d predicts survival in patients with acute heart failure. Cell Physiol Biochem 2017;41:865–874. doi: 10.1159/000459899 [DOI] [PMC free article] [PubMed] [Google Scholar]
- 24. Chistiakov DA, Orekhov AN, Bobryshev YV. The role of miR‐126 in embryonic angiogenesis, adult vascular homeostasis, and vascular repair and its alterations in atherosclerotic disease. J Mol Cell Cardiol 2016;97:47–55. doi: 10.1016/j.yjmcc.2016.05.007 [DOI] [PubMed] [Google Scholar]
- 25. Heggermont WA, Delrue L, Dierickx K, Dierckx R, Verstreken S, Goethals M, et al. Low microRNA‐126 levels in right ventricular endomyocardial biopsies coincide with cardiac allograft vasculopathy in heart transplant patients. Transplant Direct 2020;6:e549. doi: 10.1097/TXD.0000000000000995 [DOI] [PMC free article] [PubMed] [Google Scholar]
- 26. Li NQ, Yang J, Cui L, Ma N, Zhang L, Hao LR. Expression of intronic miRNAs and their host gene Igf2 in a murine unilateral ureteral obstruction model. Braz J Med Biol Res 2015;48:486–492. doi: 10.1590/1414-431X20143958 [DOI] [PMC free article] [PubMed] [Google Scholar]
- 27. Zhang J, He Y, Yan X, Chen S, He M, Lei Y, et al. MicroRNA‐483 amelioration of experimental pulmonary hypertension. EMBO Mol Med 2020;12:e11303. doi: 10.15252/emmm.201911303 [DOI] [PMC free article] [PubMed] [Google Scholar]
- 28. Morley‐Smith AC, Mills A, Jacobs S, Meyns B, Rega F, Simon AR, et al. Circulating microRNAs for predicting and monitoring response to mechanical circulatory support from a left ventricular assist device. Eur J Heart Fail 2014;16:871–879. doi: 10.1002/ejhf.116 [DOI] [PMC free article] [PubMed] [Google Scholar]
Associated Data
This section collects any data citations, data availability statements, or supplementary materials included in this article.
Supplementary Materials
Figure S1: Linear Regression Plot of Serum miR‐126‐3p Expression and Pulmonary Capillary Wedge Pressure (PCWP) by Right Heart Catheterization, including both Dilatative non Ischemic (DCM) and Dilatative Ischemic Cardiomyopathy (ICM) groups.
Figure S2: Linear Regression Plot of Serum miR‐483‐3p Expression and Right Ventricular End Diastolic Diameter by ECHO (A), Linear Regression Plot of Serum miR‐483‐3p Expression and Central Venous Pressure (CVP) by Right Heart Catheterization (B), Linear Regression Plot of Serum miR‐483‐3p Expression and Cardiac Output by Right Heart Catheterization (C), including both Dilatative non Ischemic (DCM) and Dilatative Ischemic Cardiomyopathy (ICM) groups.
Table S1a: Comparison of miRNA Expression in Serum and Myocardial Tissue between Patients with Idiopathic and Ischemic Cardiomyopathy.
Table S1b: Agreement Analysis of MicroRNA Expression in Serum and Myocardial Tissue.
Table S2a: Correlation between Consistent Tissue miRNAs and Demographic, Lab, ECHO or RHC variables (Idiopathic Cardiomyopathy Group Only, N = 10).
Table S2b: Correlation between Consistent Tissue miRNAs and Demographic, Lab, ECHO or RHC variables (All Patients Together, N = 13).
Table S2c: Correlation between Consistent Serum (Circulating) miRNAs and Demographic, Lab, ECHO or RHC variables (DCM Group Only, N = 10).
Table S2d: Correlation between Consistent Serum (Circulating) miRNAs and Demographic, Lab, ECHO or RHC variables (All Patients Together, N = 13).
Table S3: Log Transformed miRNA Levels in Myocardial Tissue and Serum, All Patients considered together (N = 13) p‐value refers to the result of the Shapiro–Wilk test for normality assumption.