

Abstract
Acquired drug resistance to anti-cancer targeted therapies remains an unsolved clinical problem. Although many drivers of acquired drug resistance have been identified 1–4, the underlying molecular mechanisms shaping tumor evolution during treatment are incompletely understood. Genomic profiling of patient tumors has implicated APOBEC cytidine deaminases in tumor evolution; however, their role during therapy and the development of acquired drug resistance is undefined. Here, we report that lung cancer targeted therapies commonly used in the clinic can induce cytidine deaminase APOBEC3A (A3A), leading to sustained mutagenesis in drug-tolerant cancer cells persisting during therapy. Therapy-induced A3A promotes the formation of double-strand DNA breaks, increasing genomic instability in drug-tolerant persisters. Deletion of A3A reduces APOBEC mutations and structural variations in persister cells and delays the development of drug resistance. APOBEC mutational signatures are enriched in tumors from lung cancer patients who progressed after extended responses to targeted therapies. This study reveals that induction of A3A in response to targeted therapies drives evolution of drug-tolerant persister cells, suggesting that suppression of A3A expression or activity may represent a potential therapeutic strategy to prevent or delay acquired resistance to lung cancer targeted therapy.
Apolipoprotein B mRNA editing catalytic polypeptide-like (APOBEC) is a cytidine deaminase that catalyzes the hydrolytic deamination of cytidine into uridine and causes C>T or C>G substitutions at TpC motifs in the genome. Mutations attributed to APOBEC have been identified across dozens of cancer types and several APOBEC family members have been implicated in driving tumor development 5–10. By comparison, less is known about mutational mechanisms that are active during treatment in cancers that respond to targeted therapies and subsequently relapse due to the development of acquired drug resistance. We previously demonstrated that pre-existing resistant clones may emerge under the selective pressure of therapy in some cases, while in other cases, cancer cells may adapt and evolve in response to treatment through a transient drug-tolerant persister (DTP) cell intermediate state 11. Here we report that targeted therapy-induced APOBEC3A (A3A) increases genomic instability (GIN) and drives evolution of DTPs.
APOBEC mutations and clonal evolution
Non-small cell lung cancers (NSCLCs) treated with sequential tyrosine kinase inhibitors (TKIs) can acquire compound resistance mutations in a stepwise fashion by linear evolution of resistant clones 12,13. In a case of ALK fusion-positive NSCLC (MGH086) 13, distinct clones harboring compound resistance mutations arose from an initial resistant clone with an acquired ALKE1210K mutation that emerged during first-line crizotinib treatment (Fig. 1a, Extended Data Fig. 2). Whole-exome sequencing (WXS) revealed elevated tumor mutation burden in each of the resistant tumors (pre-treatment, 184; post-treatment, 725–1623) (Fig. 1b, upper). To identify mutational processes occurring during sequential TKI treatment in this patient, we resolved mutational signatures using non-negative matrix factorization (NMF) (Extended Data Fig. 1a). We found that the majority of new mutations comprised an NMF signature of C>T and C>G substitutions at TpC motifs, corresponding to Sanger Signature 2 (SBS2) and 13 (SBS13), which are attributed to APOBEC cytidine deaminase activity (pre-treatment, 5.5%; post-treatment, 73.9–90.5%) (Fig. 1b, lower). Hereafter, we refer to substitutions comprising this NMF-derived mutational signature as “APOBEC mutations”. Intriguingly, each of the acquired resistance mutations in ALK resulted from C>T or C>G substitutions at TpC sites, suggesting that they were caused by APOBEC mutagenesis (Extended Data Fig. 1b). Similarly, we observed enriched APOBEC mutational signatures in tumors from multiple metastatic sites in an EGFR-mutant NSCLC patient (MGH10032) who developed compound EGFRT790M/C797S mutations during sequential EGFR TKI therapy (pre-treatment, 5.9%; post-treatment, 44.0–47.4%) (Fig. 1c, Extended Data Fig. 1c, 2). We also observed increased APOBEC mutational signatures in TKI-treated compared to pre-treatment tumors in an additional two out of three EGFR and ALK NSCLC patients who developed compound mutations during sequential TKI therapy (Fig. 1c, Extended Data Fig. 1d–f, 2). To further investigate the relationship between APOBEC mutagenesis and targeted therapy acquired drug resistance, we performed whole-genome sequencing (WGS) on seven experimental cell line models of TKI resistance and observed various levels of APOBEC mutations (Fig. 1d). In two gefitinib-resistant clones of a cell line derived from EGFR-mutant NSCLC patient MGH119–1 (GR-A and GR-B), one of which acquired EGFRT790M, analysis of shared and private mutations demonstrated that the resistant clones independently evolved from a common ancestor (Extended Data Fig. 1g). Mutational signature analysis revealed enrichment of the APOBEC signature in the private mutations of each resistant clone. In the gefitinib-resistant PC9-GR2 (pre-existing EGFRT790M) and GR3 (evolved EGFRT790M) cells 11, greater enrichment of the APOBEC signature was observed in GR3 cells compared to GR2 cells, suggesting that the accumulation of APOBEC mutations may be associated with evolution of DTPs during targeted therapy.
Fig. 1 |. APOBEC mutational signatures are associated with clonal evolution driven by lung cancer targeted therapies.
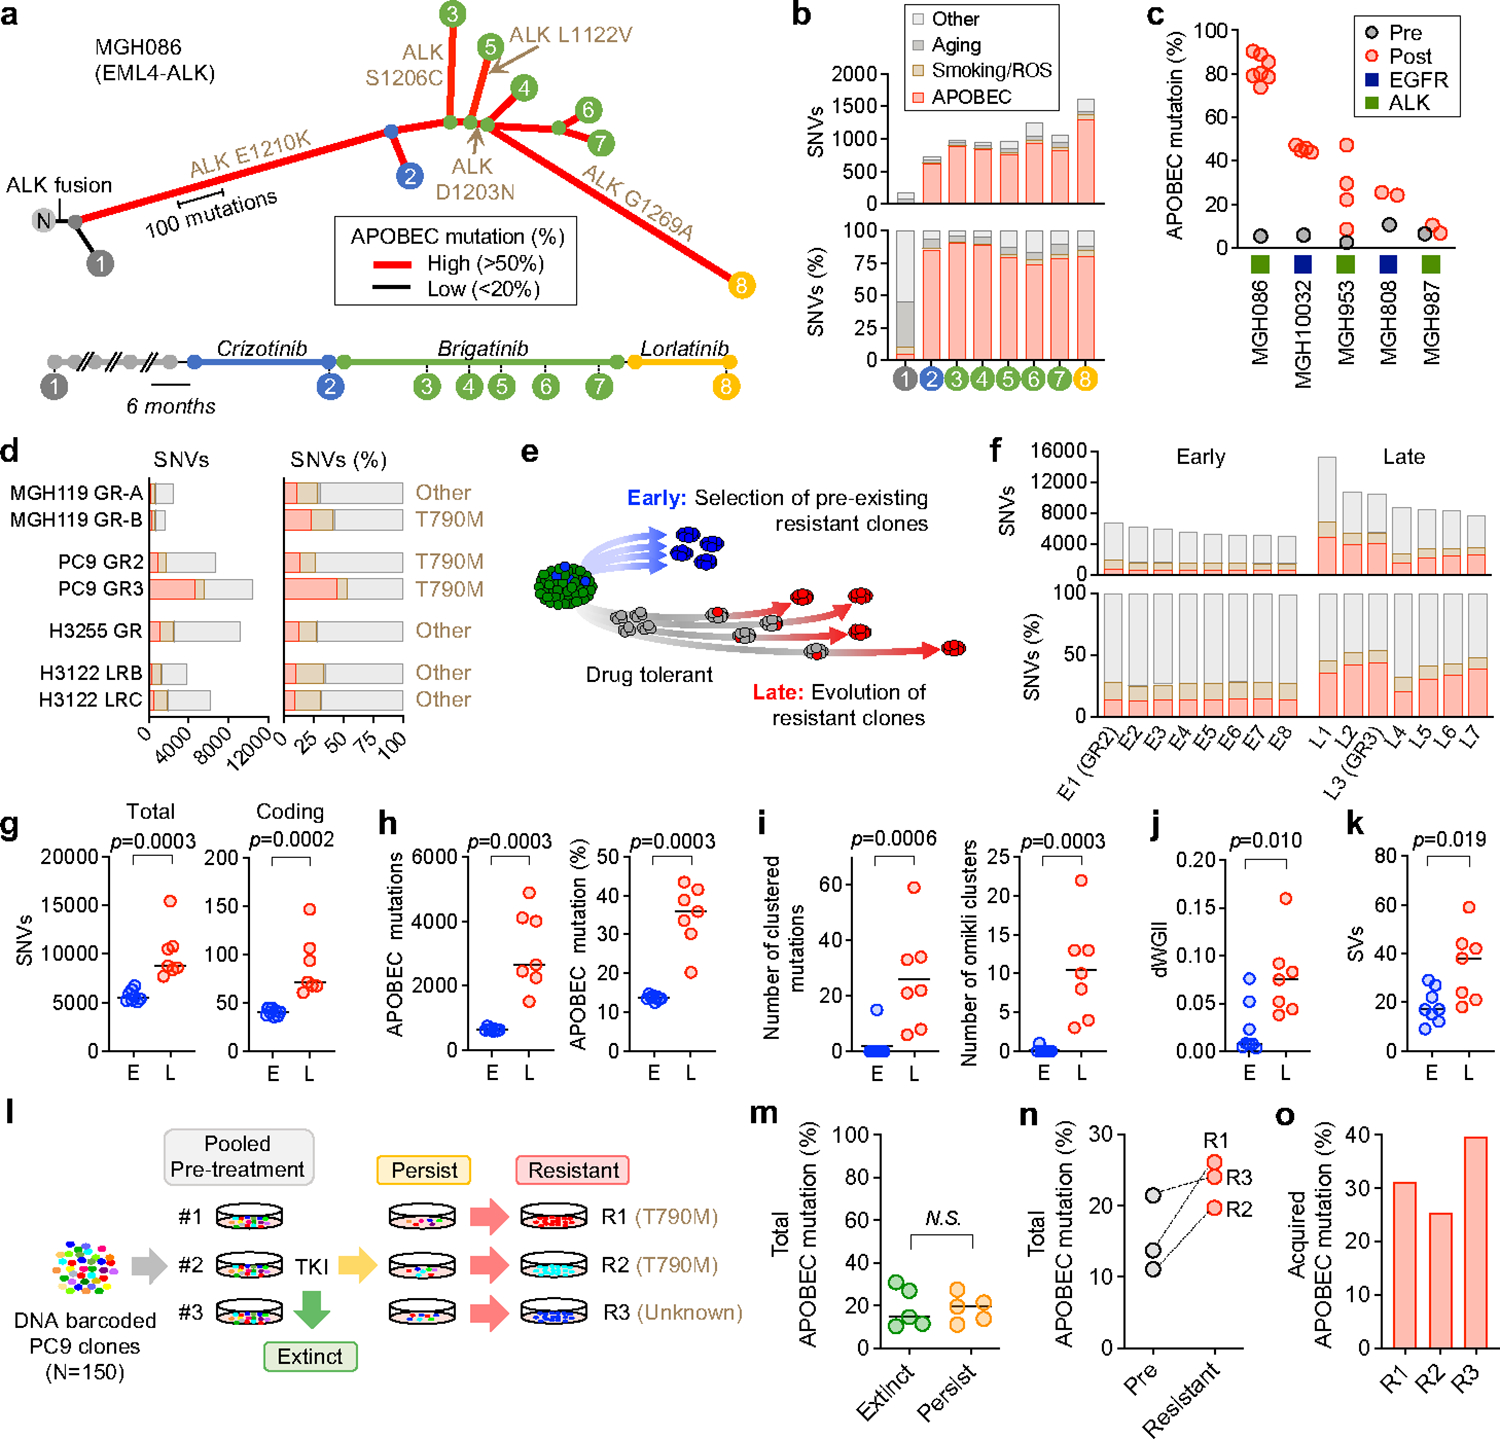
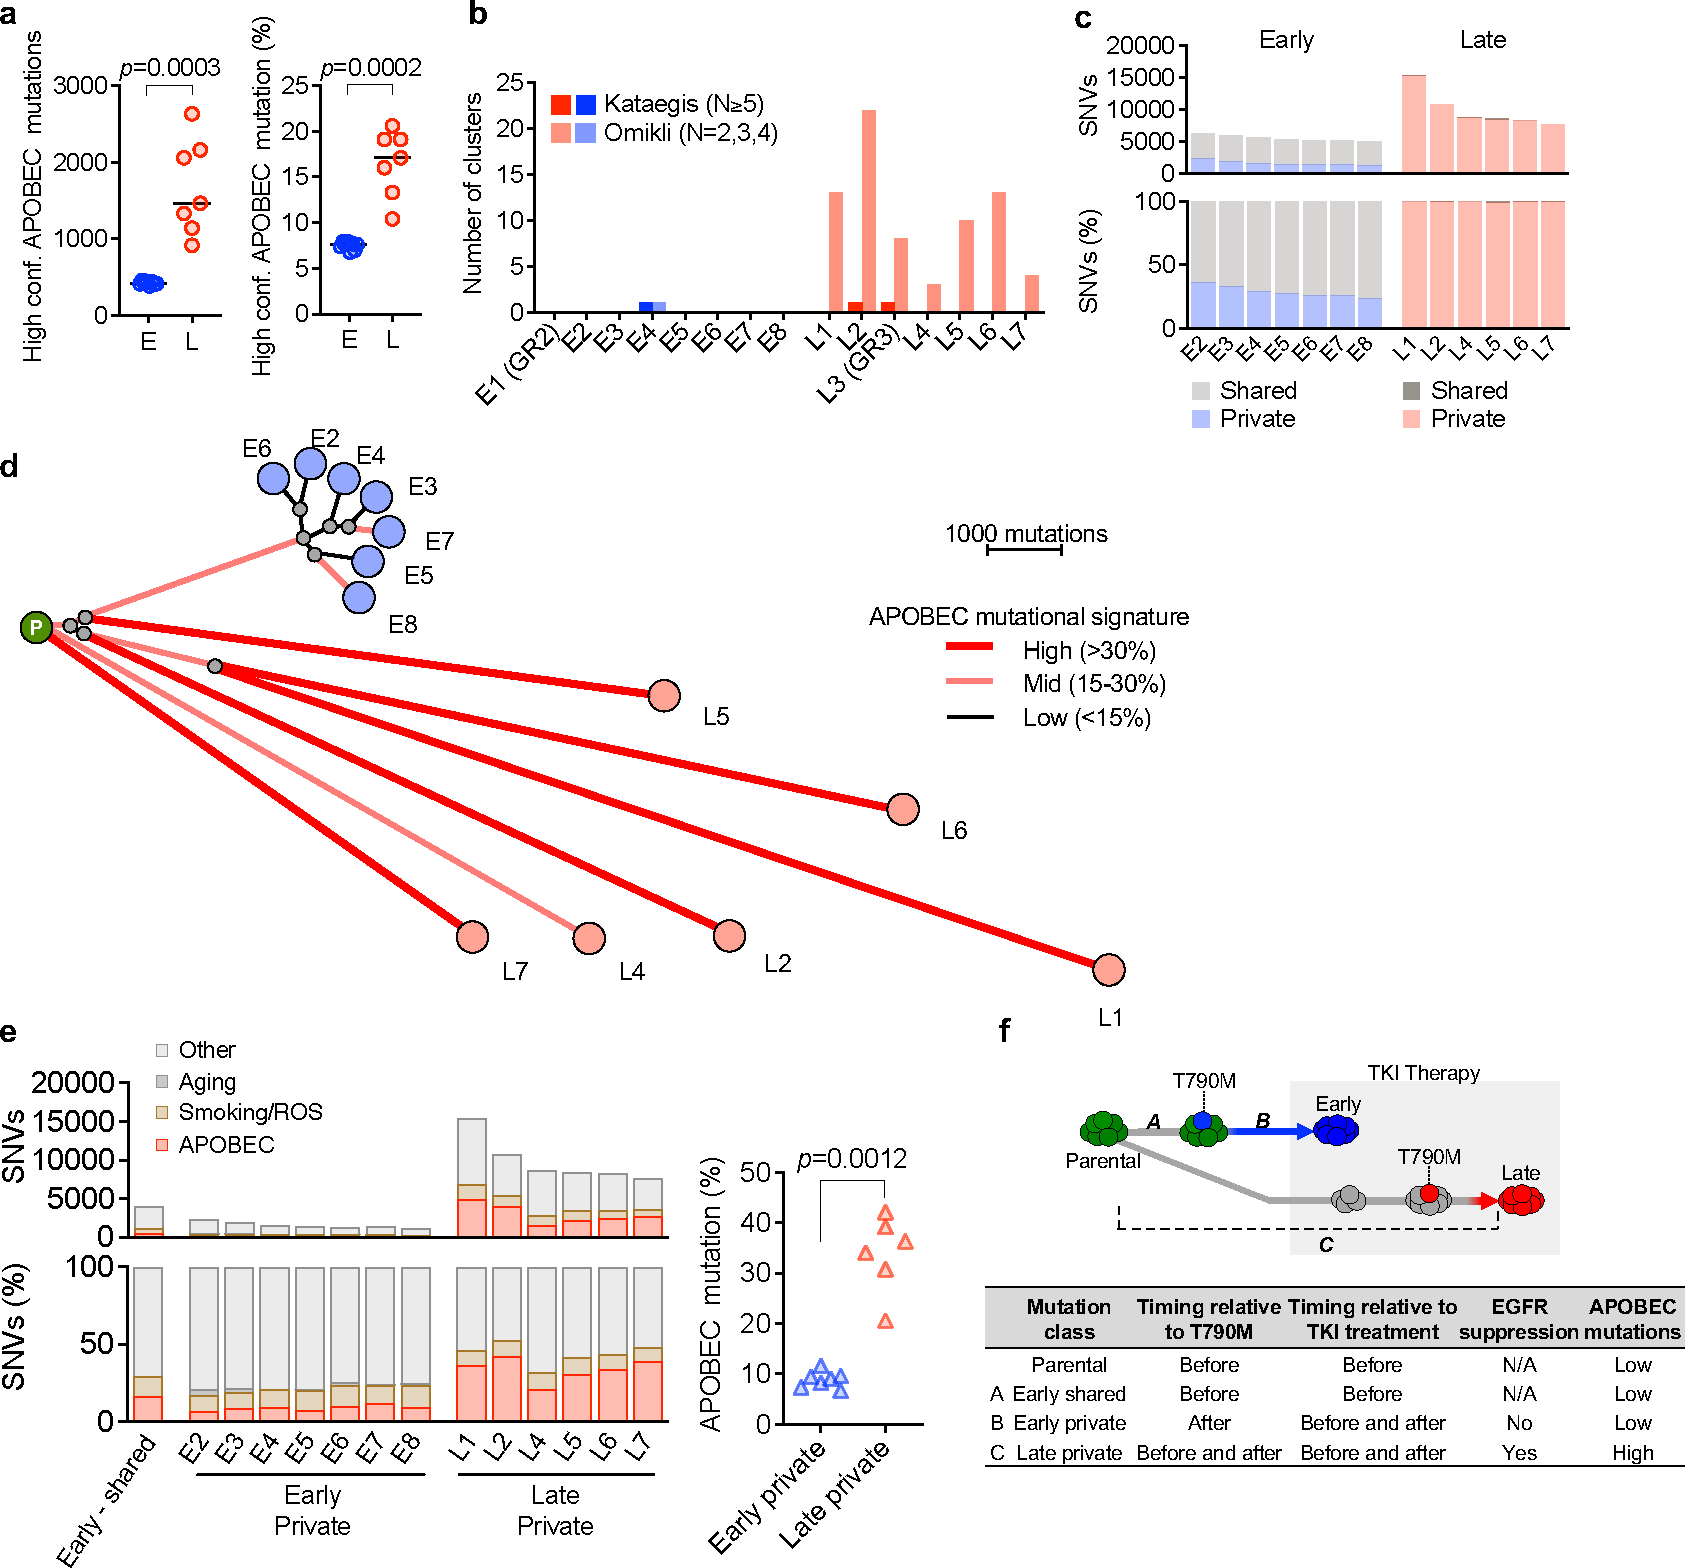
a, APOBEC mutational signatures and clonal relationship of tumors with acquired ALK resistance mutations from patient MGH086 over the course of sequential ALK TKI therapy (N, matched normal tissue). b, Total SNVs in each MGH086 tumor sample, stratified by mutation signature and shown as total count (upper) or percentage (lower). c, APOBEC mutation percentage in NSCLC tumors with acquired compound resistance mutations. d, Private mutations classified by mutation signature in TKI-resistant models. Private mutations are those observed in an individual resistant cell line and not shared across other samples or the parental cell line. Signature colors correspond to Fig. 1b. e, Evolutionary trajectories of early and late resistant PC9 EGFRT790M clones. f, Acquired SNVs classified by mutation signature in resistant models in PC9 early and late resistant clones. Each resistant clone was compared to parental PC9 cells to identify acquired mutations. Signature colors correspond to Fig. 1b. g-k, Total and coding mutations (g), APOBEC mutations (h), APOBEC-associated clustered mutations (TpC > T, G or A with an inter-mutational distance less than 1 kb) and omikli clusters containing 2–4 mutations (i), dWGII (j), and SVs (k) in PC9 early (E, n = 8) and late clones (L, n=7). l, Schema of PC9 lineage-tracing study. m, Baseline APOBEC mutation (%) of pre-treatment clones that went extinct upon TKI treatment (n = 5) or persisted (n = 5). n, APOBEC mutation (%) of matched pre-treatment and resistant clones. o, Acquired APOBEC mutation (%) in resistant clones. Each resistant clone was compared to its matched pre-treatment clone to identify acquired mutations. Significant p values were determined by two-sided Mann Whitney test (g-k, m).
To better define the context of therapy-associated APOBEC mutagenesis, we examined the evolutionary trajectory of resistant clones that acquired APOBEC mutations. We performed WGS on additional PC9 EGFRT790M clones that evolved from drug tolerant persister cells or that derived from pre-existing EGFRT790M cells (Fig. 1e). Late-resistant clones that evolved from persister cells harbored significantly higher numbers of total and coding single-nucleotide variants (SNVs) than the early-clones derived from pre-existing resistant cells (Fig. 1f, g). Late clones were enriched for APOBEC mutations (Fig. 1h, Extended Data Fig. 3a), as well as omikli mutation clusters, a recently described hallmark of APOBEC mutagenesis 14,15 (Fig. 1i, Extended Data Fig. 3b). Reconstructing the evolutionary history of resistant clones based on the profile of shared or private mutations, we found that the early resistant clones were derived from a recent common ancestor that had acquired EGFRT790M prior to treatment, while the late resistant clones had undergone independent clonal evolution (Extended Data Fig. 3c, d). NMF analysis revealed significantly higher enrichment of APOBEC signature in the private mutations in late clones, compared to early clones (Extended Data Fig. 3e), suggesting an association between APOBEC mutagenesis and evolution of DTPs during TKI treatment (Extended Data Fig. 3f). To identify additional genomic features of evolving resistant clones, we calculated a differential version of the Weighted Genomic Integrity Index (dWGII) 16, and directly compared locus-specific copy number ratios across the genome in early and late PC9 resistant clones. Interestingly, late clones enriched with APOBEC mutations exhibited higher dWGII and copy number changes compared to early clones (Fig. 1j, Extended Data Fig. 4a, b). Moreover, late-evolving clones harbored significantly higher numbers of structural variations (SVs) compared to early-resistant clones (Fig. 1k, Extended Data Fig. 4c, d).
The appearance of APOBEC mutations in late-evolving resistant clones could result from mutagenesis occurring during treatment, or alternatively, preferential selection of clones with pre-existing APOBEC mutations. To distinguish between these possibilities, we generated a library of DNA-barcoded PC9 single-cell clones (n = 150, each clone with a unique barcode), pooled clones together to generate a heterogenous population, and treated three replicate pools with gefitinib until a dominant fully resistant clone emerged (Fig. 1l). Comparison of the frequencies of baseline APOBEC mutations in clones that were enriched in the persister phase (which included the three eventual dominant resistant clones) with clones that went extinct after 6 weeks of gefitinib treatment revealed no significant difference in APOBEC mutation percentages (Fig. 1m), suggesting that pre-existing APOBEC mutation burden did not influence the initial selection of DTP clones. In two of three replicates, the dominant clone acquired the EGFRT790M resistance mutation, whereas the third developed an unidentified EGFR-independent mechanism of resistance. Using the barcode sequences to match each resistant clone with its pre-treatment ancestor, we observed an increase in APOBEC mutations in each resistant clone after treatment (Fig. 1n). Specifically, APOBEC mutations were enriched in the newly acquired private mutations (Fig. 1o).
A recent study demonstrated that sporadic APOBEC mutations can arise during routine culturing of some cell lines 17. To investigate the possibility that APOBEC mutations may occur spontaneously in the absence of TKI in our pre-clinical models, we performed sequential rounds of single-cell cloning of parental PC9 cells, early resistant clone E1 (PC9-GR2), and late resistant clone L2 in the absence of TKI (Extended Data Fig. 5b). To account for differences in the proliferation rate of cells cultured in the presence or absence of TKI, we calculated the mean doubling time of DTP cells during TKI therapy 11 and estimated the number of cell divisions of late-evolving clones prior to the acquisition of the EGFRT790M mutation (Extended Data Fig. 5a). To approximate a similar number of replication events, we cultured PC9, E1 (PC9-GR2) and L2 cells for 20–25 doublings between the first and second cloning events. WGS confirmed that the APOBEC mutation frequencies of shared mutations within each clonal series reflected the prior APOBEC mutation history (Extended Data Fig. 5c, light color bars). Relatively little accumulation of APOBEC mutations was observed during 20–25 doublings in the absence of TKI in all three models (Extended Data Fig. 5c, darker color bars). Collectively, these results indicate that the majority of acquired APOBEC mutations in late-evolving PC9 resistant cells arose due to TKI treatment.
Targeted therapies can induce APOBEC3A
Of the eleven APOBEC cytidine deaminases 5, both A3A and A3B have been implicated in human cancer development 7–10,18. Efforts to resolve the relative contributions of A3A and A3B have suggested that the canonical APOBEC mutational signature may be caused by A3A, by A3B, or by a combination of A3A and A3B, in a context-specific manner 18–20. While A3B is highly expressed in general, A3A is a more potent mutator (with >100-fold greater in vitro deamination activity than A3B 9,21), perhaps explaining its greater ability to drive carcinogenesis in vivo 10 and dominant role in generating APOBEC mutational signatures in cancer cell lines 22. Upon gefitinib treatment, we consistently observed rapid up-regulation of A3A transcription, but not other APOBECs, that was sustained in DTP cells after 14 days of treatment (Fig. 2a). Similar results were observed upon treatment of cells with the third-generation EGFR TKI osimertinib (Extended Data Fig. 6a), which has recently become the standard first-line therapy for EGFR-mutant NSCLC 23. Analysis of an independent RNA-seq dataset also revealed increased expression of A3A during EGFR TKI treatment (Extended Data Fig. 6b).
Fig. 2 |. Targeted therapies can induce APOBEC3A.
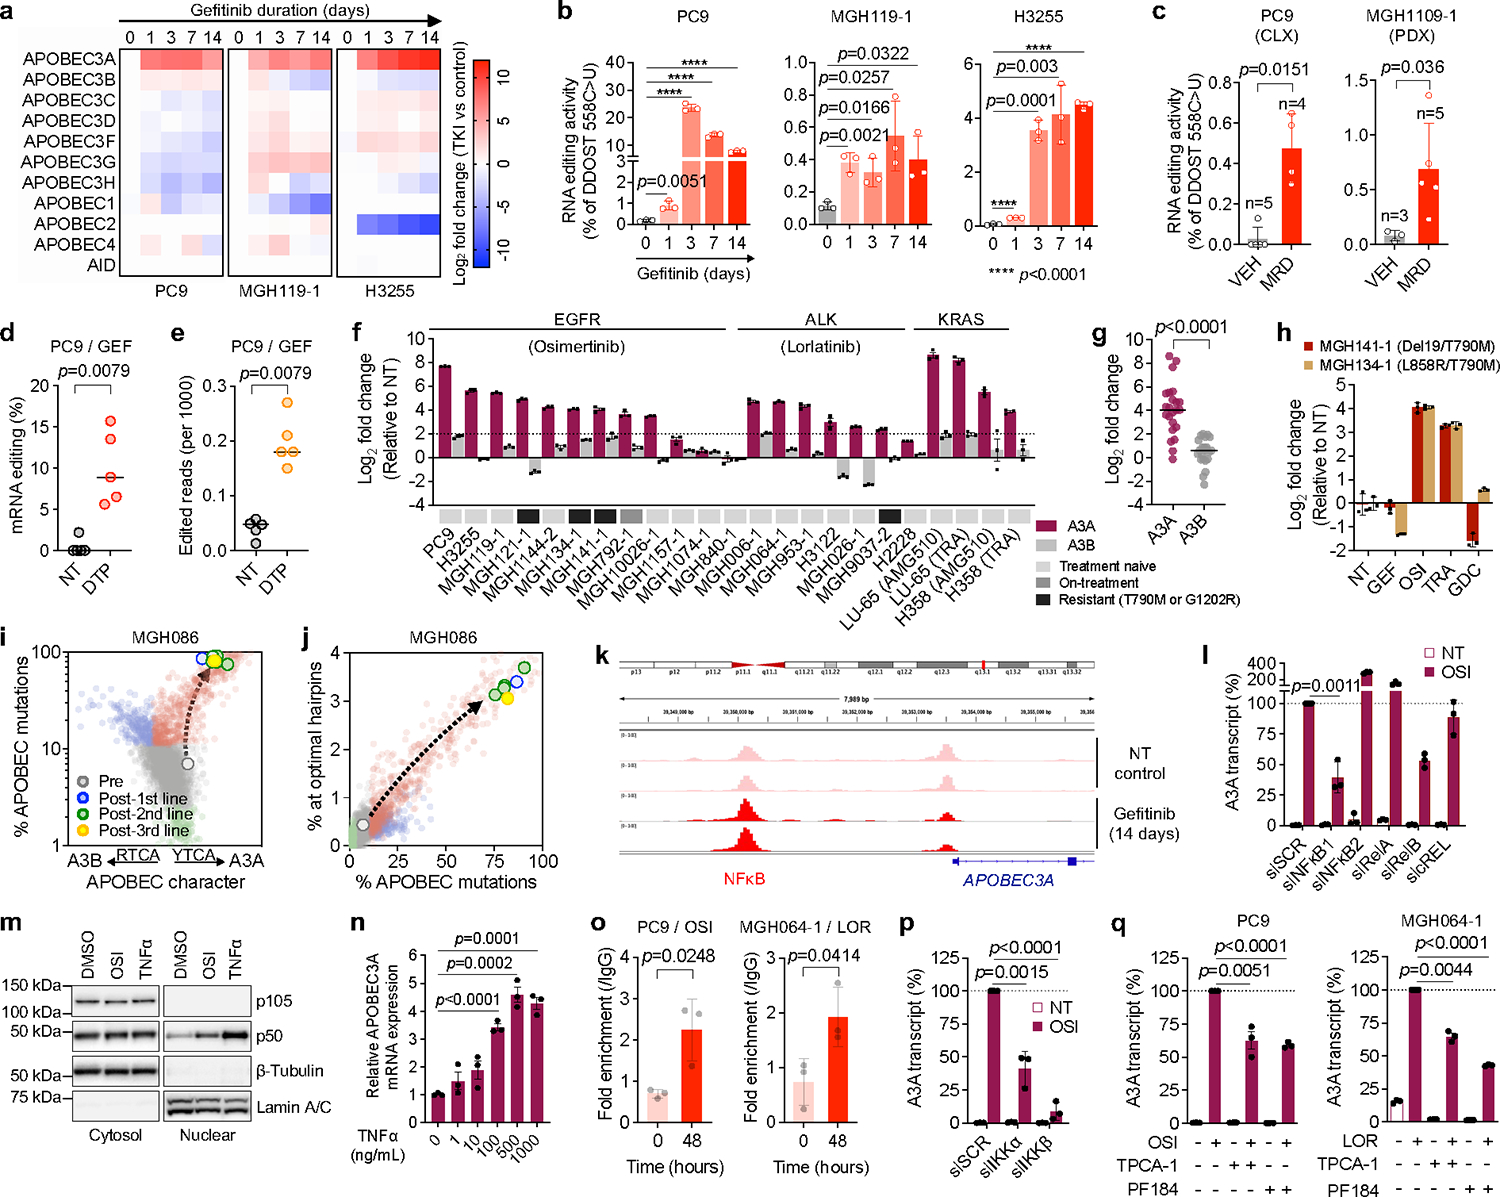
a, Expression of APOBECs by quantitative RT-PCR (3 biological replicates) in EGFR NSCLC cell lines. b, DDOST mRNA editing determined by ddPCR (mean ± s.d. of 3 biological replicates, two-sided Student’s t-test). c, DDOST mRNA editing in control (VEH) and osimertinib-treated EGFR-mutant xenograft MRD tumors (mean ± s.d. of 3–5 independent tumors, two-sided Mann Whitney test). d-e, DDOST (d) and transcriptome-wide editing of A3A hairpin motifs (e) in mRNA-seq reads from control and gefitinib-treated DTPs (5 biological replicates, bar: median, two-sided Mann Whitney test. NT, non-treated control). f-g, Individual (f) or aggregate (g) TKI-induced A3A and A3B expression in NSCLC cells (TRA, trametinib; g, bar: median, two-sided Student’s t-test). h, A3A expression in resistant EGFR NSCLC cells. i-j, A3A (YTCA) and A3B (RTCA) character (i) and A3A hairpin motif (j) mutations in MGH086 tumors. Reference tumors from the ICGC/PCAWG consortium are plotted for comparison as described in Extended Data Fig. 9 (A3A - red, A3B - blue, APOBEC < 2.5% - green). k, Chromatin accessibility of APOBEC3A locus in PC9 DTPs (2 biological replicate). l, TKI-induced A3A expression in PC9 cells after knockdown of NFκB pathway genes. m, Western blot of PC9 cells treated with osimertinib or TNFα (representative of three independent experiments). n, A3A expression in PC9 cells treated with TNFα. o, NFκB1 binding to A3A enhancer locus in TKI-treated NSCLC cells determined by ChIP-PCR (mean ± s.d. of 3 biological replicates, two-sided Student’s t-test). p-q TKI-induced A3A expression in PC9 cells after IKKα/β knockdown (p) or treatment with IKKβ inhibitors (q). mRNA expression (f, h, l, n, p-q) was determined by quantitative RT-PCR (mean ± s.d. of 3 biological replicates); significant p values (l, n, p-q) were determined by two-sided Student’s t-test.
To assess TKI-induced A3A enzymatic activity, we first tested A3A RNA editing at UpC sites presented within defined stem-loop hairpin motifs 18,20,24–26 by digital PCR, which enables discrimination of A3A from A3B activity 18,27 (Extended Data Fig. 6c–f). Consistent with the increase in A3A expression, C>U editing at an A3A hairpin motif within the DDOST gene mRNA (DDOST558C>U) was significantly increased in EGFR-mutant NSCLC cell lines shortly after initiation of TKI treatment and remained elevated in DTP cells after 14 days (Fig. 2b). To corroborate these in vitro findings, we treated EGFR-mutant NSCLC cell line xenograft (CLX) or patient-derived xenograft (PDX) tumors with osimertinib until tumors regressed to a stable minimal residual disease (MRD) state (Extended Data Fig. 6g). A higher percentage of DDOST RNA editing was detected in TKI-treated residual tumors compared with untreated tumors (Fig. 2c). We also examined whether A3A RNA editing could be detected by RNA-seq by quantifying C>U mutations in transcripts corresponding to A3A hotspots 18 and observed increased DDOST558C>U editing in PC9 DTP cells after 14 days of drug treatment (Fig. 2d). Finally, we developed a computational tool called ApoTrack that integrates reads containing UCN > UUN mutations in hairpin loops of sequence NUC or NNUC at the end of stably paired stems at ~2000 sites across the transcriptome, which revealed widespread RNA C->U editing in DTP cells (Fig. 2e, Extended Data Fig. 6h).
To extend these findings, we investigated whether A3A is induced in other targeted therapy contexts. Treatment of ALK fusion-positive lung cancer cell lines (H3122, MGH006–1, MGH064–1) with the ALK inhibitor lorlatinib consistently induced expression of A3A, but not other APOBEC family genes (Extended Data Fig. 7a), which coincided with increased A3A RNA editing (Extended Data Fig. 7b). Similarly, KRASG12C and MEK inhibitors induced A3A expression and editing activity in KRASG12C-mutant lung cancer cells (Extended Data Fig. 7c–e). Across an expanded panel of 21 NSCLC cell lines harboring EGFR, ALK and KRAS driver alterations, including patient-derived cell lines generated from pre-treatment, on-treatment or progression biopsies (with acquired EGFRT790M or ALKG1202R), treatment with the corresponding targeted therapies resulted in > 4-fold induction of A3A expression in 17/21 models representing all three clinical scenarios (Fig. 2f, g). Notably, we observed a strong correlation between A3A RNA transcription levels and DDOST558C>U RNA editing in NSCLC cell lines treated with or without TKI (Extended Data Fig. 7f–h). Thus, induction of A3A is a common response of oncogene-driven lung cancer cells when treated with targeted therapies.
Next, we studied the relationship between TKI-induced A3A activity and the evolutionary histories of early- and late-resistant PC9 clones. Late-evolving PC9-GR3 cells, despite having previously accumulated APOBEC mutations (Fig. 2d–f), showed baseline expression and editing activity of A3A similar to untreated parental PC9 cells and early-resistant PC9-GR2 cells (Extended Data Fig. 8a, b), indicating that the A3A activity had returned to pre-treatment levels in the absence of drug. Consistent with this notion, when TKI-treated DTP cells were removed from drug, A3A expression returned to baseline (Extended Data Fig. 8a). Suppression of EGFRT790M for 24 hours with a third-generation EGFR TKI induced A3A expression and editing activity in both PC9-GR2 and -GR3 cells (Extended Data Fig. 8a, b), suggesting that these resistant cells possessed the ability to induce A3A upon effective inhibition of EGFRT790M and its downstream signaling. To test this, we treated treatment-naïve and EGFRT790M resistant EGFR-mutant NSCLC cell lines with first- and third-generation TKIs (gefitinib and osimertinib), MEK inhibitor (trametinib) or PI3K inhibitor (GDC0941). A3A was induced only when EGFR and/or downstream MEK-ERK signaling was suppressed (Fig. 2h, Extended Data Fig. 8c). Thus, A3A activity is coupled with suppression of oncogenic driver signaling (Extended Data Fig. 8d).
Recent studies have demonstrated context-specific preferences of A3A and A3B at TpC sites: A3A exhibits preference for a pyrimidine at the −2 position (YTCA) whereas 3B prefers a purine (RTCA) 19. We calculated the YTCA versus RTCA character of APOBEC mutations in our pre-clinical resistance models and resistant patient tumors (see Fig. 1c, d, f, Extended Data Fig. 3e) and compared these to a cohort of ~2600 WGS-analyzed tumors from the International Cancer Genome Consortium (ICGC) Pan-Cancer Analysis of Whole Genomes (PCAWG) project 28. Acquired APOBEC mutations in resistant MGH119–1 and late resistant PC9 cells exhibited a bias toward YTCA motifs (Extended Data Fig. 9a–c, upper). We also observed a striking A3A bias in the resistant tumors from MGH086 (Fig. 2i) and other EGFR and ALK patients (Extended Data Fig. 9d, upper). Next, we examined whether APOBEC mutations occurred in the context of hairpin-loop secondary structures that were recently shown to be highly specific for A3A compared with A3B 20. Similar to A3A-positive tumors from PCAWG, post-treatment tumors and pre-clinical models harbored increased numbers of mutations in optimal hairpins (Fig. 2j, Extended Data Fig. 9a–d, lower), further supporting a dominant role of A3A in the context of TKI acquired resistance. Additionally, we studied EGFR-mutant lung cancers that had transformed from adenocarcinoma to small cell lung cancer (SCLC) histology at the time of acquired resistance, a process associated with the appearance of APOBEC mutational signatures 29,30. In four previously reported cases of SCLC transformation 29,31,32, in which APOBEC mutational signatures were observed in the SCLC-transformed tumors but not in the corresponding patients’ non-transformed adenocarcinomas, we confirmed that the APOBEC mutations in the transformed tumors exhibited A3A character (Extended Data Fig. 9e–g). Collectively, these findings suggest that APOBEC mutations that accumulate in lung cancers treated with targeted therapies result from therapy-induced A3A activity.
To gain insight into the mechanism of TKI-induced A3A expression, we performed ATAC-seq on PC9 cells after 14 days of TKI treatment and observed three regions of increased chromatin accessibility upstream of the A3A transcriptional start site (Fig. 2k, Extended Data Fig. 10a). Examination of the ENCODE database identified several transcription factors that have been shown to bind at these putative enhancer regions including NFκB, c-Jun/Fos/AP-1, STAT2/STAT3 and the ETS transcription factor SPI-1. Consistent with prior reports demonstrating that NFκB induces A3A expression after genotoxic stress 33 and NFκB is activated in response to EGFR TKI treatment 34,35, we observed an increase in chromatin accessibility at NFκB motifs compared to sites bound by the other transcription factors (Extended Data Fig. 10b). To establish a causal role for NFκB activation in TKI-induced A3A expression, we suppressed expression of individual components of the NFκB signaling cascade by RNA interference. siRNA pools targeting NFκB1 significantly blunted TKI-induced A3A expression (Fig. 2l, Extended Data Fig. 10c). Similar results were observed using two individual siRNAs targeting NFκB1 (Extended Data Fig. 10d). Treatment of PC9 cells with osimertinib resulted in translocation of the active p50 form of NFκB1 into the nucleus (Fig. 2m). Moreover, independent activation of NFκB by tumor necrosis factor alpha (TNFα) resulted in nuclear translocation of p50 and increased A3A expression (Fig. 2l, n). ChIP-PCR confirmed increased binding of p50 to the putative A3A enhancer region (identified by ATAC-seq) in TKI-treated PC9 and MGH064–1 cells (Fig. 2o). TKI-induced A3A expression was suppressed by siRNAs targeting IKKα and IKKβ, upstream positive regulators of NFκB pathway (Fig. 2p, Extended Data Fig. 10e). Pharmacological inhibition of IKKβ by TPCA-1 or PF184 reduced p50 nuclear translocation and A3A up-regulation in PC9 and MGH064–1 cells in presence of TKI (Fig. 2q, Extended Data Fig. 10f). Taken together, these data demonstrate that TKI treatment induces A3A expression, at least in part, via activation of the transcription factor NFκB1.
APOBEC3A increases GIN in DTPs
To establish a causal link between targeted therapy and A3A mutagenesis in DTP cells, we generated A3A-deficient (A3A KO) and scrambled control (SCR) PC9 clones by CRISPR-mediated gene knockout. After confirming loss of RNA editing activity in knockout clones (Extended Data Fig. 11a), we established xenograft tumors in immunodeficient mice and treated them with osimertinib for up to 22 weeks. A3A KO and SCR tumors exhibited equivalent initial regression in response to osimertinib and remained in a stable MRD state, except for two SCR tumors that relapsed. MRD tumors were harvested after 22 weeks treatment and single-cell clones were established (Fig. 3a). WGS of clones expanded from MRD tumors revealed accumulation of total SNVs and APOBEC mutations during treatment in SCR tumors, which were significantly reduced in A3A KO tumors (Fig. 3b–d, Extended Data Fig. 11b). We also observed an absence of acquired kataegis and omikli clusters in A3A KO tumors (Fig. 3e, left). We examined an additional DTP model of ALK-fusion positive H3122 cells treated with lorlatinib in vitro (Extended Data Fig. 11c). WGS revealed dose-dependent accumulation of APOBEC mutations in lorlatinib-treated SCR DTP clones (Extended Data Fig. 11d, e) that were reduced in lorlatinib-treated A3A KO H3122 DTP clones. Relatively little or no accumulation of APOBEC mutations was observed in SCR clones cultured in the absence of lorlatinib. Analysis of YTCA/RTCA sequence motifs revealed that the APOBEC mutations in PC9 and H3122 SCR persister clones exhibited A3A character (Fig. 3f). These results demonstrate that TKI-induced A3A is responsible for the accumulation of genomic APOBEC mutations in persister cells.
Fig. 3 |. TKI-induced APOBEC3A promotes DNA damage and chromosomal aberrations in drug-tolerant persister cells.
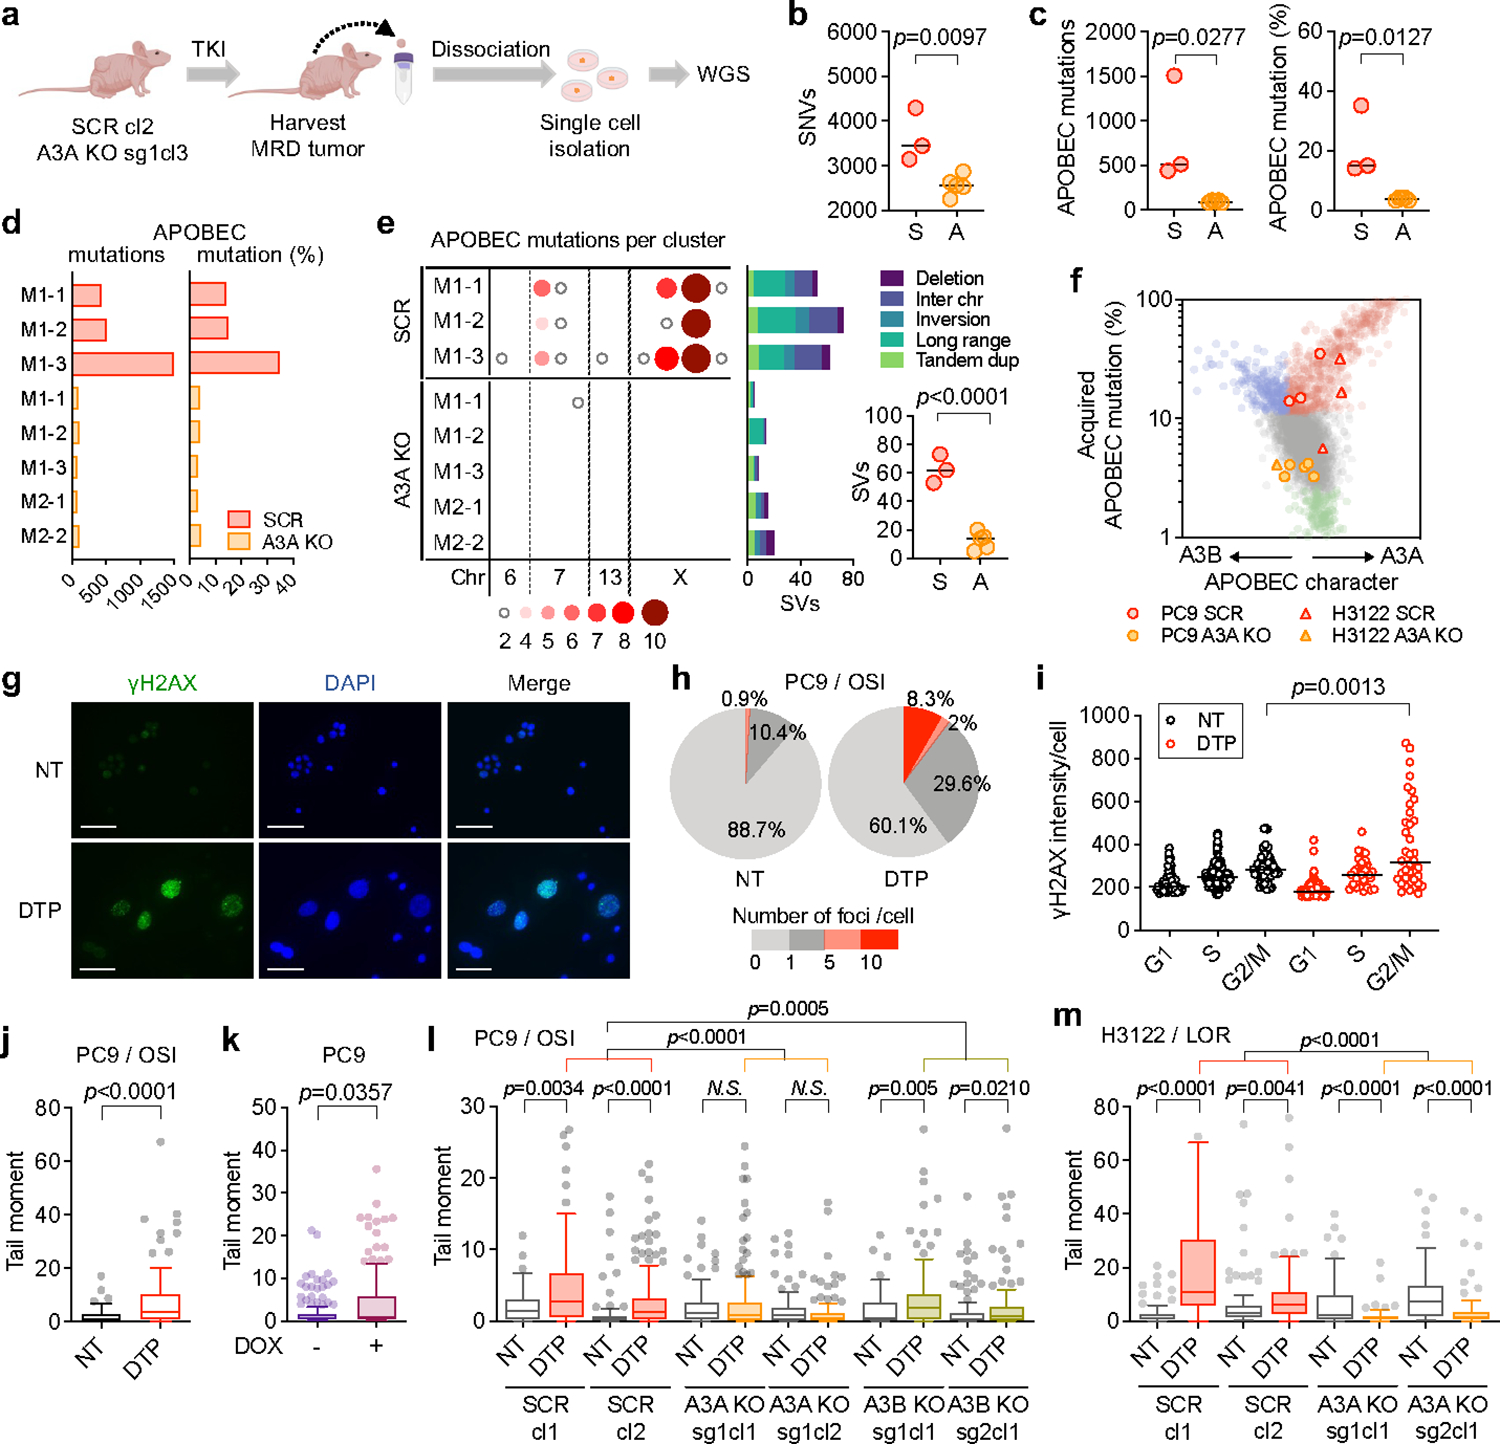
a, Schema of in vivo study of A3A and genomic instability (cl, clone; sg, sgRNA). Clones derived from PC9 MRD tumors were compared to the matched pre-treatment CRISPR clone (SCR, scrambled sgRNA; A3A KO, A3A sgRNA) to identify mutations newly acquired during TKI treatment. b-c, Acquired SNVs (b) and APOBEC mutations (c) in clones from MRD tumors (each dot represents an independent clone, bar: median, two-sided Student’s t-test, S = SCR, A = A3A KO). d-e, Total acquired (d) and clustered (e) APOBEC mutations and SVs (e) in individual MRD clones (e, bar: median, two-sided Student’s t-test). f, A3A (YTCA) and A3B (RTCA) character of acquired mutations in PC9 and H3122 (lorlatinib 1 μM) A3A KO persister clones. g-h, Immunofluorescence images and quantification of γH2AX in foci in untreated (NT) or osimertinib-treated PC9 DTPs (scale bars = 70 μm). Data are representative of three independent experiments. i, γH2AX fluorescence according to cell cycle phase, as determined by EdU/DAPI staining (see Extended Data Fig. 11f). Data are representative of two independent experiments (NT, n = 54; DTP, n = 38, bar: median, two-sided Student’s t-test). j, DSBs in PC9 DTP cells determined by neutral comet assay (n = 85 each). k, DSBs in PC9 cells overexpressing A3A upon doxycycline (DOX) induction (n = 150 each). l, m, DSBs in PC9 (n = 105 each) (l) and H3122 (m) SCR and A3A KO DTPs (n = 95 each). Data are displayed as Tukey box and whisker plots and are representative of three independent experiments with similar results and analyzed by two-sided Mann-Whitney test (j-m). DTPs = PC9 osimertinib DTP cells (g-j)
In addition to APOBEC signature SNVs, we also observed significantly higher numbers of structural variants (SVs), including translocations, inversions, and large insertions/deletions in PC9 SCR compared to A3A KO MRD tumors (Fig. 3e, right panel), similar to our findings in late-evolving PC9 resistant cells (Fig. 1j, k). Error-prone repair of double-strand DNA breaks (DSBs) or mitotic errors resulting from replicating cells containing un-repaired breaks can increase chromosomal instability, leading to genomic heterogeneity that facilitates tumor evolution 36. To understand the mechanistic basis for the chromosomal alterations caused by A3A during TKI treatment, we examined whether TKI elicits DNA damage in DTP cells. Immunofluorescence of γH2AX, a marker of the DNA damage response, was strongly increased in a subset of persister cells (Fig. 3g, h) and localized to cells in G2/M phase (Fig. 3i, Extended Data Fig. 11f). DTP cells treated with TKI for 14 days accumulated DSBs (Fig. 3j), as did cells overexpressing A3A in the absence of TKI treatment (Fig. 3k). TKI-induced DSBs were reduced upon CRISPR-mediated deletion of A3A in PC9 and H3122 cells (Fig. 3l, m). Although TKI treatment elicited an increase in DSBs in DTP cells with deletion of A3B (A3B KO), the degree of increase was modest compared to control cells (Fig. 3l, Extended Data Fig. 11g). Collectively, these data demonstrate that TKI-induced A3A promotes DNA damage, providing a mechanistic explanation for the chromosomal aberrations observed in TKI-treated cells.
APOBEC3A promotes emergence of DTPs
To assess the functional consequences of A3A cytidine deaminase on the evolution of drug resistance, we examined the effect of overexpressing A3A in NSCLC cell lines. In PC9 cells, doxycycline-inducible ectopic expression of wild-type A3A yielded significantly larger DTP colonies, whereas the catalytically inactive E72A mutant showed no significant difference (Fig. 4a, Extended Data Fig. 6e, 11h). Similar results were observed in TKI-treated MGH119–1 and H3122 cells (Fig. 4b, Extended Data Fig. 11i). Conversely, shRNA knockdown or CRISPR-mediated deletion of A3A suppressed the emergence of DTP colonies upon TKI treatment in PC9 and H3122 cells (Fig. 4c, d, Extended Data Fig. 11a, c, j). Re-expression of wild-type A3A in PC9 A3A KO cells (“A3A back”) restored the ability to form DTP colonies in the presence of osimertinib (Fig. 4d, Extended Data Fig. 11k), confirming that the effect is A3A-specific. To directly compare the ability of DTP clones with or without TKI-induced A3A to emerge during therapy, we performed competition experiments using cell pools comprised of 50:50 RFP-labeled A3A KO and GFP-labeled SCR cells, using multiple KO and SCR clones to mitigate against clone-specific effects.PC9 and H3122 CRISPR KO cells were treated with 1 μM osimertinib or lorlatinib for 4 weeks, respectively, and surviving DTP populations were quantified by flow cytometry (Fig. 4e, Extended Data Fig. 11l). Consistent with the results of the colony-formation assays, after four weeks of TKI treatment, control SCR clones gave rise to the majority of DTPs, with near complete extinction of A3A KO clones (Fig. 4f, Supplementary Fig. 5). Finally, we examined the consequences of A3A deletion on the emergence of drug-resistant clones over long-term TKI treatment (Fig. 4g). A3A deletion significantly reduced the emergence of PC9 drug-resistant clones after 12 weeks of treatment. We also observed a modest decrease in drug-tolerant clones upon deletion of A3B. Thus, TKI-induced A3A increases the survival of drug-tolerant persister cells and subsequent emergence of resistant clones.
Fig. 4 |. TKI-induced APOBEC3A increases emergence of drug-tolerant persister cells.
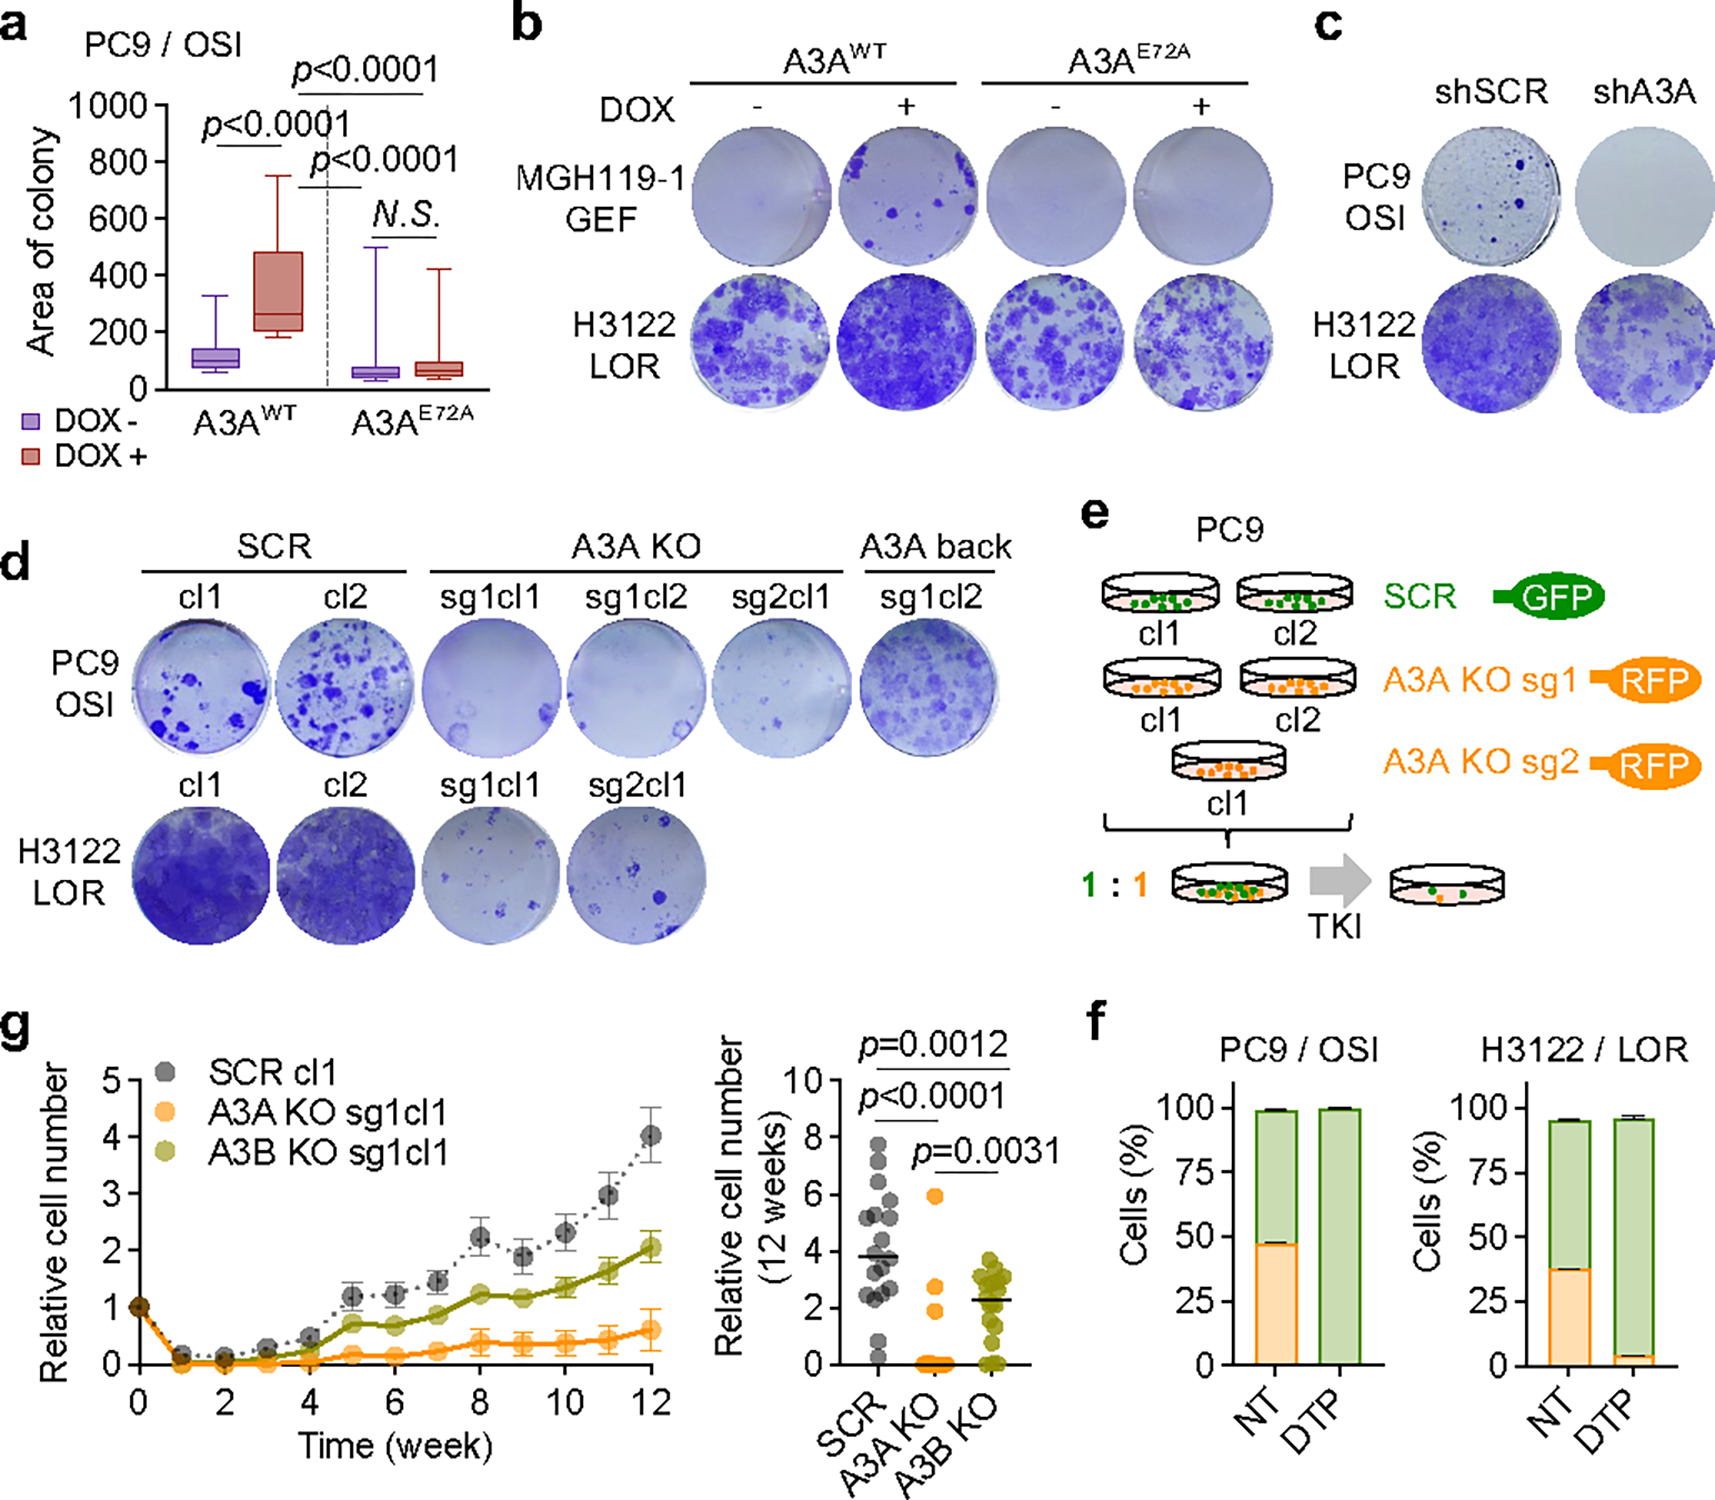
a, Effect of A3A expression on PC9 DTP formation. Tet-On A3AWT or A3AE72A cells were treated with DOX for 14 days to induce A3A expression, then treated with osimertinib for 4 weeks. The area of the 30 largest DTP colonies was quantified. Data are representative of three independent experiments with similar results (n = 30 colonies each, Tukey box and whisker plots, two-sided Student’s t-test). b, DTP colonies of MGH119–1 and H3122 cells with DOX-induction of A3AWT or A3AE72A (as in panel a) after gefitinib or lorlatinib treatment, respectively. c, DTP colonies of PC9 or H3122 cells with shRNA A3A knockdown after TKI treatment. Data are representative of three independent experiments. d, DTP colonies of PC9 or H3122 SCR or A3A KO clones, or with re-expression of A3A (A3A back), after TKI treatment (cl, clone; sg, sgRNA). Data are representative of three independent experiments. e, Schema of competition assay using fluorescently labeled A3A KO/SCR cells. SCR (GFP) and A3A KO (RFP) cells were mixed in a 1:1 ratio and treated with TKIs for 4 weeks. f, Surviving PC9 (left) or H3122 (right) DTPs were quantified by flow cytometry. Data are representative of three independent experiments. g, Effect of A3A on emergence of resistant cells over time. Replicate pools (5,000 cells, n=18) of PC9 SCR, A3A KO or A3B KO cells were treated with osimertinib for 12 weeks and cell number was assessed using RealTime-Glo assay. Left, cell survival curve (mean ± s.e.m.); right, cell number of each pool at week 12 (bar: median, two-sided Student’s t-test).
APOBEC mutations in TKI-treated tumors
To investigate the clinical significance of our experimental findings, we performed WGS or WXS to determine the APOBEC mutation frequency in tumor samples from an additional 19 NSCLC patients (18 EGFR-mutant, 1 NTRK fusion) that had developed acquired TKI resistance. Combined with the 5 patients described in Figure 1, this expanded cohort comprised 62 tumor samples representing 15 pre-treatment and 47 post-treatment timepoints from 24 patients (Fig. 5a, Extended Data Fig. 12a). The majority of patients received sequential TKI treatment, with tumor specimens obtained from a median of 2 post-treatment timepoints (range 1–4) (Extended Data Fig. 12b, c). First, we compared the NMF-defined percentage of APOBEC mutations in the pre-treatment and post-TKI resistant tumors (Fig. 5b). Of the 15 patients with pre-treatment biopsies, two patients (MGH804 and MGH1071) had a high level (> 20%) of APOBEC mutations before treatment, while the remaining 13 had pre-treatment APOBEC mutation percentages less than 20%. Among the 24 patients with post-TKI resistant biopsies, 17/24 (71%) had APOBEC mutation percentages of > 20% after treatment (Extended Data Fig. 12e). Pre-treatment biopsies were lacking for nine patients, thereby preventing us from knowing whether the APOBEC mutations in their post-TKI samples were acquired after treatment. For the 15 patients with paired pre- and post-treatment samples, stratifying tumors according to a range of APOBEC mutation percentages, we found that the frequency of APOBEC-high tumors increased after TKI treatment (Fig. 5c and Extended Data Fig. 12g, left). We next hypothesized that a longer duration of treatment might be more likely to be associated with tumor evolution compared to early progression, which may be more likely to represent emergence of pre-existing resistant clones (Extended Data Fig. 12f). Excluding the two patients with known APOBEC-high mutation signatures before treatment, we compared patients with tumor samples taken less (early) or more (late) than 18 months after starting TKI therapy (Fig. 5d, e). Amongst the 12 patients with only late tumor samples and 10 patients with only early samples, we observed a trend toward increasing APOBEC mutation frequency with longer duration of treatment (Fig. 5f and Extended Data Fig. 12g, right). Given that our cohort included several patients with sequential tumor samples spanning both early and late time points, including several that exhibited lower APOBEC mutation percentages at an early timepoint and then higher percentages at later timepoints, we fitted a mixed-effects model to the APOBEC mutation percentage as a function of treatment duration, with patients treated as random effects. This combined analysis of the entire dataset of 62 serial samples demonstrated a significant positive correlation between APOBEC mutation percentage and treatment duration (p = 0.0023) independent of any applied thresholds (Fig. 5g), providing clinical evidence supporting the hypothesis that APOBEC mutations accumulate in tumors that evolve in response to TKI therapy over time. Finally, we characterized all patient tumors based on YTCA/RTCA enrichment and A3A-optimal hairpin motifs. The majority of post-treatment samples with elevated APOBEC mutation frequencies exhibited A3A character (Fig. 5h, i), supporting a role for A3A mutagenesis in clinical tumor evolution during targeted therapy treatment.
Fig. 5 |. APOBEC mutations are enriched in NSCLCs with acquired TKI resistance.
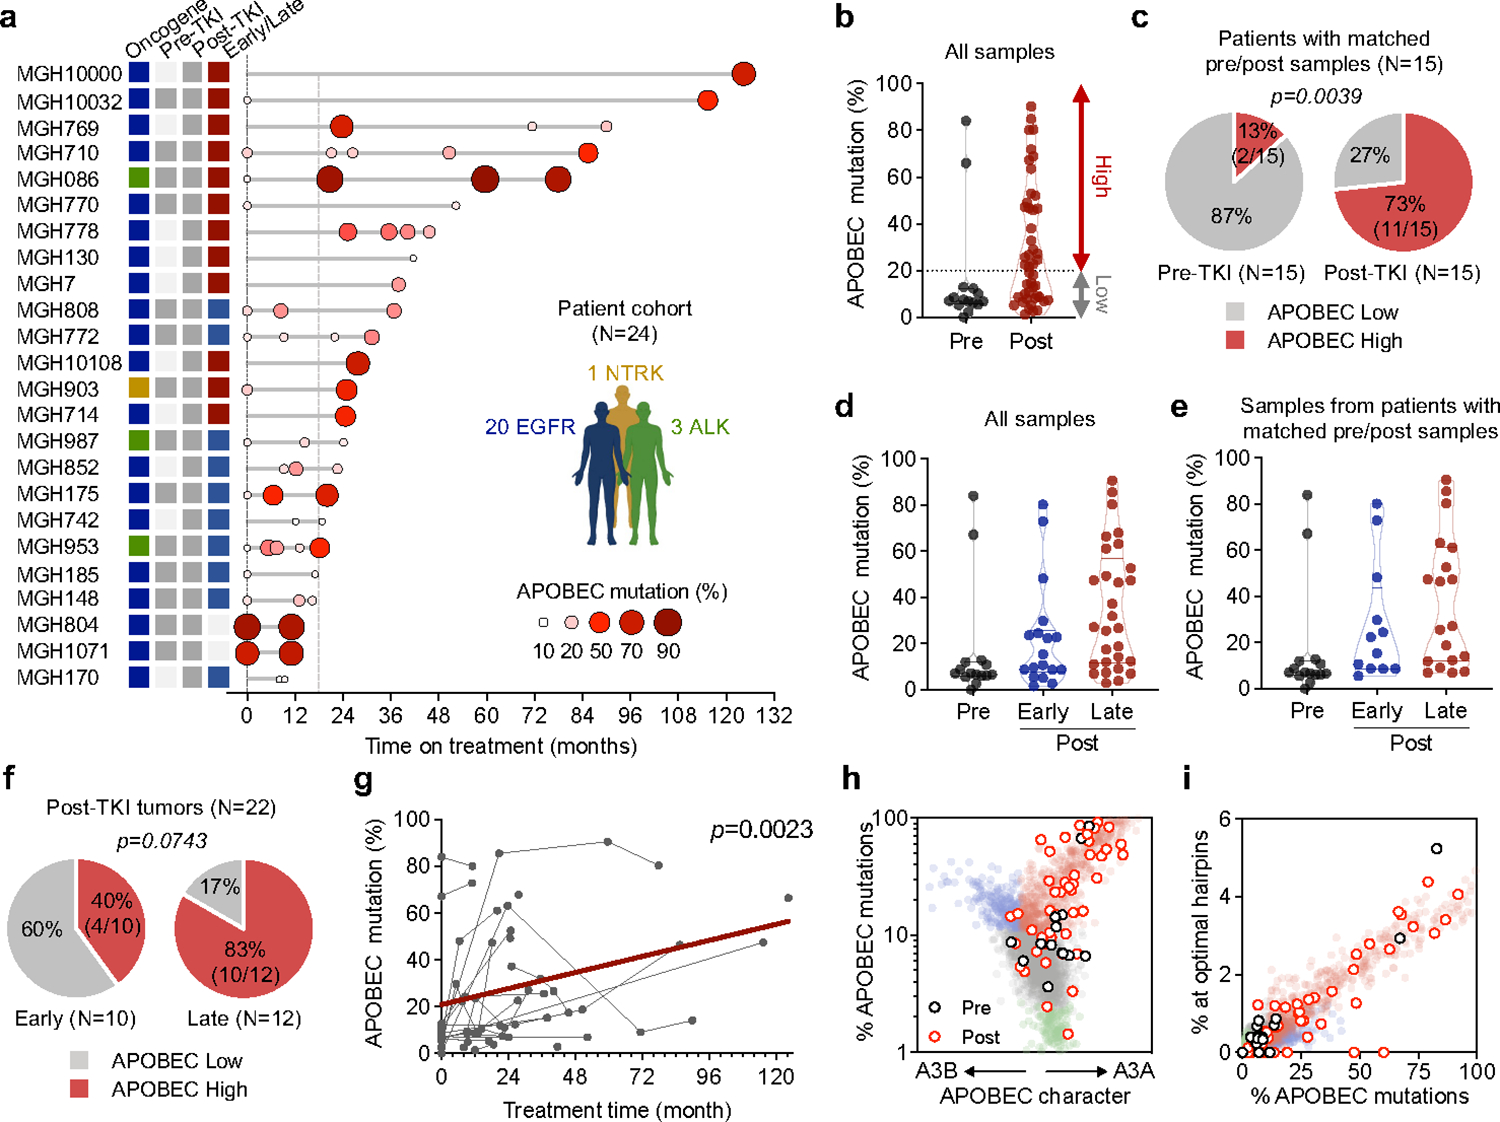
a, APOBEC mutation percentage in tumor samples from 24 NSCLC patients treated with targeted therapies. Left columns represent driver oncogenes (blue: EGFR, green: ALK, yellow: NTRK) and existence of pre/post-treatment samples (gray: yes, white: no). Patients with first progression before or after 18 months are designated “early” (blue) or “late” (red), respectively. For patients with multiple concurrent on-treatment or autopsy samples (MGH086, MGH10032, MGH953), the sample with the highest APOBEC mutation percentage was used. b, APOBEC mutation percentage in all pre-treatment (n = 15) and post-treatment (n = 47) samples. APOBEC mutation >= 20% was defined as APOBEC “high” and less than 20% “low”. c, Frequency of APOBEC-high tumors in patients with matched pre- and post-treatment samples (McNemar’s test). d, APOBEC mutation percentage in all tumor samples. Pre-treatment (n = 15), post-treatment (early, n = 18) and post-treatment (late, n = 29). e, APOBEC mutation percentage in all tumors from the 15 patients with pre-TKI samples. Pre-treatment (n = 15), post-treatment (early, n = 12) and post-treatment (late, n = 19). f, Frequency of APOBEC-high tumors in patients with early resistant samples or only late resistant samples (McNemar’s test), excluding the two patients (MGH804 and MGH1071) with baseline APOBEC-high tumors prior to treatment. g, Correlation between APOBEC mutation percentage and treatment time in all samples (n = 62) from the 24 patients. A mixed-effects model was fitted to assess APOBEC mutation percentage in serial tumor samples as a function of treatment duration with patients treated as random effects. h-i, A3A (YTCA) and A3B (RTCA) character (h) and A3A hairpin motif mutations (i) of pre- and post-treatment tumors from all 24 patients. Significant p values were determined based on two-sided hypothesis (c, f, g).
Discussion
We demonstrate that clinical lung cancer targeted therapies can induce expression of A3A that contributes to the evolution of drug-tolerant persister cells (Extended Data Fig.12h). In the majority of NSCLC patients treated with targeted therapies, we found an enrichment of APOBEC mutational signatures, particularly in those who received extended duration, and often multiple lines of TKI therapy. In this context, the acquisition of an APOBEC mutational signature may be indicative of the evolutionary path taken by resistant clones. Our results suggest that suppression of oncogenic signaling is sufficient to induce APOBEC-driven mutagenesis in lung cancers, illustrating a novel mechanism by which targeted therapies might perversely increase the adaptive mutability of cancer cells.
While our studies support a predominant role for A3A, it is possible that additional APOBEC family members, some of which were co-expressed in our experimental models, may also contribute to evolution of tumor cells treated with targeted therapies. We found that deletion of A3B partially suppressed the emergence of DTPs during TKI treatment, raising the possibility that other APOBEC proteins may cooperate with A3A in evolving tumors. Although the actions of both A3A and A3B can lead to similar genomic sequelae (e.g. SBS2 and SBS13 mutational signatures), recent studies have begun to unravel context-specific differences in mutational patterns resulting from either A3A or A3B mutagenesis. Most of our NSCLC post-treatment samples showed enrichment of APOBEC mutations in the YTCA context 19 and in stem-loop hairpin motifs 20, both reported to be A3A-favored sites. Emerging evidence suggests that omikli cluster mutations are associated with A3A in some tumor types (breast cancer, lung adenocarcinoma, lung squamous cell carcinoma, melanoma and head and neck squamous cell carcinoma) 15. Consistent with that study, we primarily observed the accumulation of small clusters of APOBEC mutations in TKI-treated cells and xenograft mouse tumors. Collectively, these results support the contribution of A3A to tumor evolution during targeted therapy in NSCLC.
We describe an ALK-fusion positive NSCLC patient (MGH086) that developed multiple resistance mutations each occurring at classic APOBEC mutation motifs. However, the most common clinical EGFR and ALK secondary acquired resistance mutations (e.g., EGFRT790M, EGFRC797S, ALKG1202R) result from base substitutions outside of nucleotide contexts preferred by APOBECs and are unlikely to directly result from APOBEC mutagenesis. Additionally, the majority of the A3A-associated RNA editing events that we detected in mRNA transcripts are synonymous substitutions not predicted to change protein sequence (Extended Data Fig. 6h) 20. Analysis of acquired driver mutations in PC9 early/late resistant clones and 15 patients who had paired pre and post samples (Supplementary Table 10, 11) revealed APOBEC-context driver mutations known from previous reports (PIK3CA, PIK3CB, CTNNB1, KLF5, NFE2L2, ALK) in a subset of patients (Extended Data Fig. 12i). However, other patients and experimental models did not harbor clear likely drivers, suggesting that the effects of APOBEC3A in driving drug resistance are not restricted to the generation of specific recurrent drug-resistance mutations in all cases. Additionally, we note that the induction of A3A expression and accumulation of APOBEC mutations in post-TKI tumors was not universal, suggesting that additional mechanisms that modulate therapy-induced APOBEC mutagenesis may remain to be discovered. Consistent with our findings, a recent study of EGFR-mutant lung cancers progressing after first-line osimertinib therapy reported an increase in the frequency of APOBEC mutations in a subset of patients37. Nevertheless, our data suggest that inhibiting A3A may represent a potential therapeutic strategy to prevent or delay acquired resistance to lung cancer targeted therapy. Efforts to develop catalytic APOBEC inhibitors have been described 38, but no small molecules with high potency or selectivity have been reported to date. An alternate approach may be to inhibit the expression of A3A. We identified NFκB as a key transcription factor responsible for TKI-induced A3A expression; however, further investigation will be required to determine the optimal upstream node to target therapeutically. In summary, our study reveals a novel mechanism that drives evolution of targeted therapy drug resistance and provides a rationale for developing therapeutic strategies to target APOBEC3A in NSCLC.
Methods
Cell lines and cell culture
All cell lines are listed in Supplementary Data Table 1. PC9, H3255, H3122, H2228, LU-65 and H358 cells were obtained from the MGH Center for Molecular Therapeutics. The identities of these cell lines were verified by STR analysis (Bio-synthesis, Inc.) at the time that these studies were performed. Patient-derived cell lines were established in our laboratory from core biopsy or pleural effusion samples as previously described 31,39. All patients signed informed consent to participate in a Dana-Farber–Harvard Cancer Center Institutional Review Board–approved protocol giving permission for research to be performed on their samples. All cell lines were maintained in RPMI (Life Technologies) supplemented with 10% FBS (Life Technologies) except for H3255, MGH119–1 and MGH006–1, which were maintained in ACL4 medium (Life Technologies) with 10% FBS, and MGH953–1 cells, which were cultured in DMEM with 10% FBS. Gefitinib-resistant PC9-GR2, PC9-GR3 were established by culturing parental cells in escalating concentrations of gefitinib (10 nM-1 μM), as tolerated, as previously described 39. Early, drug-tolerant, late PC9 resistant clones were established by culturing in 300 nM gefitinib until resistant, at which point they were maintained in 1 μM gefitinib, as previously described 11. MGH119–1 (GR-A, GR-B) and H3255 (GR) gefitinib resistant cells were established by culturing parental cells in 1 μM gefitinib until resistant. H3122 lorlatinib resistant clones (LRB, LRC) were established by culturing parental cells in increasing concentrations of lorlatinib as previously described 13. During generation of resistance, media and drug were replaced twice per week. All experiments were performed in RPMI with 10% FBS. All cells were routinely tested and verified to be free of mycoplasma contamination.
Generation of drug-tolerant persister (DTP) cells
Drug-sensitive cells were treated with 1 μM of the relevant TKI for 14 days unless otherwise specified. Viable cells remaining attached on the dish at the end of drug treatment were considered to be DTP cells and were harvested for each study.
Antibodies and reagents
For western blotting and immunofluorescence, the antibodies used are listed in Supplementary Data Table 2. For cell culture studies, gefitinib (GEF: 1st generation EGFR inhibitor), osimertinib (OSI: 3rd generation EGFR inhibitor), lorlatinib (LOR: ALK inhibitor), trametinib (TRA: MEK inhibitor), GDC0941 (GDC: PI3K inhibitor), ARS1620 (KRASG12C inhibitor), TPCA-1 (IKKβ inhibitor) (all from Selleck), AMG 510 (KRASG12C inhibitor, Chemgood) and PF 184 (IKKβ inhibitor, Tocris Bioscience) were dissolved in DMSO to a final concentration of 10 mmol/L and stored at −20 °C. Unless otherwise specified, 1 μM concentration or 100 nM trametinib and 24 hours treatment time were used for in vitro cell culture experiments. Recombinant Human TNF-alpha was purchased from R&D systems (#10291-TA-020).
Whole-genome and whole-exome DNA sequencing
Whole-genome sequencing (WGS) and whole-exome sequencing (WXS) were performed on DNA extracted from cell lines, snap-frozen tumor specimens or FFPE-preserved tumor tissue. Library preparation and Illumina paired-end sequencing was performed by the Broad Institute Genomics Platform, Novogene, or New York Genome Center.
Broad Institute Genomics Platform: WGS sequencing libraries were prepared from 100–150 ng genomic DNA using the KAPA Hyper Prep with Library Amplification Primer Mix, product KK8504) with palindromic forked adapters with unique 8 base index sequences embedded within the adapter (purchased from IDT). PCR-amplified libraries were sequenced on an Illumina HiSeq X sequencer (151bp paired-end reads). WES libraries were prepared from from 100 ng genomic DNA using the KAPA HyperPrep kit followed by exonic hybrid capture using SureSelect v2 Exome bait (Agilent) or Illumina TruSeq Rapid Exome Kit. Sequencing was performed on an Illumnina HiSeq X sequencer (paried-end 76 bp reads).
Novogene:
WGS libraries were prepared from 200 ng genomic DNA using the NEBNext Ultra DNA Library Prep Kit (E7370) in accordance with the manufacturer’s instructions. Libraries were sequenced on an Illumina NovaSeq 6000 sequencer using 2×150bp cycles. WES libraries were prepared from 1.0 μg genomic DNA using the Agilent SureSelect Human All ExonV6 kit (Agilent Technologies, CA, USA) following manufacturer’s recommendation and were sequenced on an Illumina NovaSeq 6000 sequencer using 2×150bp cycles.
New York Genome Center:
WGS libraries were prepared from 200 ng genomic DNA using the KAPA HyperPrep kit (KAPA KR0961 – v7.19) in accordance with the manufacturer’s instructions. Libraries were sequenced on an Illumina HiSeqX sequencer using 2×150bp cycles. WES libraries were prepared from 200 ng genomic DNA using the KAPA Hyper Prep kit (KAPA KK8502) in accordance with the manufacturer’s instructions. 750ng of each library was captured using the Agilent SureSelect XT Human All Exon v4 51Mb (Agilent 5190–4633) capture probes and hybridization kit (Agilent G9641B) in accordance with the manufacturer’s instructions. Libraries were sequenced on an Illumina HiSeq2500 sequencer using 2×125bp cycles.
Sequencing was analyzed using the published Broad Institute pipelines 28,40. Reads were aligned to the human genome (build hg19) using bwa 41, then processed through the Picard pipeline (http://broadinstitute.github.io/picard) to recalibrate base quality scores, sort reads, mark duplicate reads, and perform indel realignment. Somatic mutations were called using MuTect 42, and polymorphisms and mutations in parental samples were called using MuTect in unpaired mode. Somatic mutations were filtered to remove variants observed in parental samples. Analysis of shared and private mutations, and construction of sample phylogenies, was performed as previously 13,43–45. Briefly, for each patient or cell line, all sample’s somatic mutations were combined into a single list, and supporting reads for each mutation were tabulated in each sample. Mutations were grouped into patterns of shared presence or absence across samples, and by shared clonal fraction.“Shared early” mutations in the PC9 clones were identified by being detectable (>= 2 reads, >= 1% of total reads) in all of the early-emerging samples. Clustered mutations (kataegis and omikli) were identified in each sample as runs of consecutive mutations (n >= 5 and n = 2–4, respectively) separated from each other by < 1 kb. Mutational signature analysis was performed as previously 20,46,47. Samples from our cohort were aggregated with data from The Cancer Gene Atlas (TCGA) 48 and the International Cancer Genome Consortium (ICGC) Pan-Cancer Analysis of Whole Genomes project (PCAWG) 28, and non-negative matrix factorization (NMF) was used to decompose mutation lists into seven mutational signatures corresponding to known mutation processes including APOBEC, aging, and smoking. The fraction of mutations due to each signature was obtained from the NMF weighting factors. APOBEC3A (A3A) and APOBEC3B (A3B) mutation character was measured as described previously 18–20, by calculating the fraction of cytosine mutations occurring in the contexts YTCA or RTCA, respectively. To obtain a directional metric of each patient’s overall A3A vs. A3B mutation character, we calculated fracYTCA minus twice fracRTCA. Mutations at DNA hairpins were identified as described previously 20, and the fraction of mutations occurring at optimal hairpins (those with expected relative mutation rate of ≥4) was calculated. Genomic copy number was analyzed as described previously 44, with read depth normalized to total sample coverage and segmented using circular binary segmentation. Purity and ploidy estimates were achieved by iteratively searching for the set of parameters that minimizes the total distance between each profile’s copy-number segments and the nearest integer copy-number state using Matlab’s fminsearch function. Purity of cell-line samples was fixed at 1. Copy ratio was corrected for purity and ploidy to yield total absolute copy number. Acquired copy-number changes were computed by subtracting the copy number of the parental sample. Genomic segments that changed in copy number between each derived sample and its parent were identified, and the extent of these changes was quantified as a single metric dWGII, a differential version of the established Weighted Genomic Integrity Index metric 16 defined as the fraction of the genome that either gained or lost at least one DNA copy, relative to the parental sample. Somatic structural variants (SVs) were identified using dRanger and BreakPointer as described previously 44,49. SVs of different structural classes were counted and visualized alongside mutation and copy-number data with CIRCOS plots 50 created using the Circa software (http://omgenomics.com/circa).
Clonal tracking of resistant clones using DNA barcoding
PC9 cells were infected with the lentiviral Cellecta 3.2K DNA barcode library comprised of unique 13 nt sequences (Cellecta) at an MOI of 0.3. After puromycin selection, barcoded single cell clones were established by limiting dilution. 150 single-cell clones were minimally expanded, with a portion of each population cryopreserved for subsequent use. The remainder of the clones were recombined to re-establish a polyclonal population, which was then divided into three replicates and treated with gefitinib until the development of acquired drug resistance. Representative samples of the pre-treatment and post-resistant populations, as well as intermediate drug-tolerant populations, were subjected to deep next-generation sequencing of the barcode cassette (performed by Cellecta) to determine the presence and population frequency of each barcode. For each of the three replicates, the fully resistant population was represented by a single dominant barcode. Barcode sequences of each of the 150 pre-treatment clones were determined by Sanger sequencing in order to match the fully resistant and drug-tolerant clones with their pre-treatment parents.
RNA-seq analysis of gene expression and mRNA editing activity
RNA-sequencing was performed at the Broad Institute Genomics Platform or at the MGH Next Generation Sequencing Core. Broad Institute: Sequencing libraries were prepared from polyadenosine (polyA)-selected RNA using the Illumina TruSeq™ Stranded mRNA Sample Preparation and were sequenced on an Illumnina HiSeq2500 (101 bp paired-end reads). MGH: Sequencinglibraries were constructed from polyadenosine (polyA)-selected RNA using the NEBNext Ultra Directional RNA Library Prep Kit for Illumina (New England BioLabs) and sequenced on an Illumina HiSeq2500 instrument. RNA sequencing data was aligned to the hg19 genome and transcriptome using the STAR aligner v2.5.3a 51. Read counts for individual transcripts were produced with HTSeq-count v0.6.1. For mRNA editing analysis, A3A-mediated mRNA editing was monitored at the RNA hairpin hotspot in the gene DDOST as described previously 18, calculating in each sample the percentage of reads carrying a G->A change at chr1:20981977 (reflecting a C->U editing event at the mRNA level). Expanding beyond the single DDOST editing hotspot, we created the ApoTrack panel of RNA editing hotspots, which encompasses the top ~2000 most A3A-optimal RNA hairpins in the human transcriptome, and calculated in each sample the number of reads carrying evidence of a C->U editing event at one of these hotspot sites, divided by the total number of reads (in thousands) covering these sites to yield a final metric of edited reads per thousand. The list of optimal RNA hairpin sites and code used to run ApoTrack is available at https://github.com/m0s0lawrence/ApoTrack.
ATAC-seq analysis
Untreated and gefitinib-treated PC9 cells were trypsinized and cryopreserved. ATAC-seq was performed by Active Motif. 100,000 nuclei were tagmented as previously described 52, with some modifications based on Corces et al. 53 using the enzyme and buffer provided in the Nextera Library Prep Kit (Illumina). Tagmented DNA was then purified using the MinElute PCR purification kit (Qiagen), amplified with 10 cycles of PCR, and purified using Agencourt AMPure SPRI beads (Beckman Coulter). Resulting material was quantified using the KAPA Library Quantification Kit for Illumina platforms (KAPA Biosystems), and sequenced with PE42 sequencing on the NextSeq 500 sequencer (Illumina). ATAC-seq reads in fastq format were trimmed to remove adapter sequences using skewer v0.2.2. Trimmed reads were aligned to hg19 using bowtie2 v2.3.3.1 54 with the following parameters: -D 20 -R 3 -N 1 -L 20 –local -i S,1,0.50 –rdg 5,1 –rfg 5,1 -X 2000. Alignments were filtered using samtools v1.9 55 to remove duplicate reads and retain only proper pairs with mapping quality greater than 30. Reads mapping to blacklisted regions were removed using samtools v1.9. Reads were converted to bed format and reads on the forward and reverse strands were shifted +4 and −5 bp respectively. MACS2 v2.1.1 56 was then used to call peaks and summits using the following parameters: –nomodel –extsize 200 –shift -100 –nolambda –keep-dup all -q 0.1. IDR v2.0.4.2 was used to filter enriched regions at an IDR of less than 0.05 to produce high-confidence peak and summit sets. High-confidence summits were expanded to 500 bp and a count matrix was generated with Rsubread v1.30.9 57. This matrix was imported to R and chromVAR v1.20.0 58 was used in conjunction with motifs in the JASPAR2018 v1.1.1 (10.18129/B9.bioc.JASPAR2018) 59 and chromVARmotifs (https://github.com/GreenleafLab/chromVARmotifs) R packages to generate motif-level measures of differential accessibility. Signal tracks were generated from bigwig files created from aligned bams using Deeptools v3.1.1 bamCoverage command 60 with the following parameters: –Offset 1 -bs 50 –smoothLength 150 –maxFragmentLength 2000 –scaleFactor SCALEFACTOR. Scaling factors for each sample were generated by quantifying total cutsites within each sample’s IDR-filtered peaks and dividing by 1e6.
Quantitative RT-PCR assay for gene expression
Cells were seeded 24 hours prior to addition of drug and grown to a confluency of 80%. Cells were treated with drugs for 24 hours and RNA was extracted using the RNeasy Mini Kit (Qiagen, #74106). cDNA was prepared from 500 ng total RNA with the Superscript First Strand cDNA Synthesis Kit (Invitrogen, #11904018) using oligo-dT primers. Quantitative PCR was performed using LightCycler FastStart DNA Master SYBR Green I (Roche, #4913850001) on a LightCycler 480 with analysis software v1.5 (Roche). mRNA expression relative to TBP mRNA levels was calculated using the delta-delta threshold cycle (ΔΔCT) method. Primer sequences are listed in Supplementary Data Table 3 8.
Digital PCR assay
Purified RNAs were reverse-transcribed using a High-Capacity cDNA Reverse Transcription Kit (Thermo Fisher Scientific) and used for either droplet digital PCR (ddPCR) platform (BioRad) or QuantStudio Absolute Q Digital PCR (Thermo Fisher Scientific). For ddPCR, 1 to 20 ng of cDNA and indicated primers (2 μL) were added in the PCR reactions (ddPCR Supermix for Probes (No dUTP) mix from Bio-Rad) in a total of 25 μL. Then, 20 μL of the reaction mix was added to a DG8 cartridge (Bio-Rad), together with 70 μL Droplet Generation Oil for Probes (Bio-Rad) following by the generation of droplets using a QX200 Droplet Generator (Bio-Rad). Droplets were next transferred to a 96-well plate before to start the PCR reaction in thermal cycler (C1000 Touch Thermal Cycler, Bio-Rad) under the following conditions: 5 min at 95 °C, 40 cycles of 94 °C for 30 s, 53 °C for 1 min and then 98 °C for 10 min (ramp rate: 2 °C s−1). Droplets were analyzed with the QX200 Droplet Reader (Bio-Rad) for fluorescent measurement of fluorescein amidite (FAM) and hexachloro-fluorescein (HEX) probes with QuantaSoft analysis software (Bio-Rad) to obtain fractional abundances of edited RNAs. For AbsoluteQ digital PCR, cDNA (1 to 10 ng) and indicated primers (2 μL) were added in the PCR reactions (1x Absolute Q DNA Digital PCR Master Mix) in a total of 9μL. Next, the reaction mix was loaded to QuantStudio MAP16 Digital PCR Plate with 15μL of QuantStudio Absolute Q Isolation Buffer overlay. The reaction was run in the thermal cycler (QuantStudio Absolute Q Digital PCR System, Thermo Fisher Scientific) under the following conditions: 10 min at 96 °C, and 45 cycles of 95°C for 5s and 56 °C for 10s. Partitions were analyzed for fluorescent measurement of fluorescein amidite (FAM) and hexachloro-fluorescein (HEX) probes with QuantStudio Absolute Q Analysis Software (Thermo Fisher Scientific) to obtain fractional abundances of edited RNAs. Gating was performed based on positive and negative DNA oligonucleotide controls to obtain fractional abundances of edited RNAs. DDOST primers are: DDOST Forward Sequence: ACTGAGAACCTGCTGAAG; DDOST Reverse Sequence: AAGAGGATGGGATTTAGAGA; DDOST 558C Probe Sequence: CAACCATCGTTGGGAAATC (Fluorophore: HEX), and DDOST 558T Probe Sequence: CCAACCATTGTTGGGAAATC (Fluorophore: FAM).
Doxycycline-inducible overexpression of A3A and A3B
cDNA was synthesized by GenScript with a beta-globin intron between exons 2 and 3 of A3A and a Flag tag at the C-terminus. The plasmid expressing Flag-A3A or Flag-A3B was generated by inserting the cDNA into the pInducer20 vector using the Gateway Cloning System (Thermo Fisher Scientific) 61. Cells were seeded into 6-well plates at a density of 2 × 10⁵ cells per well. 24 hours later, cells were infected with wild-type or catalytically inactive mutant (A3AE72A, A3BE255Q) viral particles for 24 hours at 37°C with 8 μg/mL of polybrene (Millipore, #TR-1003-G). PC9 cells were selected in 600 μg /mL of G418 (Gibco, #10131035) for 4 days. Cells were incubated with 200 ng/mL of doxycycline (Sigma) for 72 hours. Flag-A3A/A3B expression was confirmed by western blotting.
Lentiviral shRNA knockdown
Non-targeting scrambled (SCR) control and APOBEC3A-specific shRNAs in the pLKO.1 vector (from MGH Molecular Profiling Laboratory) were packaged into lentiviral particles by co-transfection of 293T cells with VSV-G and Δ8.91 packaging vectors using the TransIT-LT1 transfection reagent (Mirus). PC9 cells were seeded into 6-well plates at a density of 2 × 10⁵ cells per well, then 24 hours later, infected with viral particles for 24 hours at 37°C with 8 μg/mL of polybrene. PC9 cells were selected in 2 μg/mL of puromycin for 4 days. APOBEC3A knockdown efficiency was confirmed by quantitative RT-PCR.
CRISPR/Cas9 deletion
Plasmid pX458 (Addgene #48138) 62 was used for expression of the gRNA and the human codon-optimized SpCas9 protein. Target sequences for CRISPR interference were designed using the sgRNA designer developed by the Broad Institute (http://portals.broadinstitute.org/gpp/public/analysis-tools/sgrna-design). A non-targeting sgRNA from the Gecko library v2 was used as a scramble sgRNA. sgRNA target sequences are listed in Supplementary Data Table 3. Complementary oligonucleotides encoding the gRNAs targeting APOBEC3A sequence were annealed and ligated into pX458. One day prior to transduction, 1 × 10⁵ cells were seeded into a single well of a 24-well plate. The cells were transfected with Lipofectamine 3000 Reagent (Thermo Fisher Scientific, #L3000015) according to the manufacturer’s protocol. Four days after transduction, GFP-positive cells were sorted by flow cytometry. The knockout efficacy was confirmed by direct sequencing of the edited alleles, western blotting or ddPCR assay for APOBEC3A enzymatic activity.
siRNA knockdown
siRNA pools or individual siRNAs were purchased from Horizon and are listed in Supplementary Data Table 3. PC9 cells were seeded in 6-well plates (2.5 × 10⁵ cells per well). Subsequently, 150 pmol of siRNAs were introduced with DharmaFECT 1 Transfection Reagent (Dharmacon, #T-2001–02). 48 hours later, cells were treated with or without 1 μM osimertinib for 24 hours. Knockdown efficacy was evaluated by western blotting 72 hours later.
Western Blotting
Cells were treated with TNFα (100 ng/mL for 6 hours), TKI; osimertinib, lorlatinib (1 μM for 24 hours) or IKKβ inhibitor; TPCA-1, PF184 (1 μM for 24 hours). Whole cell lysates: Cells were lysed in RIPA buffer containing protease and phosphatase inhibitors following centrifugation. Nuclear-cytoplasmic lysates: 6 million cells were extracted using Nuclear Extraction Kit (Active motif, #40010) following the manufacturer’s protocol. Western Blotting was performed as previously described 13. Primary and secondary antibodies are listed in Supplementary Data Table 2. Imaging of blots was performed using the G:BOX Chemi -XRQ with analysis software GeneSys v1.6.5.0 (Syngene).
Chromatin immunoprecipitation (ChIP)-PCR
ChIP experiments were performed using the SimpleChIP® Plus Enzymatic Chromatin IP Kit (Cell Signaling Technology, #9005) following the manufacturer’s protocol. PC9 cells were treated with or without 1 μM osimertinib for 48 hours. MGH064–1 cells were treated with or without 1 μM lorlatinib for 48 hours. 6 million cells treated with indicated treatments were fixed with 1% formaldehyde for 10 minutes at room temperature followed by quenching with glycine. The cells were then lysed and the chromatin was fragmented by enzymatic digestion using micrococcal nuclease (30 min at 37 °C). IgG (2 μg) or NFκB1 (2 μg) antibodies (Supplementary Data Table 2) were incubated with 10 μg of digested and cross-linked chromatin for 16 h at 4 °C. Protein G magnetic beads were added for an additional 2 hours. After immunoprecipitation, chromatin–protein complexes were eluted from protein G magnetic beads and reverse cross-linked. Eluted DNA was purified and quantified by qPCR. The sequences of primers (3,000–3,500 bp upstream from A3A transcription start site, NM_145699.4) are listed in Supplementary Data Table 3.
Comet assay to assess double-strand DNA breaks
Single-cell gel electrophoresis was carried out by using Trevigen’s comet assay kit (#4250–050-K) with slight modifications. Briefly, PC9 cell suspension (4 × 10⁵/mL) and melted LM agarose (at 37°C) were prepared in 1:10 (v/v) ratio. 50 μL of this solution was added to the comet slide. Slides were then kept at 4°C in the dark for 10 min followed by 37°C for 5 min to enhance agarose adhesion. The slides were placed in an ice-cold lysing solution for 90 min at 4°C. After lysis, slides were immersed in freshly prepared neutral electrophoresis buffer (pH =9, 500 mM Tris base, 150 mM Sodium acetate) for 30 min at 4°C in the dark. Subsequently, the slides were placed in an electrophoresis chamber filled with cold neutral buffer and run for 60 min at 15V at 4°C. After the run, slides were incubated in DNA precipitation solution (Ammonium acetate 1 M in 95% ethanol) for 30 min at room temperature and then incubated in 70% ethanol for 30 min at room temperature. Slides were dried at 37°C and then stained with SYBR™ Gold (Invitrogen, #S7563) for 30 min at room temperature. After rinsing in water and drying at 37°C, slides were mounted with SlowFade™ Diamond Antifade Mountant (Invitrogen, #S36963). Slides were imaged with an ECHO Revolve microscope and pictures were analyzed with the OpenComet ImageJ plug-in v1.3.1 63. Quantification of the comet tail moment was calculated by multiplying the % of DNA in the tail by the distance between the means of the head and tail distributions.
Immunofluorescence-based cell-cycle profiling
PC9 cells were grown on coverslips. Before performing the staining, cells were incubated in media containing 5-ethynyl-2’-deoxyuridine (EdU) 10 μM for 60 min at 37°C. Cells were then washed twice with cold PBS and fixed for 15 minutes at room temperature with PBS 3.7% formaldehyde. After fixation, cells were permeabilized with PBS 0.5% Triton-X 100 for 10 min at room temperature. Afterwards cells were washed twice with PBS 0.1% Tween and blocked for 60 min at room temperature with blocking solution (PBS, 2.5% bovine serum albumin, 0.1% Tween). Both primary and secondary antibodies were diluted in blocking solution. After 3 hours incubation with primary antibody at room temperature, cells were washed three times with PBS 0.1% Tween and incubated with secondary antibody for 60 min at room temperature. Finally, EdU detection was performed by using Click-iT™ EdU Alexa Fluor™ 647 Imaging Kit (Thermo scientific, #C10340) following manufacture’’s instructions. Coverslips were mounted with SlowFade™ Diamond Antifade Mountant with Dapi (Invitrogen, #S36964) and imaged with an ECHO Revolve microscope. Images were analyzed and fluorescence was quantified with MATLAB software. In brief, cell nuclei were segmented using a custom-made image processing pipeline that is able to distinguish them from the background. The pipeline identifies the nuclei based on DAPI staining and their size and circularity. Nuclei that are too close to image borders or each other and cannot be individually segmented were automatically removed by the software. Both γH2AX and EdU fluorescence intensities were quantified by the software only within the segmented nuclei.
Crystal violet colony formation assay
Cells were seeded to give a confluency of ~80%. Cells were drugged the following day. Tet-On A3A overexpressing MGH119–1 and H3122 cells were treated with 100 nM gefitinib or lorlatinib respectively. PC9 A3A KO cells were treated with 100 nM osimertinib. Media and drug were replaced twice per week. After 4–6 weeks in drug, DTP cells were fixed with 10% glutaraldehyde (Fisher Scientific, #BP2547–1) and stained with 0.1% crystal violet (Sigma, V5265–500ML). Number and area of colonies was quantified using ImageJ2 v2.9.0.
Fluorescent cell labeling
Cells were infected with IncuCyte Nuclight Lentivirus with 8 μg/mL of polybrene (SARTORIUS, Green #4624, Orange #4771) which provides homogeneous expression of nuclear-restricted TagGFP (green fluorescent protein) or TagRFP (orange fluorescent protein) and selected in 2 μg/mL puromycin for 5–7 days.
Flow cytometry
For analysis of cells labeled with nuclear fluorescent proteins, cells were trypsinized, washed in PBS, and then analyzed using a Fortessa flow cytometer (BD Biosciences). The nuclear fluorescence was analyzed using FloJo v10.8.1 software (FlowJo, LLC).
RealTime-Glo cell viability assay
Cell viability was assayed in situ once a week starting the day after seeding, using the RealTime-Glo MT Cell Viability Assay (Promega, #G9713) according to the manufacturer’s protocol. Briefly, MT Cell Viability Substrate and NanoLuc Enzyme were diluted 1:500 in medium, and 25 μl was added to each well (1/5 total final volume). Cells were incubated for 1 hour at 37 °C and luminescence was measured by SpectraMax i3x with SoftMax Pro software v7.0.2 (Molecular Devices). Fresh medium containing drug was used to replace the assay reagents immediately after each assay.
Mouse xenograft studies
All mouse studies were conducted through Institutional Animal Care and Use Committee–approved animal protocols in accordance with institutional guidelines (MGH Subcommittee on Research Animal Care, OLAW Assurance A3596–01). For xenograft studies, cell line suspensions were prepared in 1:10 matrigel (Corning, # 354262) and 5 × 10⁶ cells were injected subcutaneously into the flanks of female athymic nude (Nu/Nu) or male NSG mice (6–8 weeks old). Visible tumors developed in approximately 2–4 weeks. Tumors were measured with electronic calipers and the tumor volume was calculated according to the formula Vol = 0.52 × L × W2. Mice with established tumors were treated with osimertinib at 5 mg/kg (10% 1-methyl-2- pyrrolidone, 90% PEG300) once daily by oral gavage and tumor volumes were measured twice weekly, as described above. Mice were treated until tumors had reached stable minimal residual disease state defined by no change in tumor volume for at least 2 consecutive measurements. Investigators performing tumor measurements were not blinded to treatment groups. Tumors for RNA analyses were snap-frozen in liquid nitrogen immediately upon harvesting. Tumors for whole-genome sequencing were dissociated with Tumor Dissociation Kit, human (Miltenyi Biotec, #130–095-929) using gentleMACS Octo Dissociator (Miltenyi Biotec). Single-cell clones were established by limiting dilution from dissociated tumor cell suspensions.
Data and statistical analysis
Data were analyzed using GraphPad Prism software v8.4.3 (GraphPad Software). Pairwise comparisons between groups (for example, experimental versus control) were made using paired or unpaired Student’s t-tests or Mann-Whitney tests as indicated. For patient sample analysis, McNemar’s test was used to compare the frequency of APOBEC-high tumors between two groups; 1) pre-TKI and post-TKI timepoints in patients with matched pre- and post-treatment samples; 2) early and late resistant timepoints in patients with early resistant samples or only late resistant samples. A mixed-effects model was fitted to characterize the pattern of APOBEC mutation (%) in serial tumor samples as a function of treatment duration using SAS 9.4 (SAS Institute, Cary, NC) with patients treated as random effects.
Extended Data
Extended Data Fig. 1 |. APOBEC mutational signatures in NSCLC patients with compound resistance mutations.
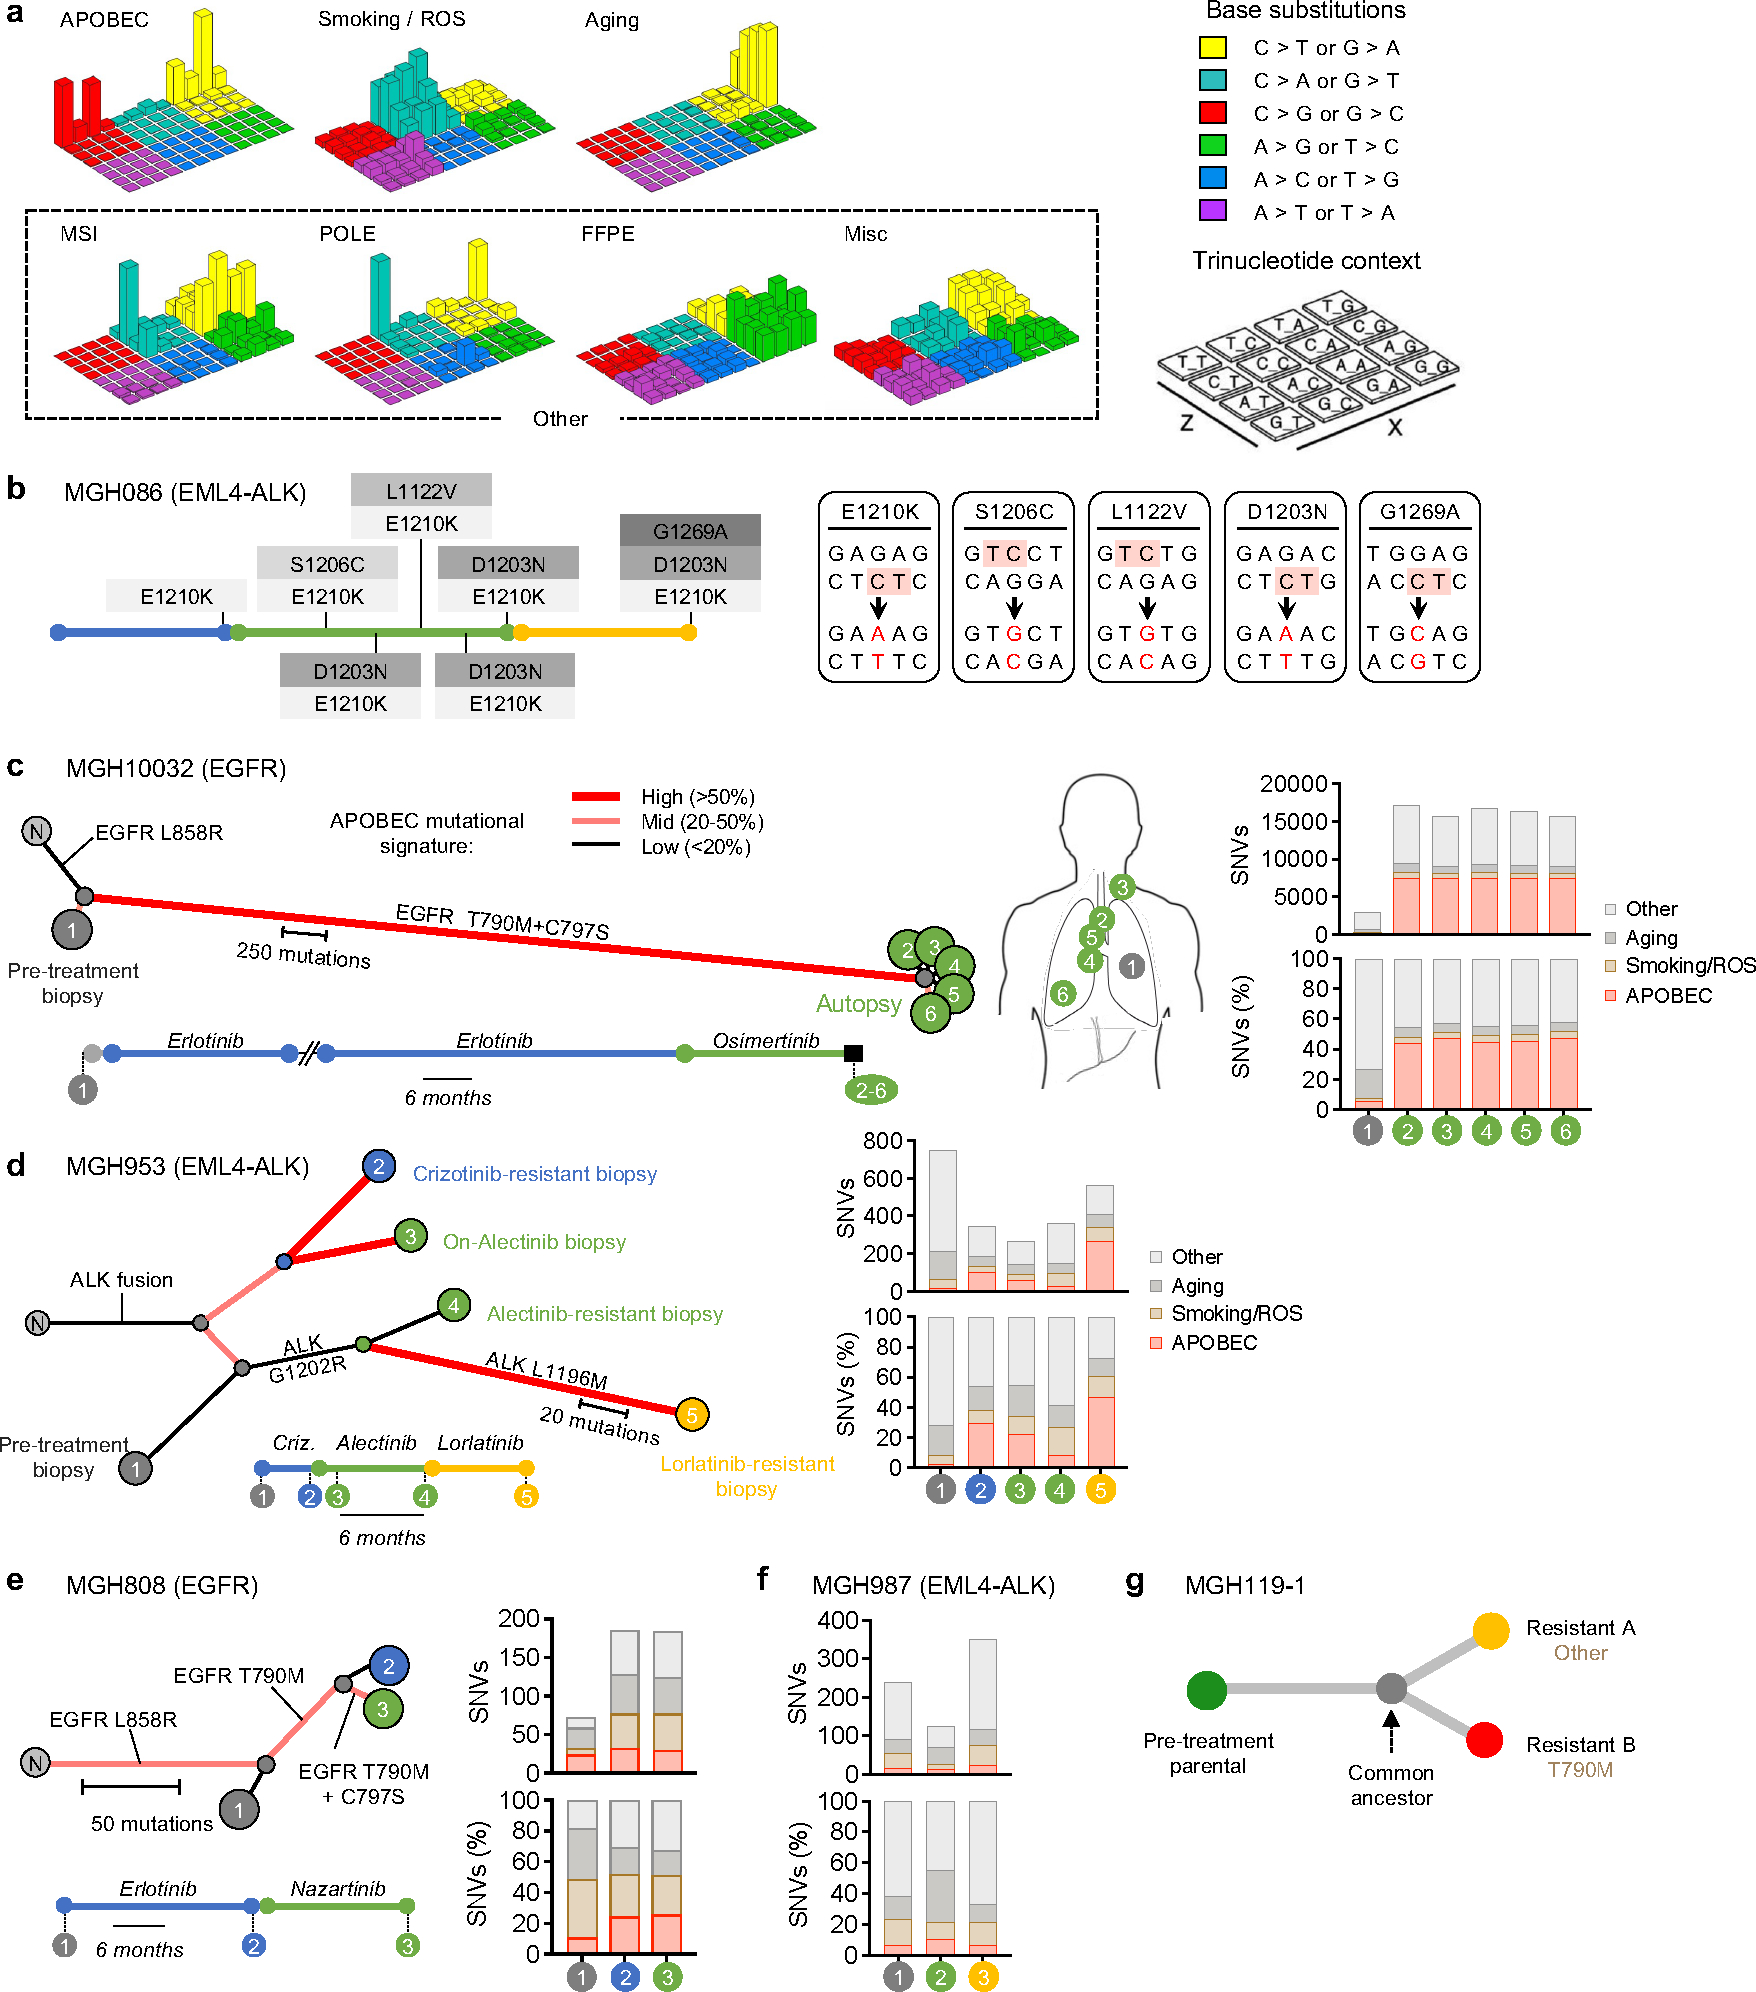
a, Lego plots of the 7 mutational signatures resolved by NMF with assigned biological process. Smoking and ROS (reactive oxygen species) mutations were mixed. For simplicity, MSI (microsatellite instability), POLE (error-prone polymerase), FFPE (formalin-fixed, paraffin-embedded) and Misc (miscellaneous) signatures are combined and plotted as “Other” throughout the manuscript. Base substitutions were classified into six subtypes and each category was represented by different colors. Base substitutions were further divided into 96 possible mutation types according to the flanking nucleotides surrounding the mutated base. b, Treatment history and acquired compound mutations in MGH086. Treatment lines are colored blue (first-line TKI), green (second-line TKI), yellow (third-line TKI). Five ALK amino acid changes result from base substitutions at TpC sites. c, Mutational signatures (right panel) and clonal relationship of pre-treatment biopsies (left panel) and autopsy sites from patient MGH10032 after sequential EGFR TKI therapy (middle panel). Amino acid substitutions are indicated for each resistance mutation. Branches colors depict the fraction of mutations corresponding to an APOBEC signature. Branches length represents APOBEC mutation number. Treatment timelines were colored blue (first-line TKI) and green (second-line TKI). N, normal. d-f, Mutational signatures and clonal relationship of multiple sequential biopsies from patient MGH953 13, MGH808 and MGH987 13 over the course of sequential TKI therapy. Amino acid substitutions are indicated for each resistance mutation. Branches colors depict the fraction of mutations corresponding to an APOBEC signature. Branches length represents APOBEC mutation number. Treatment timelines were colored blue (first-line TKI), green (second-line TKI), yellow (third-line TKI). N, normal. g, Clonal relationship of MGH119–1 gefitinib resistant clones.
Extended Data Fig. 2 |. Detailed clinical histories and mutational heterogeneity of compound mutation cohort.
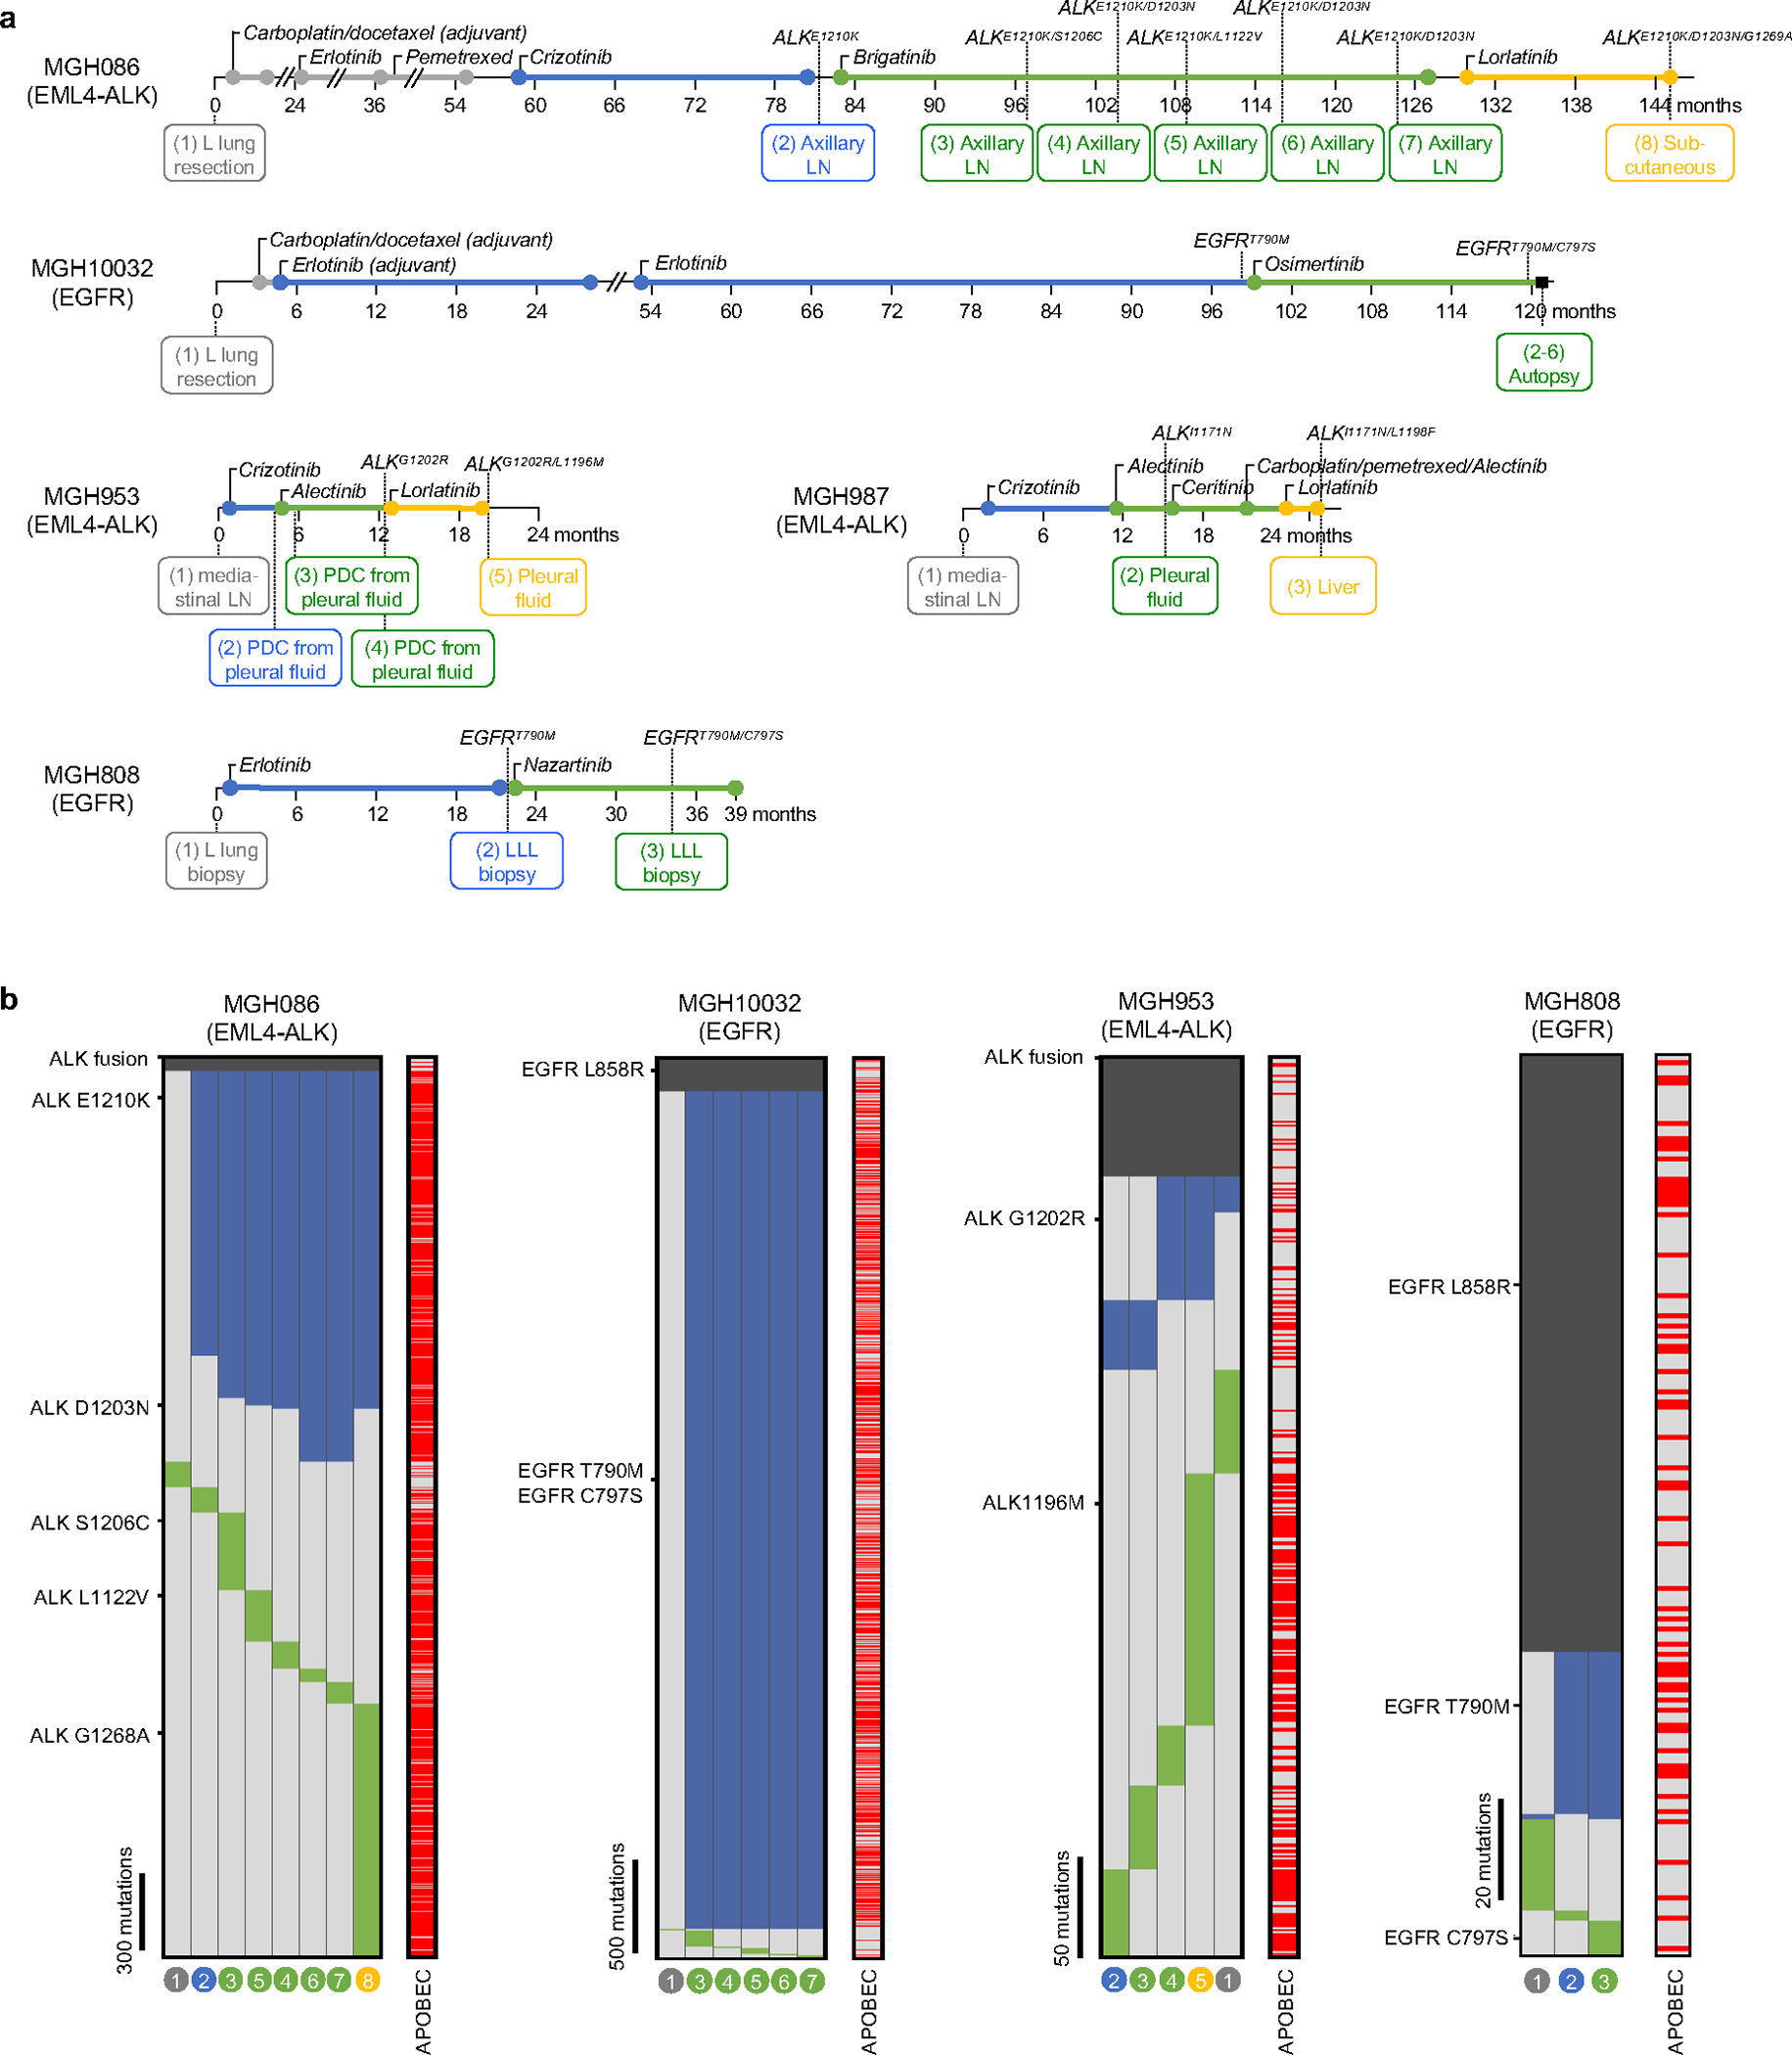
a, Sample collection timing and resistant driver mutations. Treatment time (month) lines are colored gray (chemotherapy), blue (first-line TKI), green (second-line TKI), yellow (third-line TKI). Samples were derived from surgical resection, biopsy, autopsy or pleural fluid (L lung, left lung; LN, lymph node; PDC, patient-derived cell line; LLL, left lower lobe). b, Heatmaps depict presence of mutations in each sample from MGH086, MGH10032, MGH953, and MGH808. Truncal mutations present in all samples are colored dark gray, shared mutations common to 2 or more samples are colored blue, and private mutations are colored green. APOBEC mutations are indicated in red. The absence of a mutation is denoted by light gray. The primary and resistant driver mutations are shown on the left. The sample numbers correspond to Fig. 1a, Extended Data Fig. 1c–e.
Extended Data Fig. 3 |. TKI-resistant clones that evolve from drug-tolerant persister cells accumulate APOBEC mutations.
a, Number and percentage of TCT>TGT and TCA>TGA mutations that are highly specific for APOBEC 43 in early (E) and late (L) resistant clones (bar: median, two-sided Mann Whitney test). b, Number of omikli (n = 2, 3, or 4 mutations with an intermutational distance < 1 kb) and kataegis (n >= 5 mutations with an intermutational distance of < 1 kb) mutation clusters in early and late resistant clones. c, Shared and private mutations in early and late resistant clones. Shared mutations in early resistant clones refer to mutations shared across early clones from one individual. Private mutations in resistant clones refer to mutations observed in only one sample of an individual and are not shared across other samples. d, Phylogenetic tree depicting evolutionary relationships of early and late resistant clones based on pattern of shared and private mutations. e, Mutational signatures of private and shared mutations in PC9 early and late resistant clones. Late resistant clones exhibited significantly higher private APOBEC mutation percentage compared to early resistant clones (two-sided Mann Whitney test). f, Relationship between timing of EGFRT790M mutation, TKI treatment and APOBEC mutational signatures for shared and private mutations.
Extended Data Fig. 4 |. Chromosomal aberrations in TKI-resistant clones.
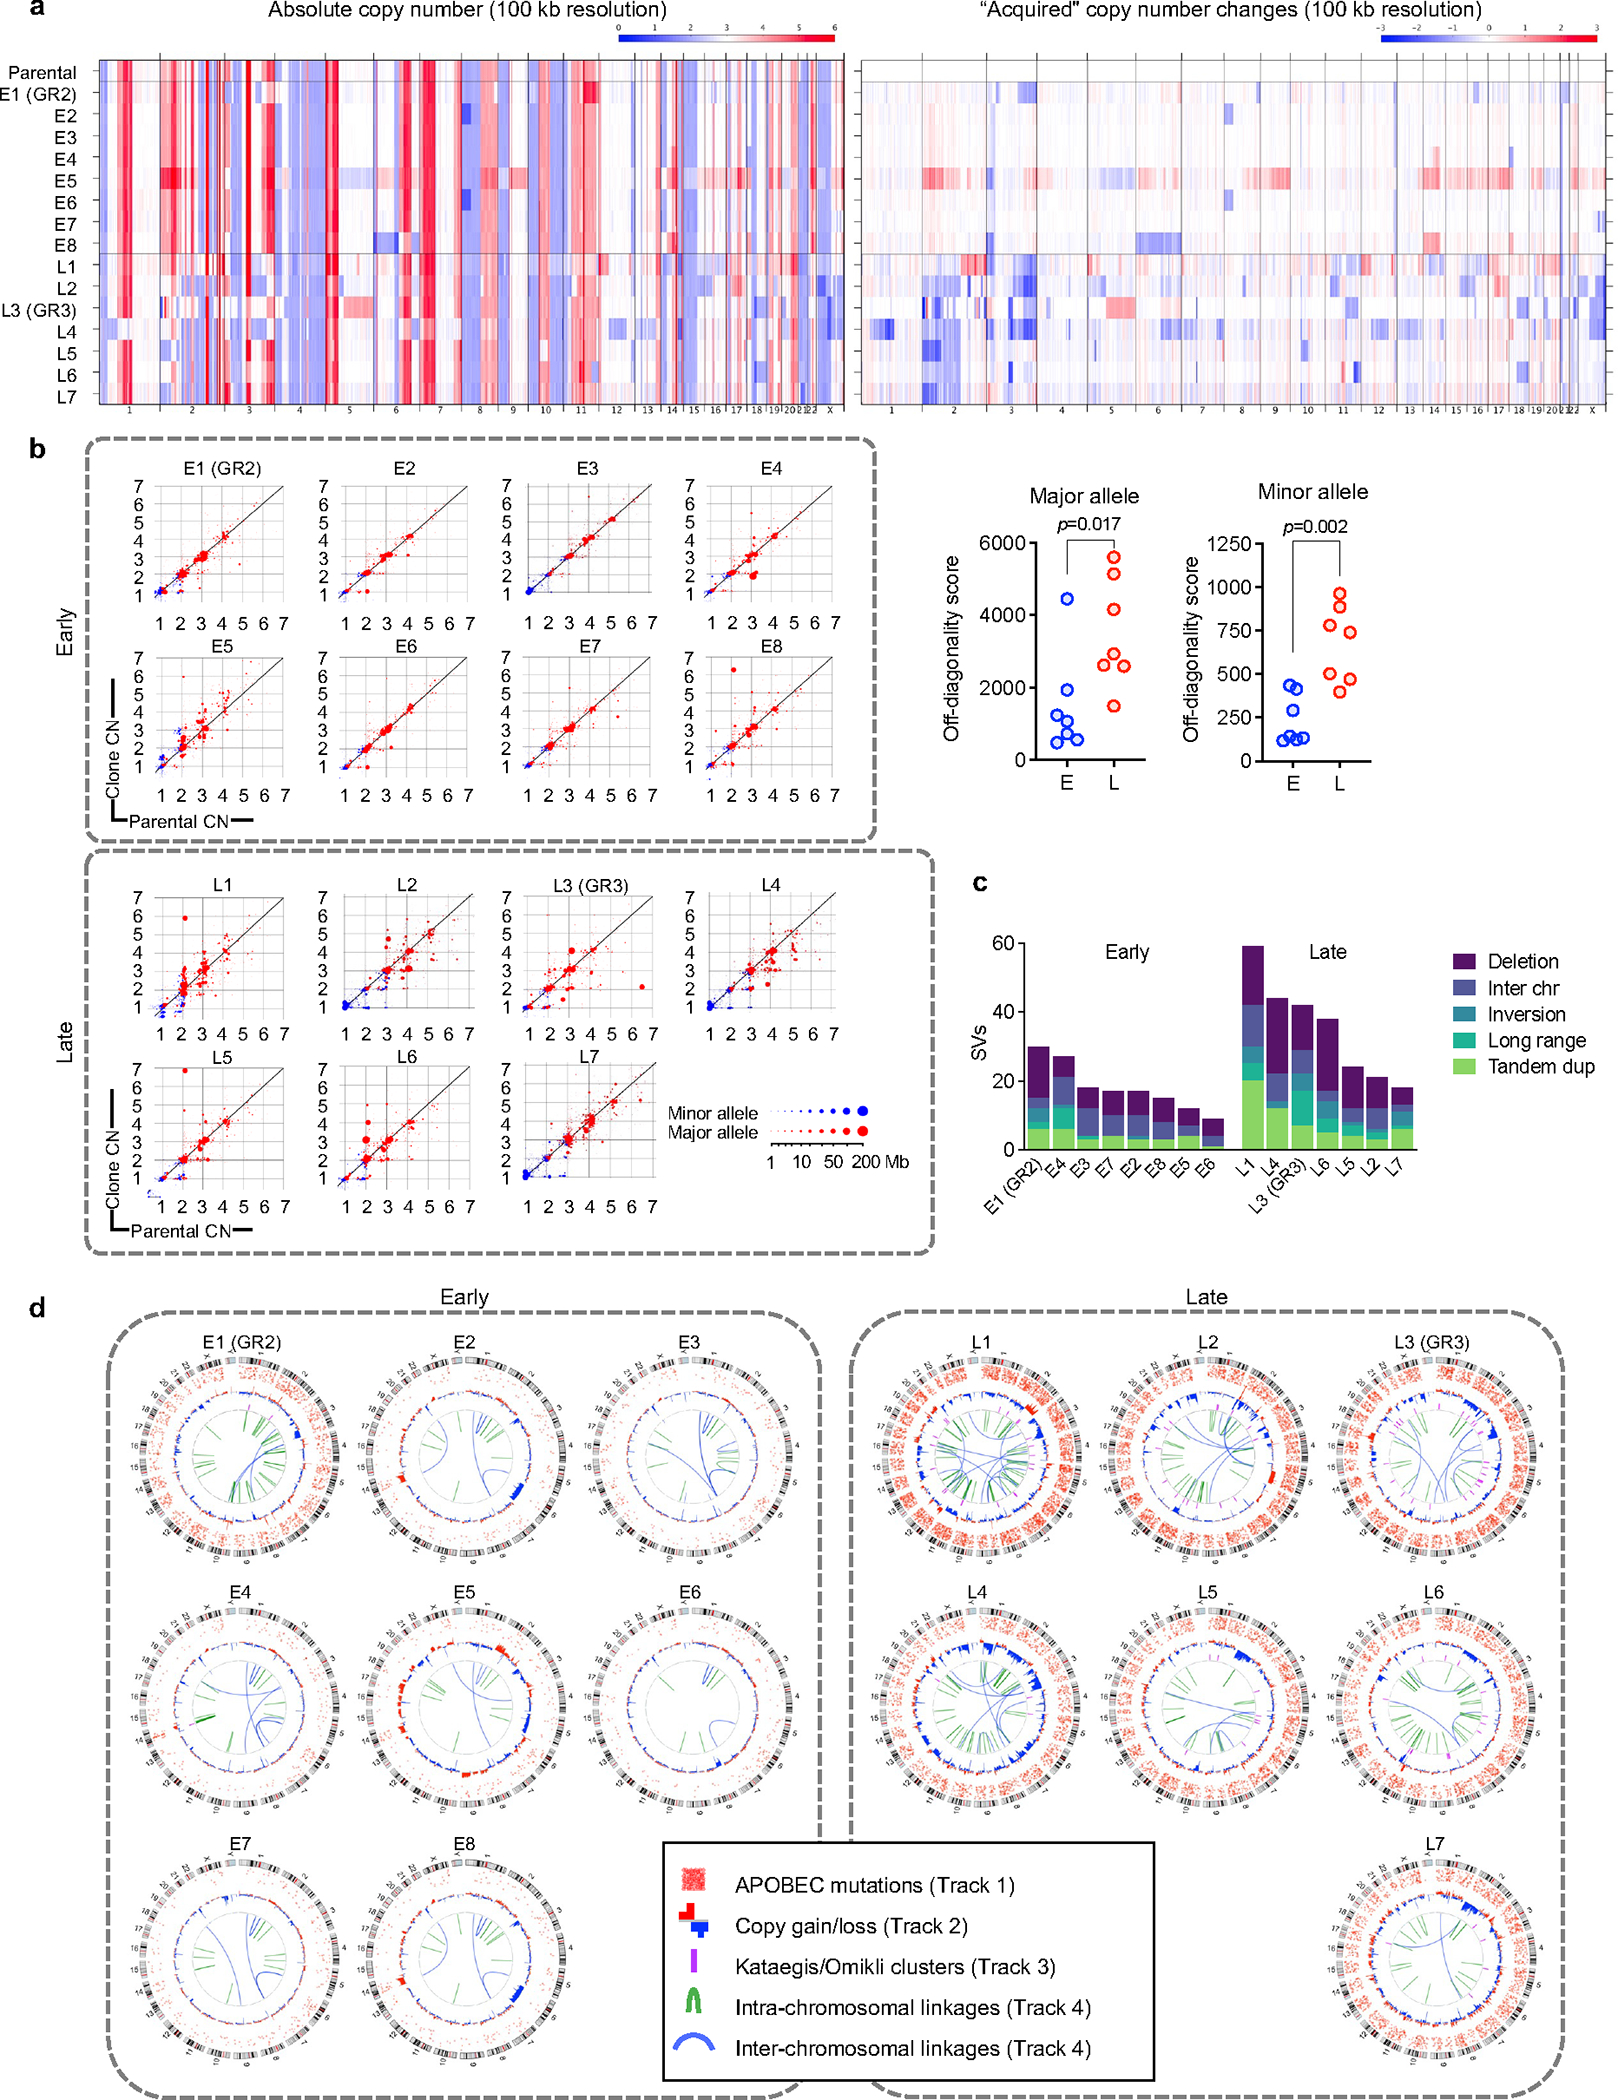
a, Copy number profiles of early and late resistant PC9 clones. b, Copy number changes in each sample are shown on scatter plots where the y-axis is the copy number in the sample, and the x-axis is the copy number in the parental sample it was derived from. Genomic copy number segments are shown for both the minor allele (blue) and major allele (red). Size of points corresponds to the size of the copy-number segments. Points along the diagonal represent genomic segments that did not change in copy number between the parental and derived sample. Points above and below the diagonal represent copy-number gains and losses, respectively, relative to the parental sample (Right panels, two-sided Mann Whitney test). c, Late-evolving PC9 clones have increased SVs compared with early resistant clones. SVs were determined relative to parental cells using dRanger and Breakpointer. d, Circos plots depicting APOBEC mutations, copy number changes, kataegis/omikli mutation clusters and intra/inter-chromosomal interactions in PC9 resistant clones (all relative to parental cells).
Extended Data Fig. 5 |. APOBEC mutations do not occur spontaneously while culturing cells in the absence of drug.
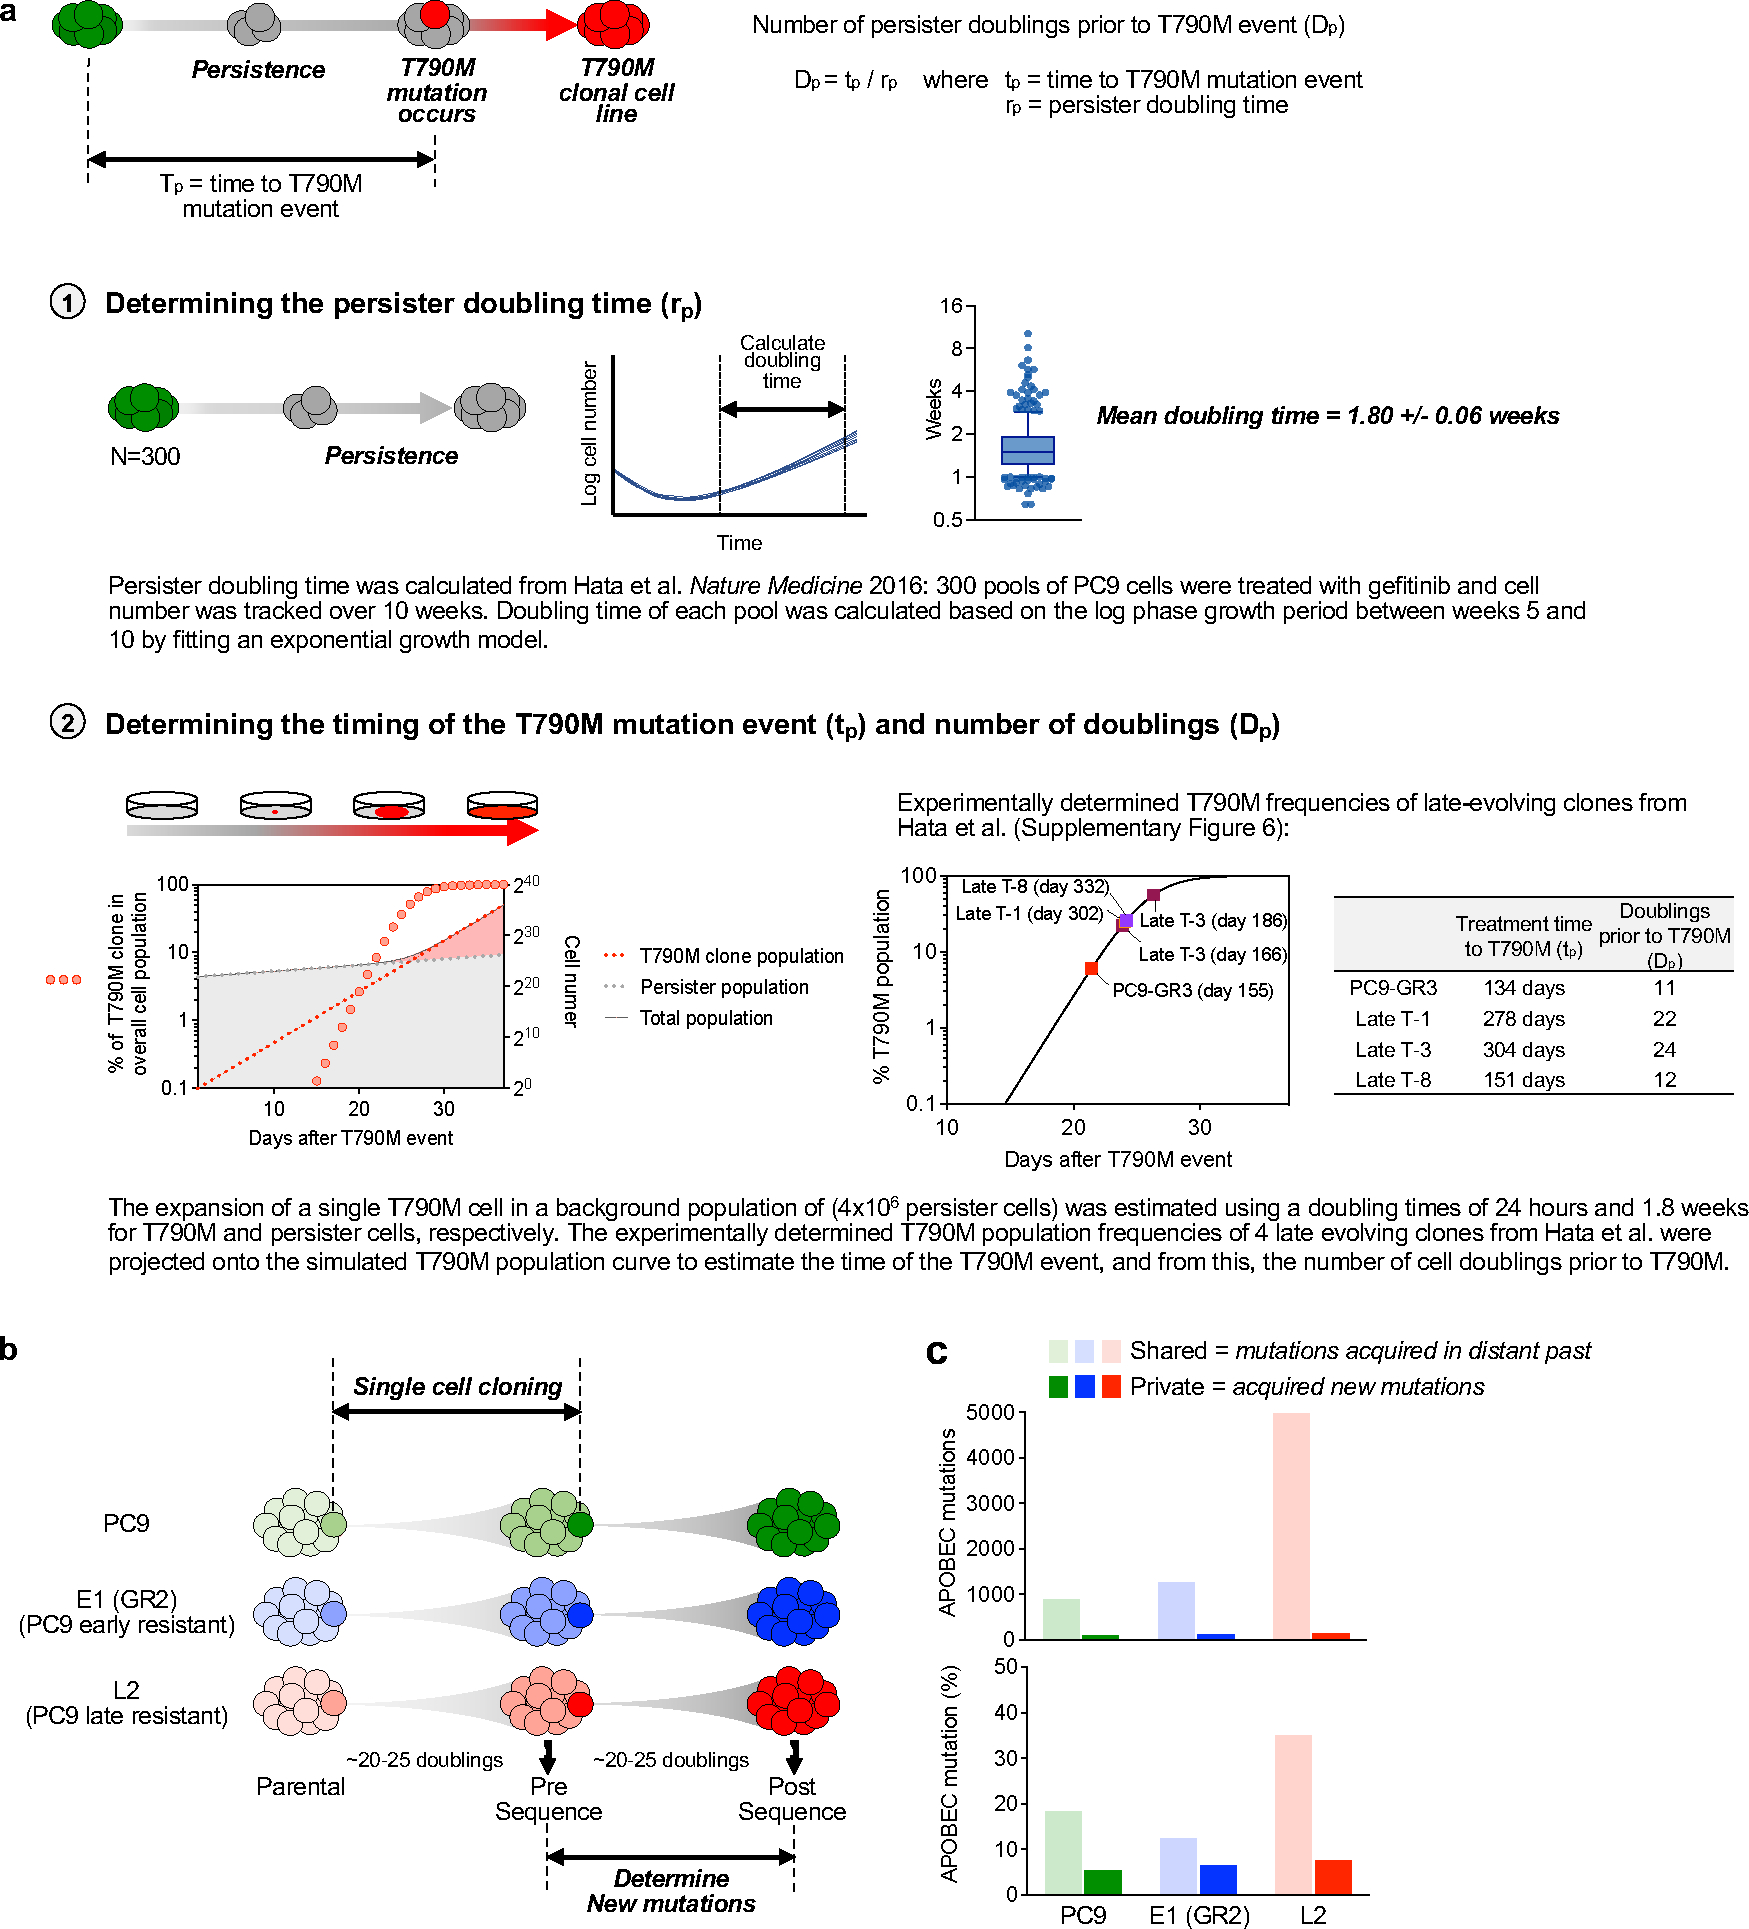
a, Determination of the number of persister doublings prior to EGFRT790M acquisition (n = 300, Tukey box and whisker plots). b, Experimental schema. Two rounds of single cell cloning were performed using PC9, E1 (GR2, early resistant, no prior APOBEC) and L2 (late resistant, prior APOBEC) cells. Single cells were expanded ~20–25 doublings to match the number of persister doublings prior to acquisition of EGFRT790M. Whole-genome sequencing was performed on expanded clones. c, APOBEC mutation percentage of shared and private mutations. Shared mutations refer to mutations shared between sequential clones from one individual cell line and represent mutations that were acquired in the distant past. Private mutations refer to mutations observed in only one sample of an individual cell line and are not shared with paired sample. The enrichment of APOBEC signature in shared L2 mutations reflects known accumulation of APOBEC mutations that were acquired during TKI treatment prior to this study. Private mutations that were newly acquired in PC9, E1 (GR2) and L2 cells correspond to those that occurred spontaneously during culture in the absence of drug.
Extended Data Fig. 6 |. Lung cancer targeted therapies induce APOBEC3A expression.
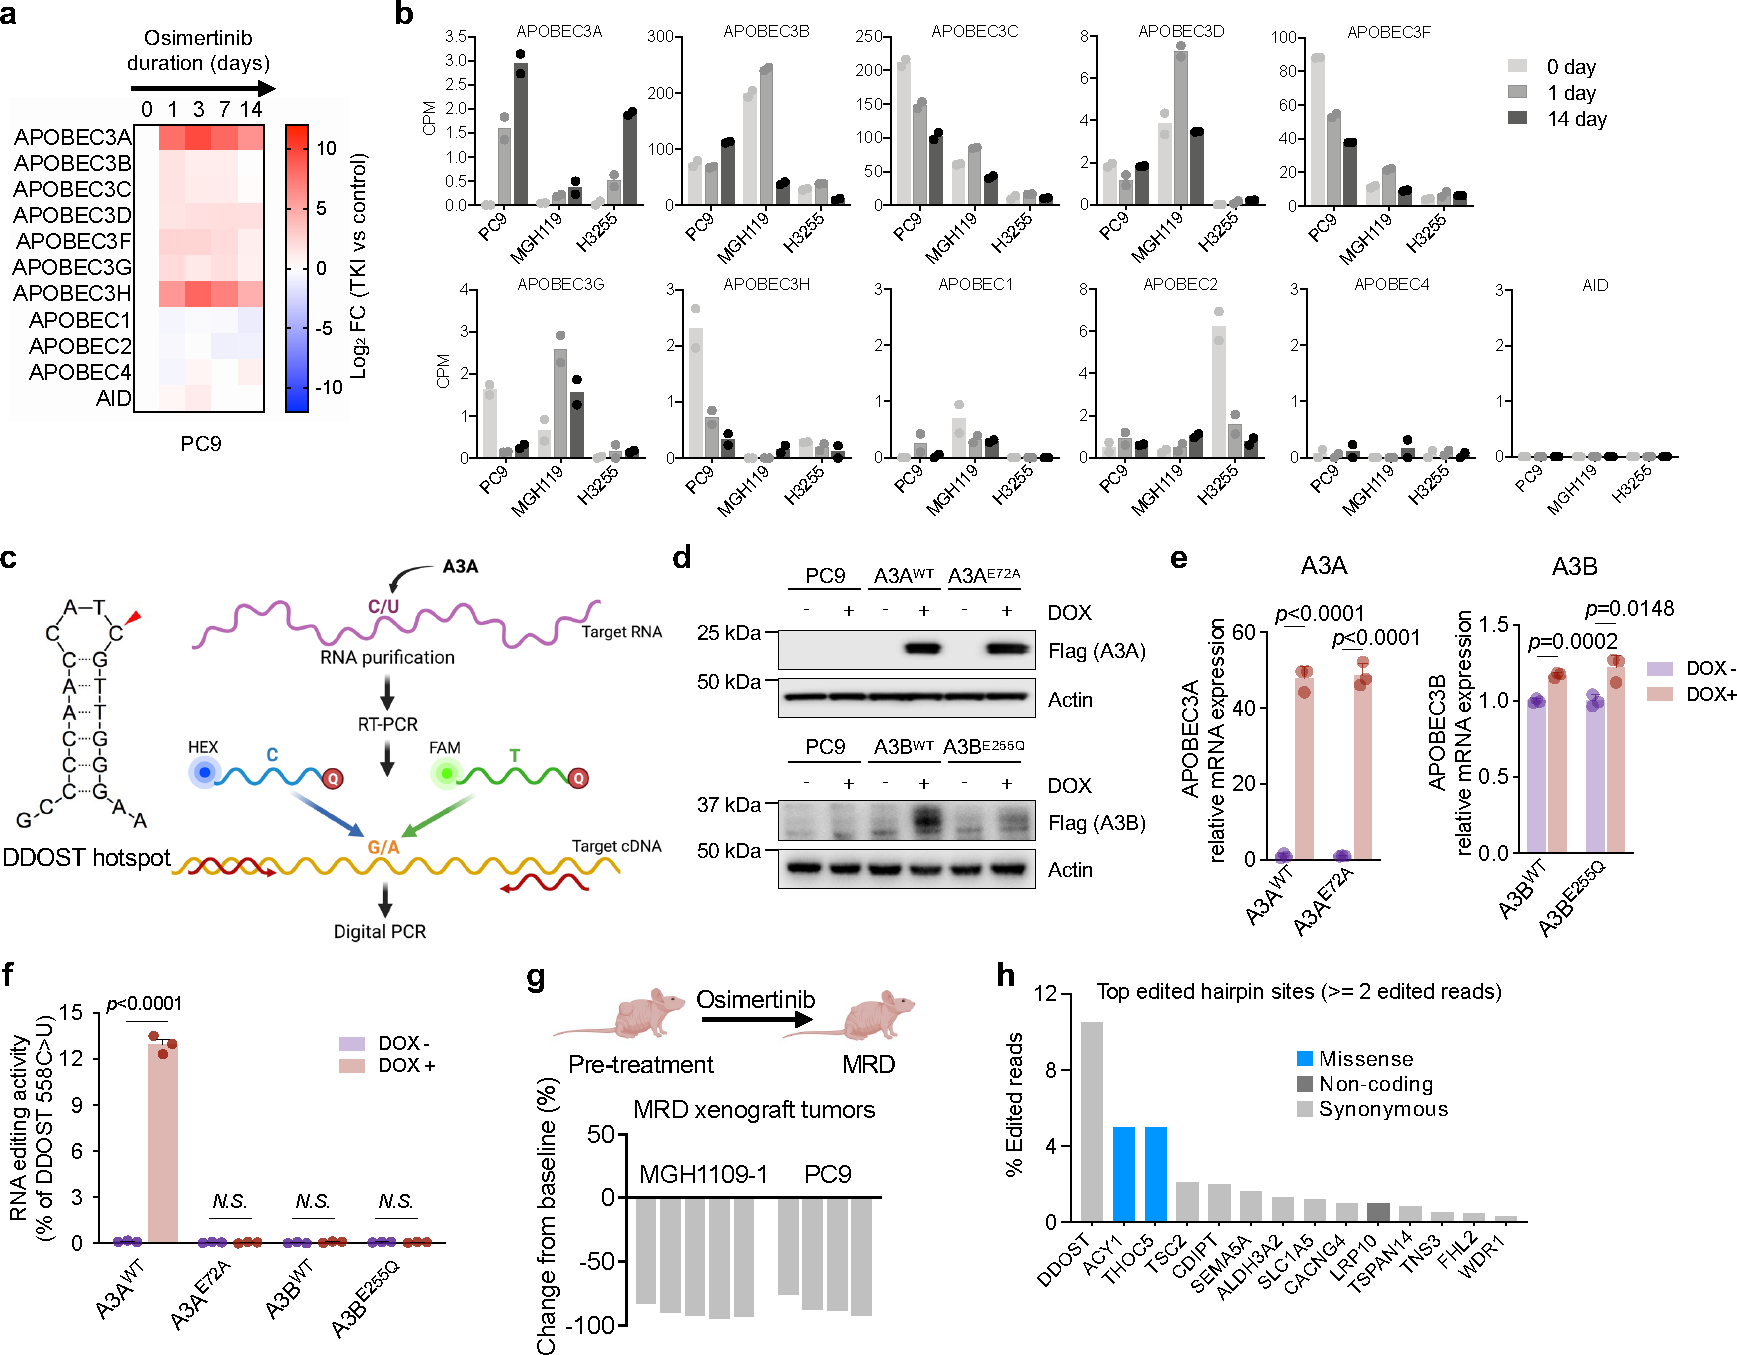
a, mRNA expression of APOBEC family genes in response to osimertinib. PC9 cells were treated with 1 μM osimertinib for up to 14 days and gene expression was determined by quantitative RT-PCR. Data are expressed as log2 fold change (FC) relative to untreated control. b, mRNA expression levels (CPM: counts per million) of APOBEC family genes determined by RNA-seq in EGFR-mutant NSCLC cell lines treated with 300 nM gefitinib for 0, 1 and 14 days. Data correspond to BioProject ID PRJNA941908. c, Schema for allele specific droplet digital PCR assay for quantifying A3A editing at the DDOST hairpin hotspot (adapted from Jalili et al.18). d, e, Expression of A3A or A3B in PC9 with Tet-On flag-tagged wild-type A3AWT/A3BWT or catalytic inactive mutant A3AE72A/A3BE255Q constructs. Cells were treated with 200 ng/mL doxycycline (DOX) treatment for 72 hours. Protein expression was confirmed by western blot (d). mRNA expression levels were determined by quantitative RT-PCR (e). Data are expressed as relative to untreated control (mean ± s.d. of 3 biological replicates, two-sided Student’s t-test). f, DDOST mRNA editing in PC9 cells overexpressing wild-type A3AWT/A3BWT and catalytic inactive A3AE72A/A3BE255Q mutants. Cells were treated with 200 ng/mL DOX treatment for 72 hours. DDOST editing was determined by ddPCR assay (mean ± s.d. of 3 biological replicates, two-sided Student’s t-test). g, Change of tumor volume in EGFR-mutant NSCLC xenograft models treated with osimertinib at the time of harvesting minimal residual disease (MRD) for DDOST hairpin hotspot analysis in Fig. 2c. h, Top edited hairpin hotspot sites (supported by at least 2 edited reads) in PC9 cells in ApoTrack mRNA-seq analysis in Fig. 2e. The majority are predicted to be synonymous mutations. None of the missense mutations have been reported to be recurrently mutated in cancer.
Extended Data Fig. 7 |. Induction of A3A is a common response of oncogene-driven lung cancer cells treated with targeted therapies.
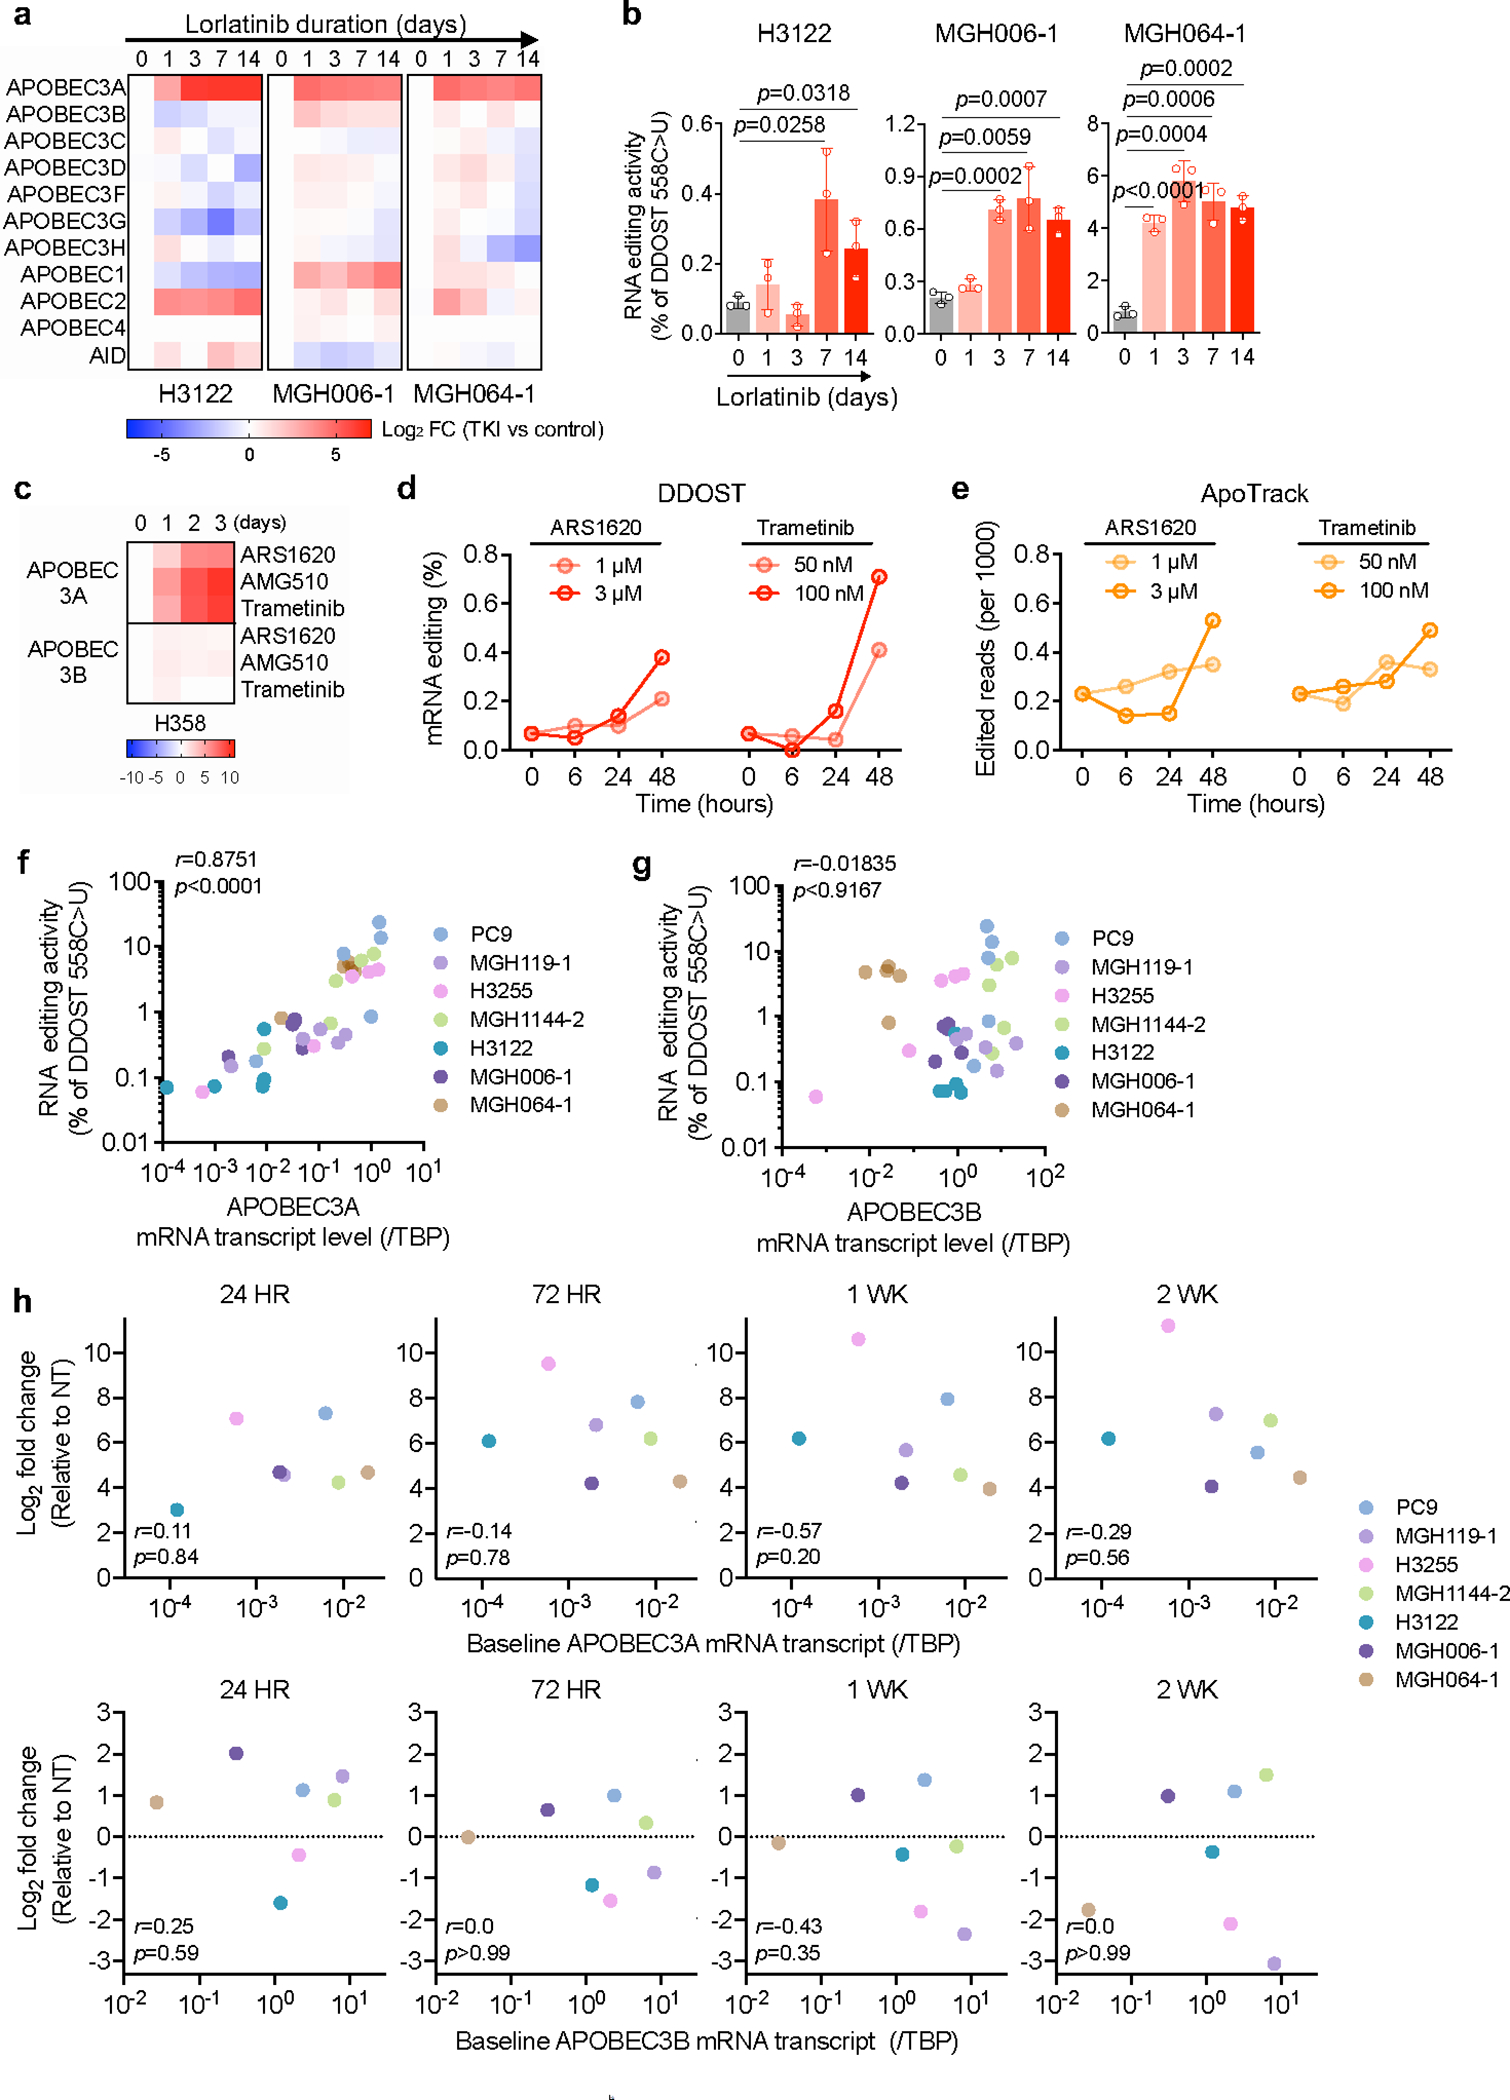
a, Expression of APOBEC family genes in ALK fusion-positive NSCLC cells after treatment with 100 nM lorlatinib as determined by quantitative RT-PCR (3 biological replicates each). b, DDOST mRNA editing in ALK fusion-positive NSCLC cell lines treated with 100 nM lorlatinib for up to 14 days. DDOST editing was determined by ddPCR (mean ± s.d. of 3 biological replicates, two-sided Student’s t-test). c, Expression of A3A and A3B in H358 KRASG12C NSCLC cells treated with 1 μM AMG 510, 1 μM ARS-1620 or 100 nM trametinib for up to 72 hours (3 biological replicates each). d-e, mRNA-seq was performed on H358 KRASG12C NSCLC cells treated with ARS-1620 or trametinib to quantify DDOST (d) and global transcriptome editing (ApoTrack) (e). f-g, Correlation between DDOST mRNA editing activity and mRNA expression of A3A (f) or A3B (g) in EGFR-mutant and ALK fusion-positive NSCLC cell lines. Data is adapted from Fig. 2a, 2b, Extended Data Fig. 7a, 7b (r = Pearson product-moment correlation coefficient). h, Correlation between log2 fold change and baseline mRNA expression of A3A or A3B. Data was adapted from Fig. 2a, 2b, Extended Data Fig. 7a, 7b (r = Pearson product-moment correlation coefficient).
Extended Data Fig. 8 |. TKI-induced APOBEC activity and evolutionary history of evolving resistant clones.
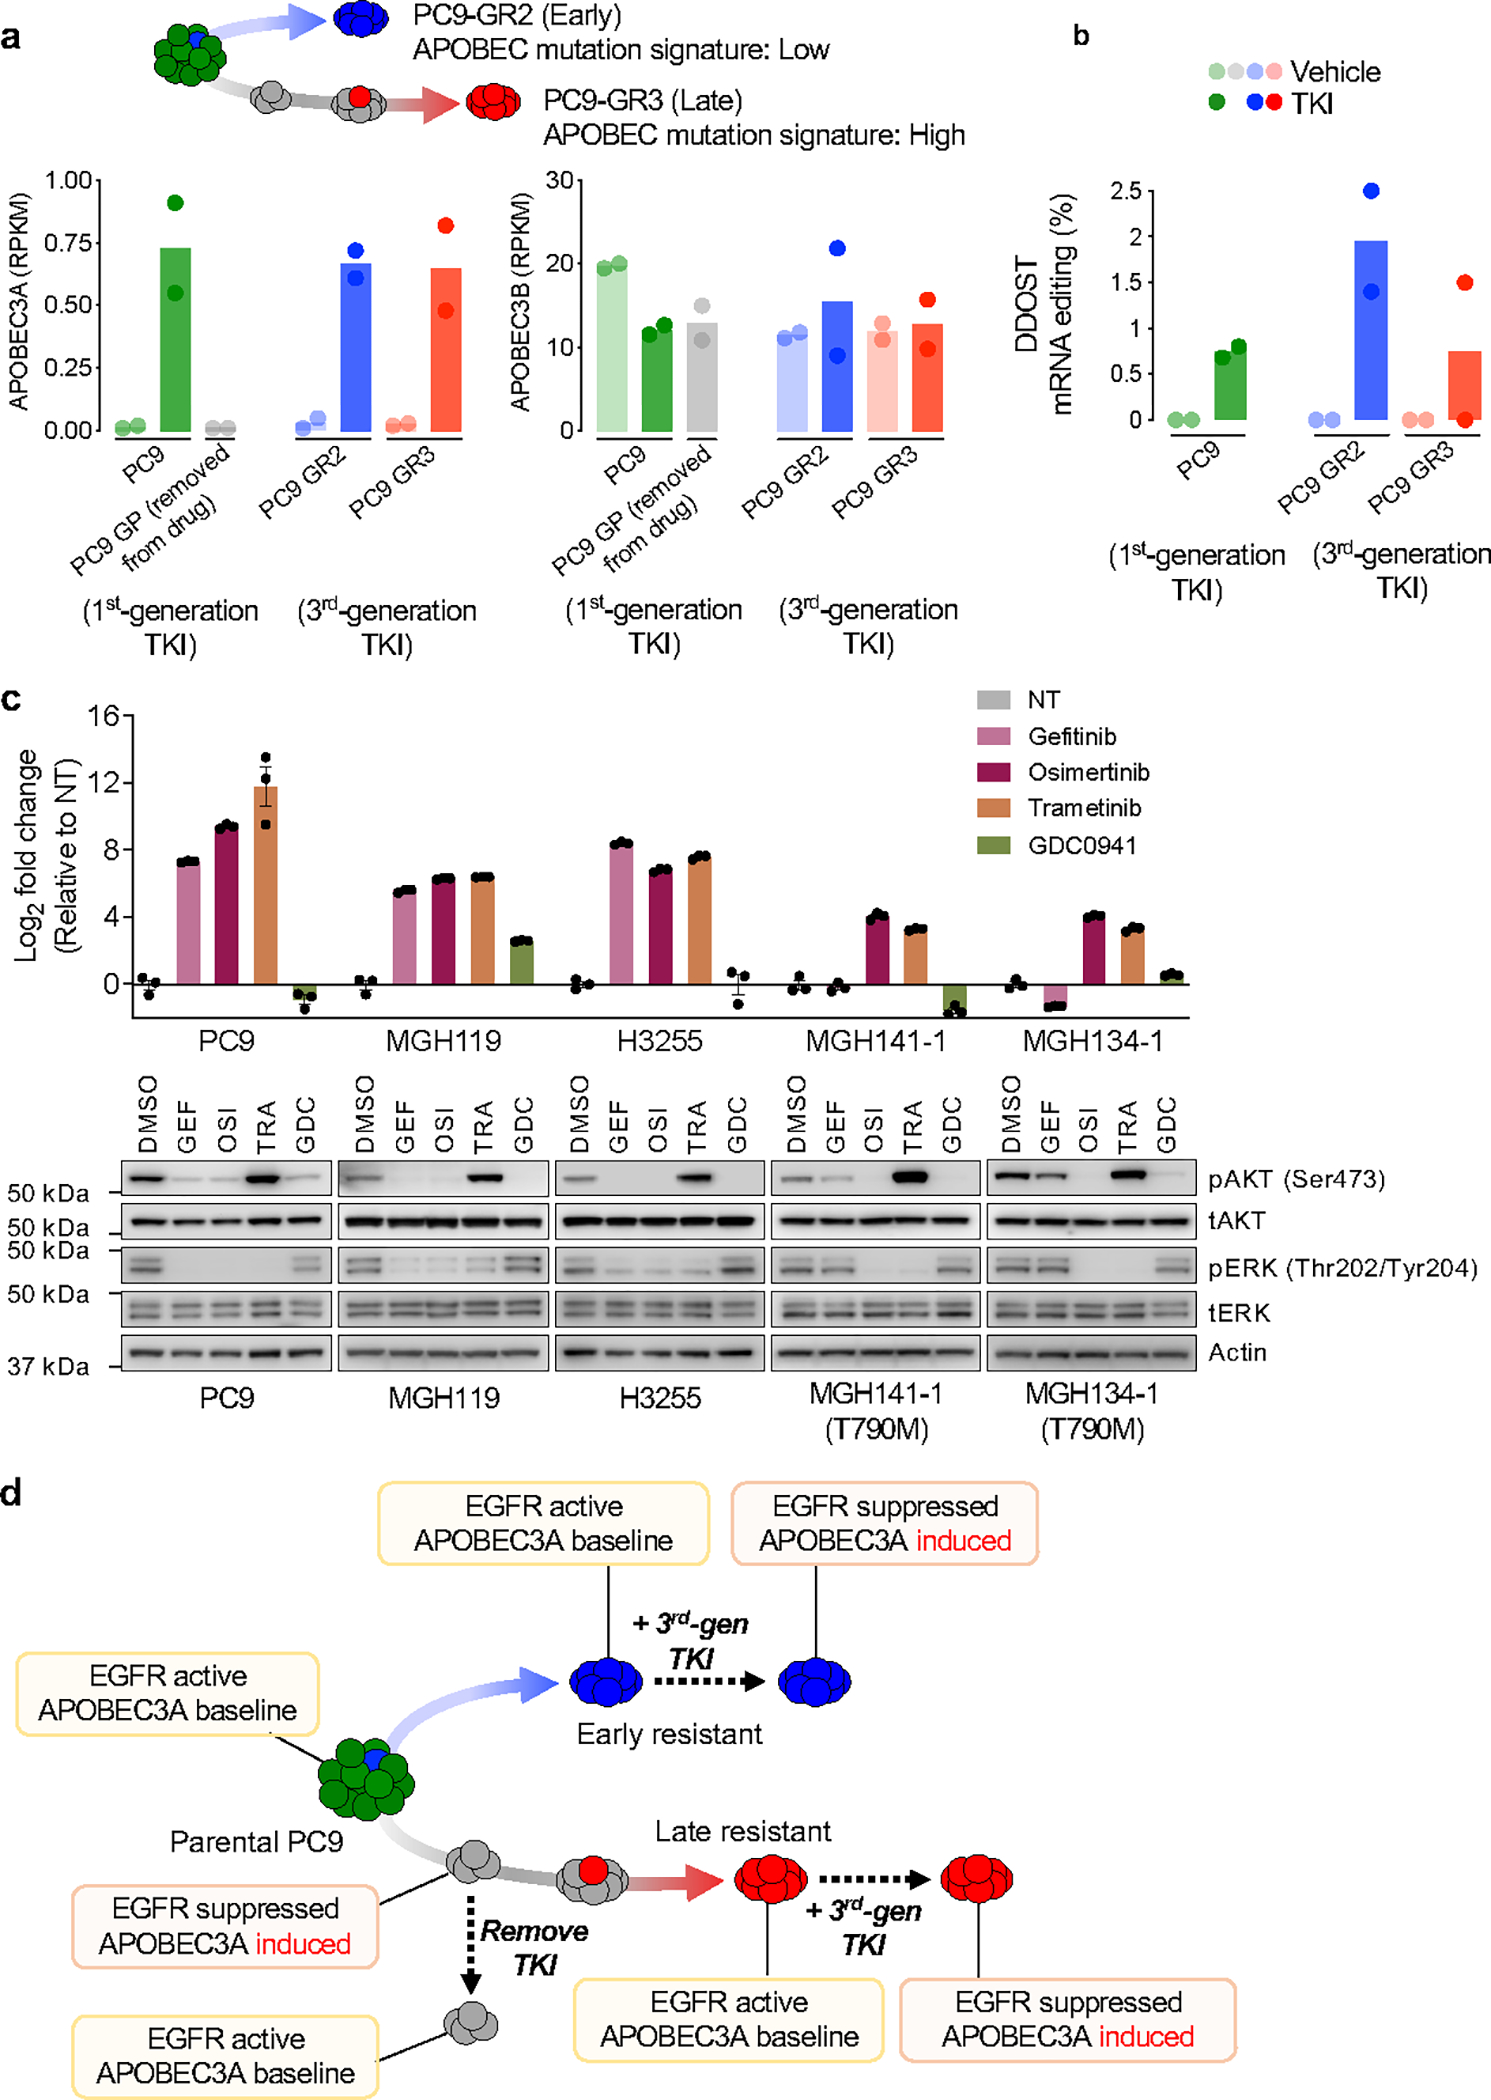
a, A3A and A3B expression levels from RNA-seq (GSE75602) performed on parental PC9 cells, PC9 DTP cells after 14 days of gefitinib treatment (GP), early EGFRT790M resistant clone PC9-GR2 and late EGFRT790M resistant clone PC9-GR3 (previously described in Hata and Niederst et al. 11). PC9 cells were treated with gefitinib, PC9-GR2/GR3 cells were treated with the third-generation EGFR inhibitor WZ4002 (all for 24 hours). b, Percentage of DDOST hotspot reads with A3A editing in PC9 and PC9-GR2/GR3 cells treated with gefitinib or WZ4002, respectively. c, A3A induction and suppression of EGFR downstream signaling. NSCLC cells were treated with or without 1 μM gefitinib, 1 μM osimertinib, 100 nM trametinib or 1 μM GDC0941 for 24 hours. Expression of A3A was determined by quantitative RT-PCR (upper panel). Data are expressed as log2 fold change relative to non-treated control (NT) (mean ± s.d. of 3 biological replicates). Western blot of AKT and ERK phosphorylation (lower panel). d, Summary of the relationship between EGFR signaling and A3A mRNA expression during targeted therapy in PC9 early and late resistant clones.
Extended Data Fig. 9 |. A3A vs A3B character of mutations in resistant tumors derived from NSCLC Patients.
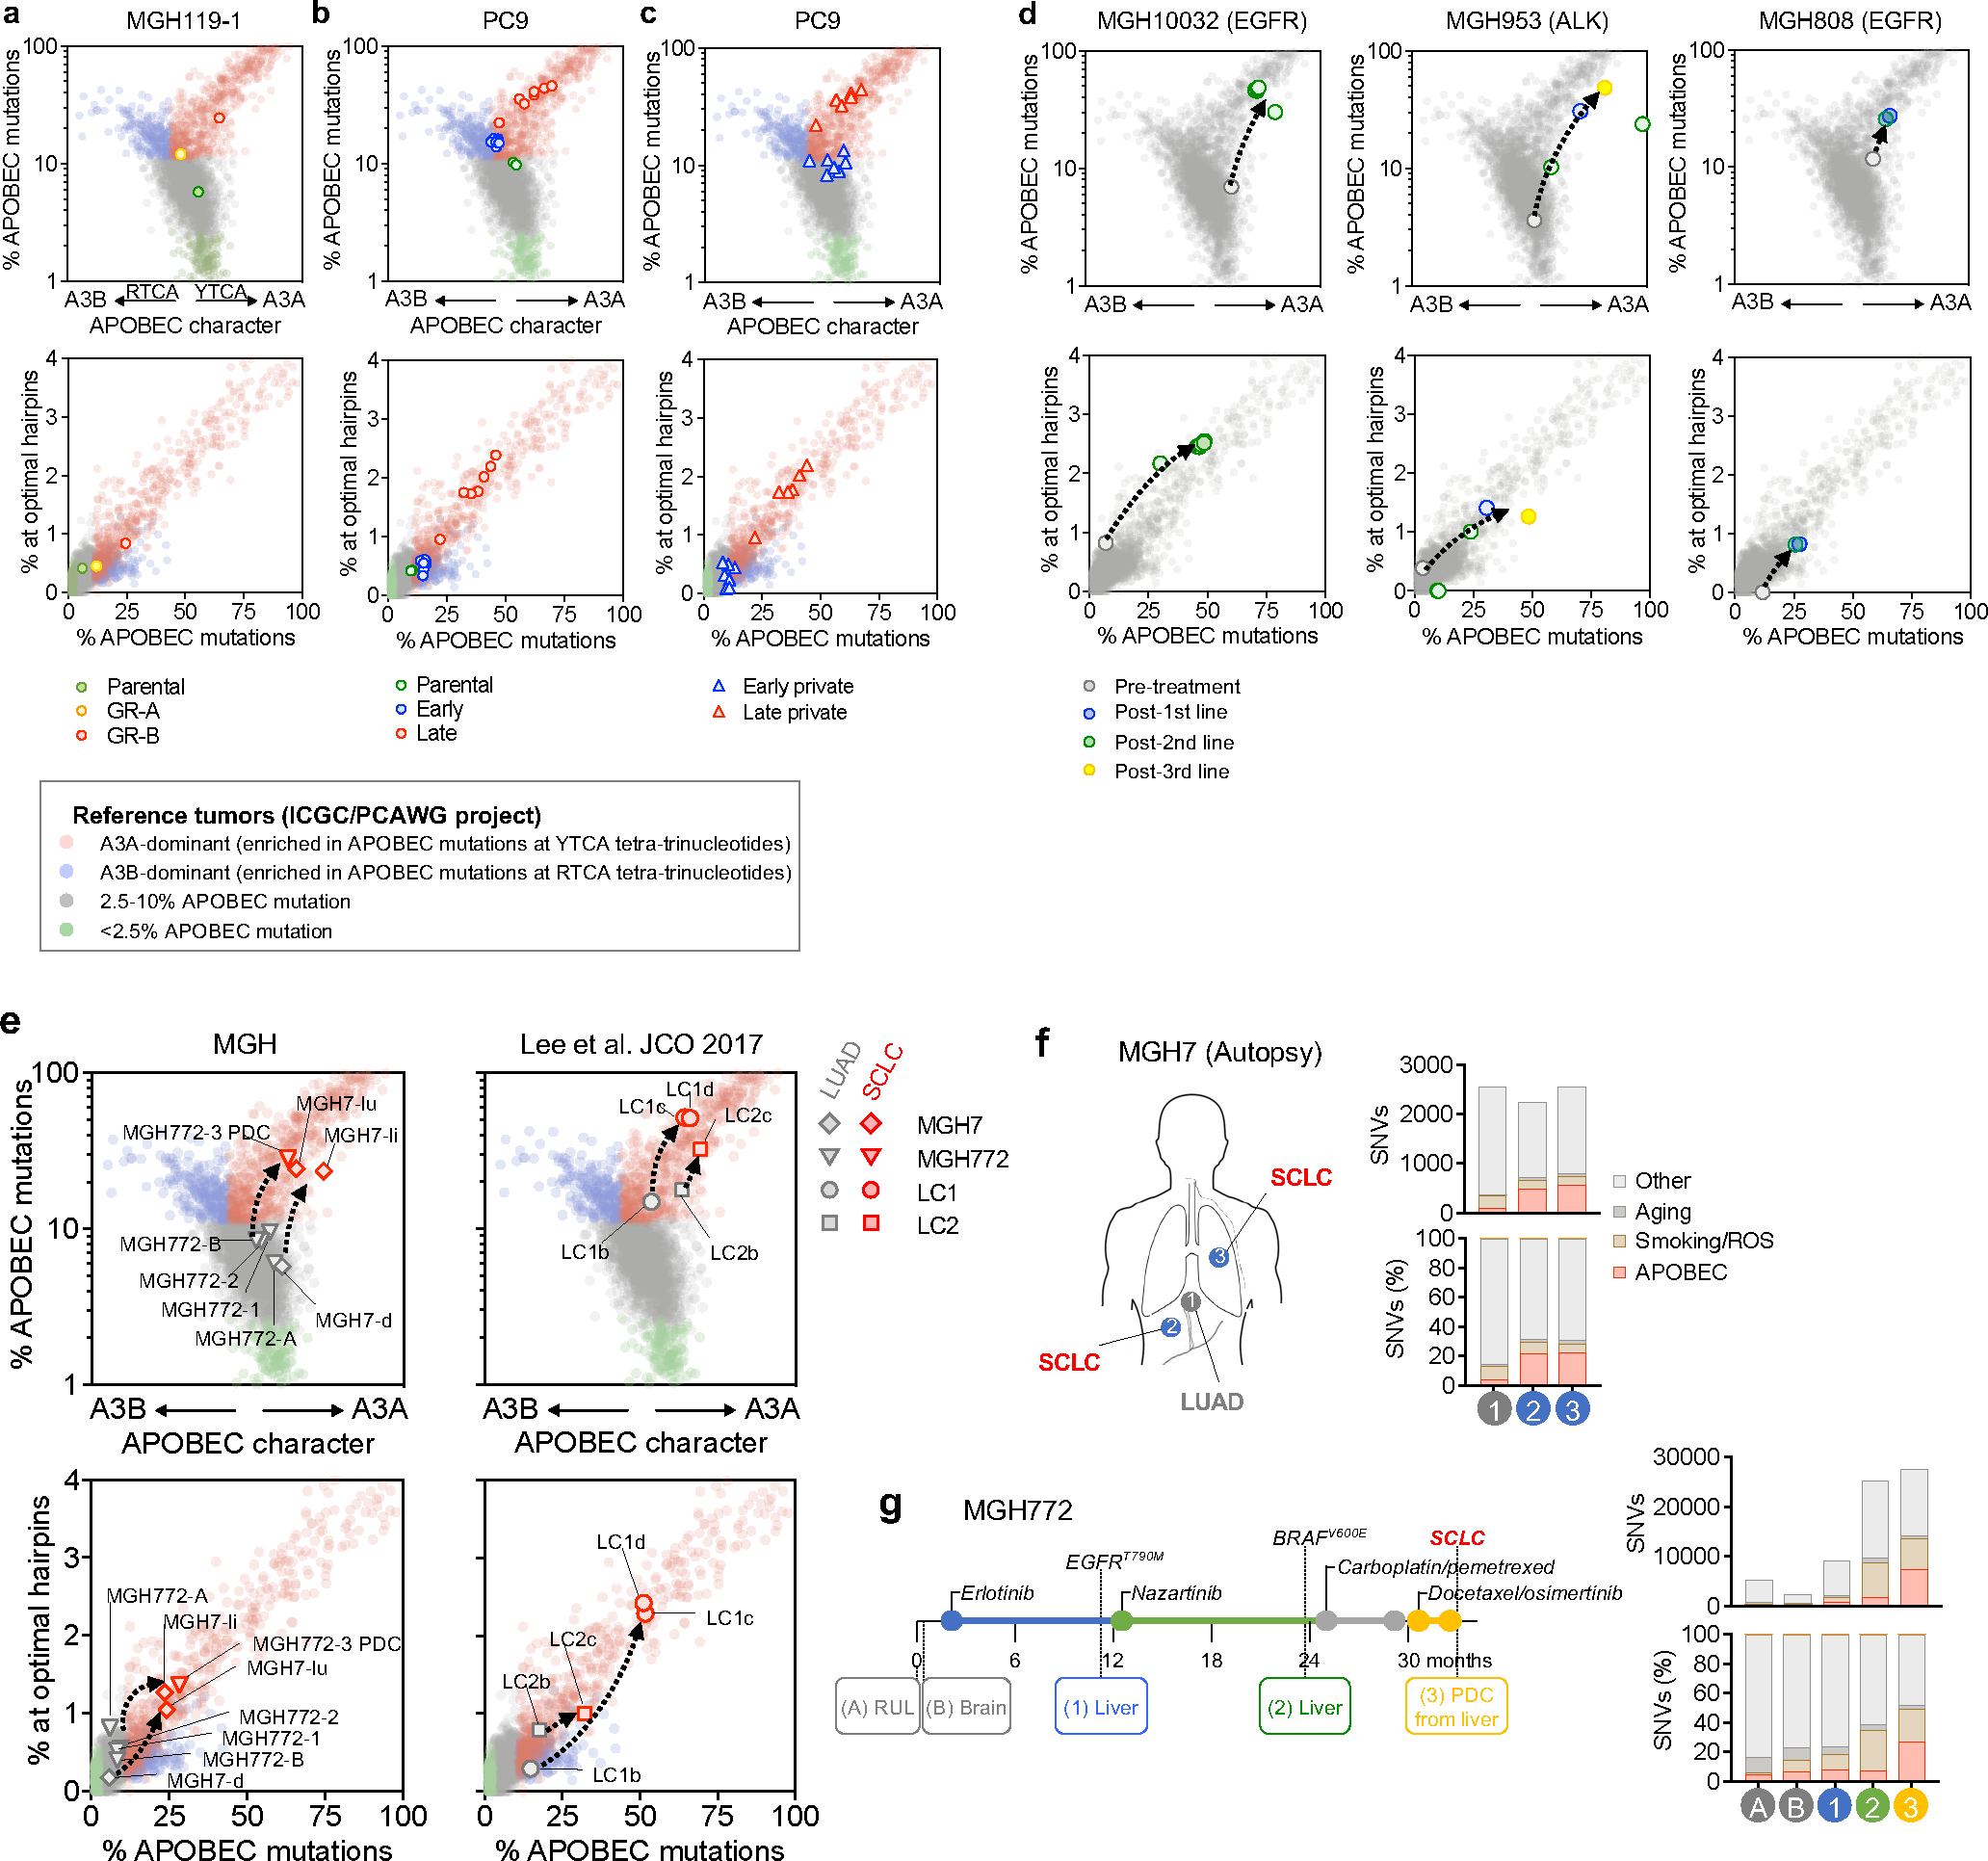
a-d, A3A (YTCA) and A3B (RTCA) character (upper panels) and A3A hairpin motif mutations (lower panels) of pre- and post-treatment MGH119–1 (a), PC9 (b, c) and patient tumors (d). A reference set of ~2600 WGS-analyzed tumors from the International Cancer Genome Consortium (ICGC) Pan-Cancer Analysis of Whole Genomes (PCAWG) project is plotted for comparison. Samples were designated APOBEC+ if ≥10% of total mutations were assigned to the APOBEC mutation signature by NMF analysis, then classified according to A3A vs. A3B character: A3A-dominated samples (enrichment of mutations at YTCA tetranucleotides) are colored red, A3B-dominated samples (enrichment of mutations at RTCA tetranucleotides) are colored blue. Samples with 2.5–10% APOBEC mutations are colored grey. APOBEC- samples (< 2.5% APOBEC mutations) are colored green. e, A3A (YTCA) and A3B (RTCA) character (upper panels) or A3A hairpin motif mutations (lower panels) of transformed small cell lung cancer (SCLC) (red symbols) and corresponding lung adenocarcinoma (LUAD) (gray symbols). Tumors from the same patient are connected by a dashed line. Right panels depict pre- and post-transformation tumors described in Lee et al. 29 (PCD, patient-derived cell line; lu, lung metastasis; li, liver metastasis; d, diaphragm metastasis) f, Metastatic sites and mutational signatures from MGH7 autopsy 31. g, Clinical history, mutational signatures of serial biopsies from patient MGH772 32 (RUL, right upper lobe, PDC, patient-derived cell line).
Extended Data Fig. 10 |. NFκB1 mediates TKI-induced A3A expression.
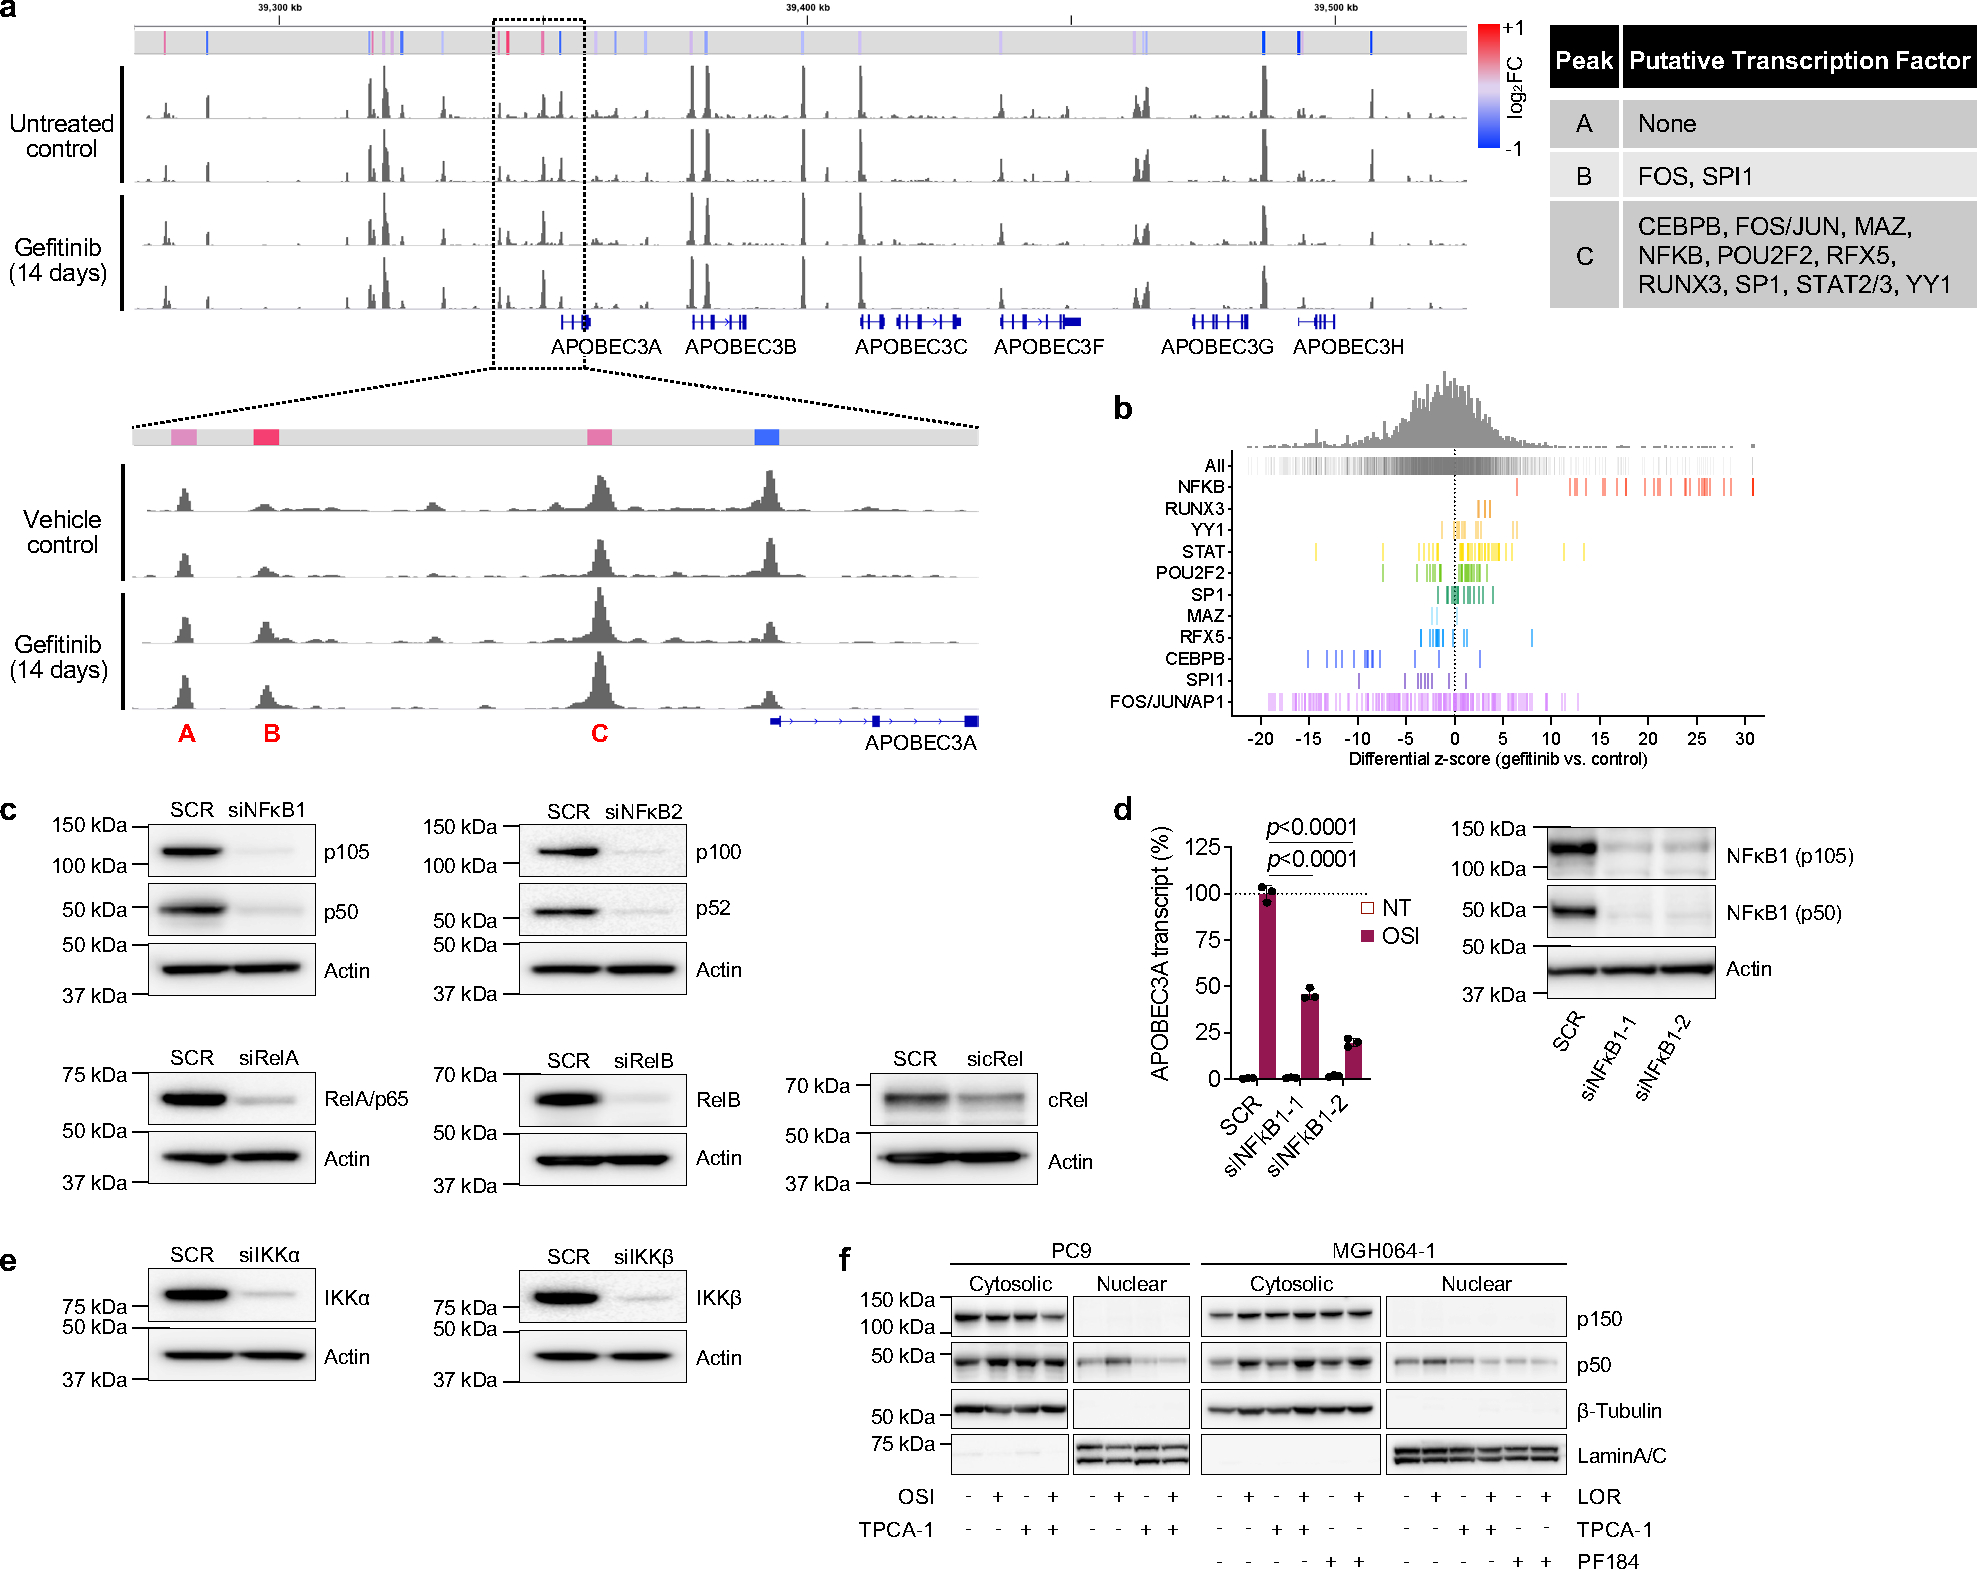
a, Chromatin accessibility profile of the APOBEC3 locus (chromosome 22) of PC9 cells treated with 300 nM gefitinib for 0 or 14 days (2 biological replicates), with expanded view of the A3A promoter region. Relative fold-change of peak accessibility in treated vs. non-treated control cells is shown. Transcription factors mapping to these peak regions were identified from the ENCODE database. b, Differential z-score (gefitinib vs. control) of global motif accessibility scores for each identified transcription factor family. c, Knockdown efficacy of each SMARTPool siRNA in PC9 cells. (SCR = scrambled control siRNA) d, Expression of A3A in PC9 cells transfected scrambled or individual NFκB1 siRNAs. Cells were treated with osimertinib for 24 hours and mRNA expression was determined by quantitative RT-PCR (mean ± s.d. of 3 biological replicates, two-sided Student’s t-test). Knockdown efficacy was confirmed by western blot. e, Knockdown efficacy of each SMARTPool siRNA in PC9 cells. f, Western blot of PC9 and MGH064–1 cells after treatment with TKI (osimertinib or lorlatinib) and IKKβ inhibitors (representative of 3 biological replicates).
Extended Data Fig. 11 |. TKI-induced APOBEC3A increases DNA damage and emergence of drug-tolerant cells.
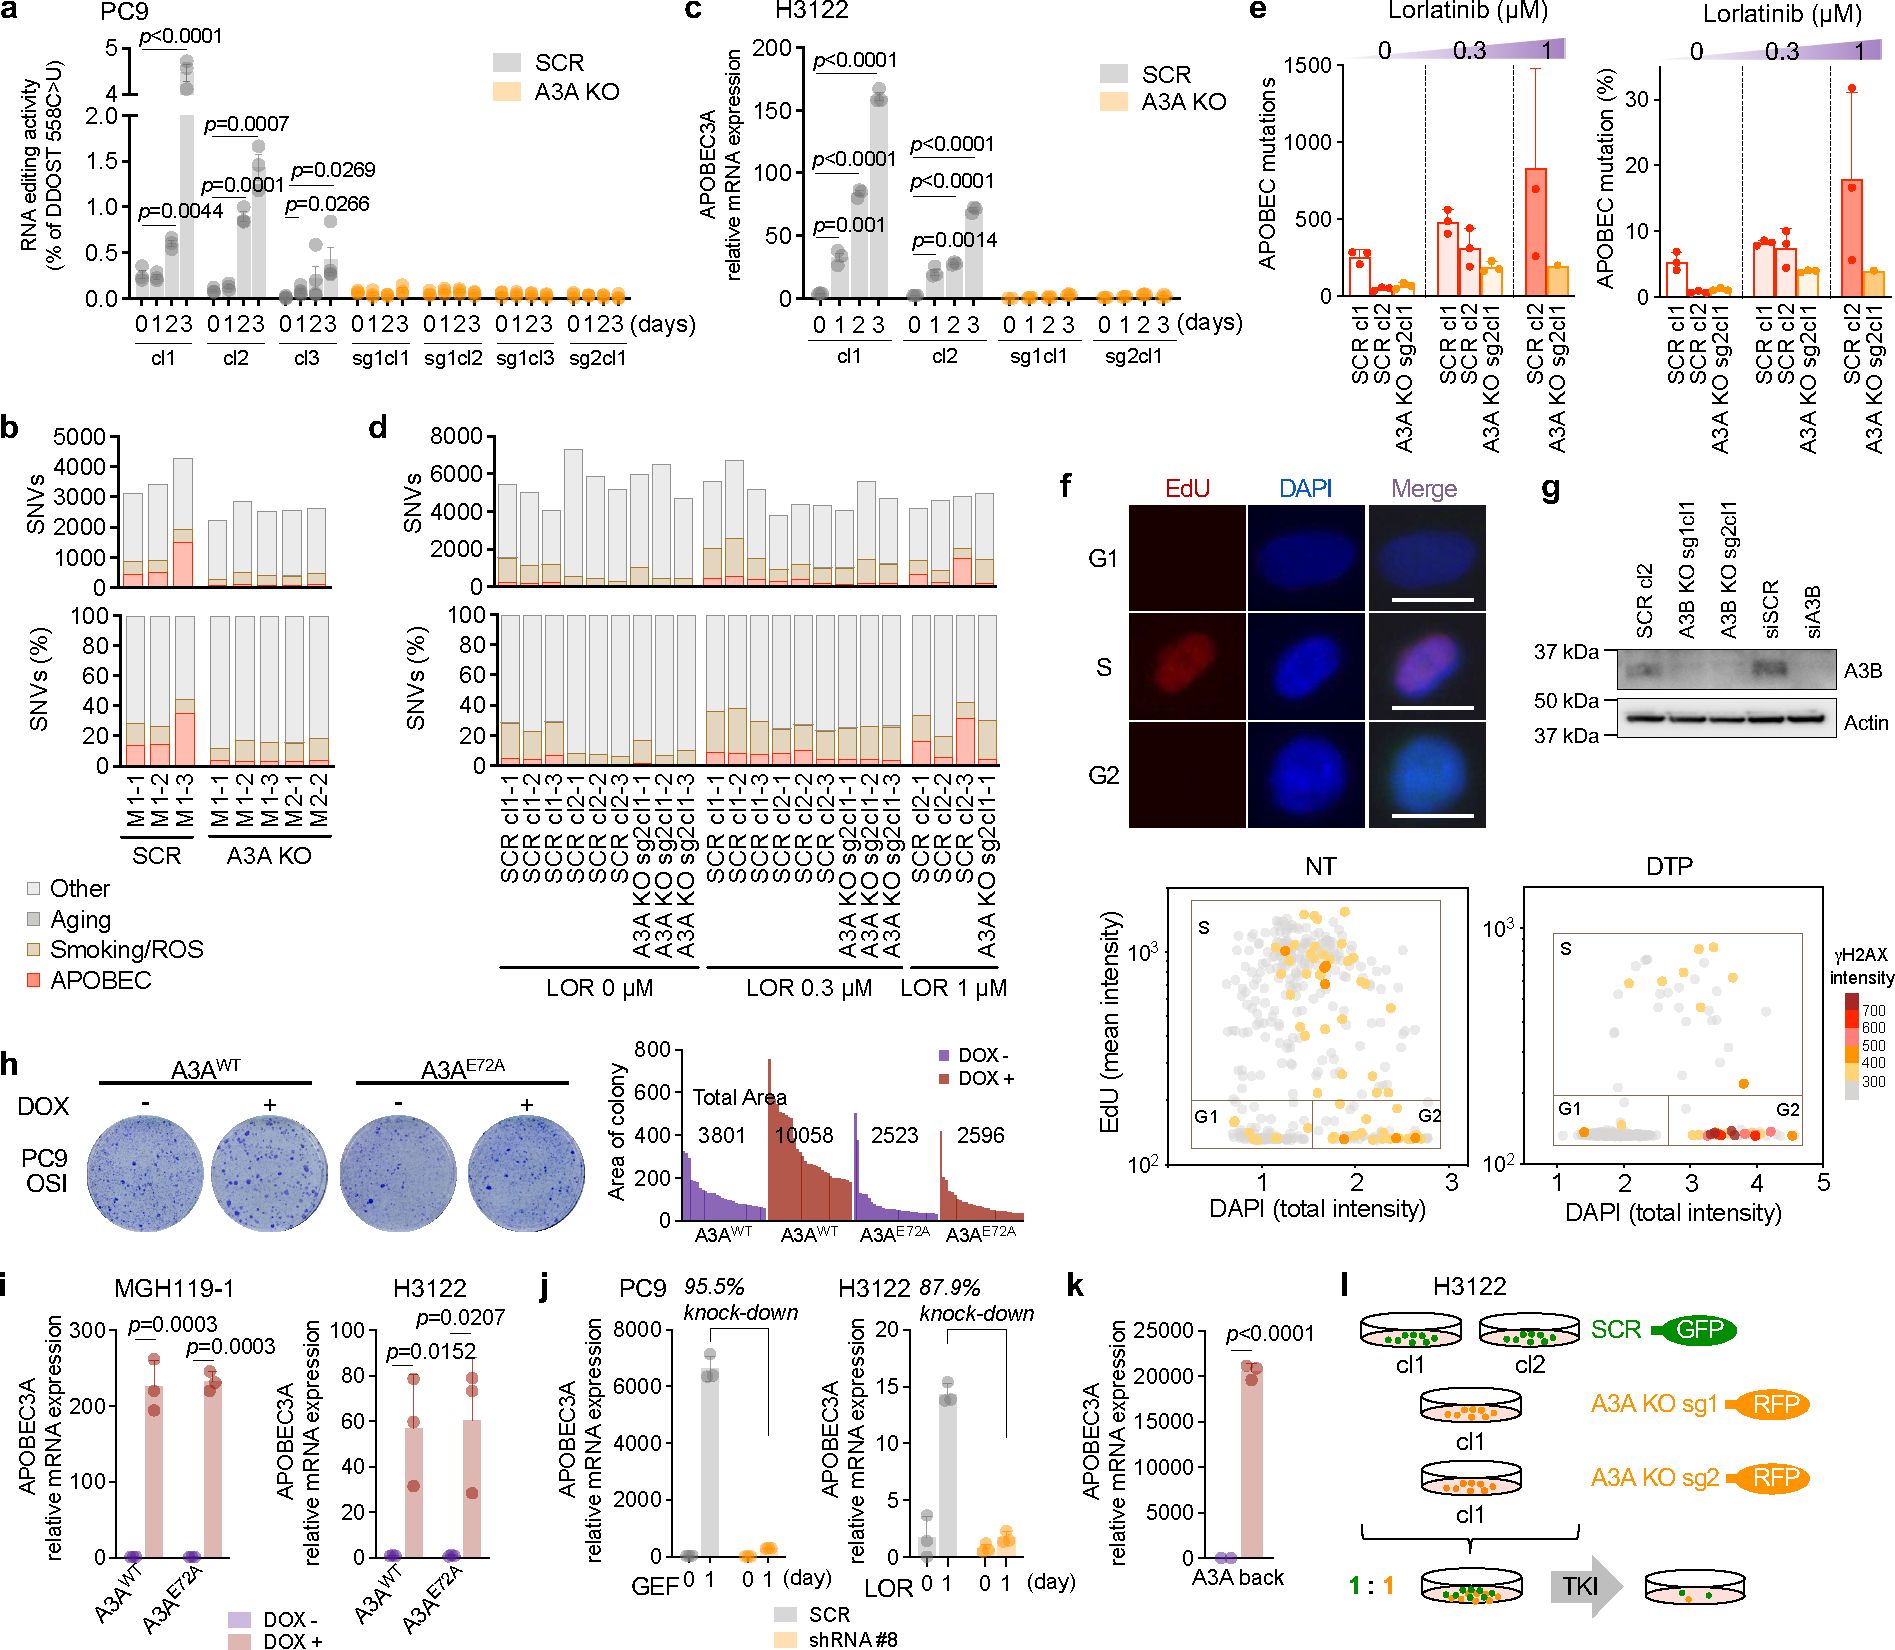
a, TKI-induced DDOST RNA editing in PC9 CRISPR scrambled (SCR) or A3A knockout (KO) clones (cl, clone; sg, sgRNA). Cells were treated with or without 1 μM osimertinib for up to 3 days and DDOST editing was determined by digital PCR (SCR cl3, n = 4; others, n = 3 biological replicates, mean ± s.d., two-sided Student’s t-test). b, Acquired SNVs stratified by mutation signature, and shown as count (upper) or percentage (lower) in resistant clones derived from MRD mice tumors (M = MRD mouse; −1, −2, −3 = single cell clone 1, 2, 3). Each MRD clone was compared to its matched pre-treatment clone to identify acquired mutations. c, Expression of A3A in H3122 CRISPR SCR or A3A KO cells treated with 1 μM lorlatinib for up to 3 days. mRNA expression was determined by quantitative RT-PCR (mean ± s.d. of 3 biological replicates, two-sided Student’s t-test). d, Acquired SNVs stratified by mutation signature, and shown as count (upper) or percentage (lower) in clones derived from H3122 DTP cells. H3122 CRISPR SCR or A3A KO cells were treated with 0, 0.3, 1 μM lorlatinib for 8 weeks and single cell clones were expanded for WGS (−1, −2, −3 = single cell clone 1, 2, 3). Each DTP clone was compared to its matched pre-treatment clone to identify acquired mutations. Of note, only a single H3122 A3A KO clone could be recovered after lorlatinib treatment due to the increase in drug sensitivity associated with knockout of A3A. e, Acquired APOBEC mutation number (left) or percentage (right) in DTP clones. Each resistant clone was compared to its matched pre-treatment clone to identify acquired mutations (A3A KO sg2cl1, n = 1; others n = 3, mean ± s.d.). f, Representative images of cells in G1, S and G2 phase; scale bars = 10 μm (upper). Scatter plots of EdU cell cycle assay in Fig. 3i (lower). PC9 cells were treated with 1 μM osimertinib for 14 days and stained with EdU/DAPI to resolve cell cycle phase, and γH2AX to quantify DNA damage. g, Western blot for APOBEC3B (A3B) expression in PC9 CRISPR A3B KO or siRNA A3B. h, Survival of PC9 Tet-On overexpressing A3A. Cells were treated with 1 μM osimertinib for 4 weeks and DTP colonies were visualized by crystal violet. Colony area was quantified by imageJ. The individual and aggregate area of the largest 30 colonies for each experimental condition is shown. i, MGH119–1 A3AWT or A3AE72A cells were treated with 200 ng/mL DOX for 72 hours to induce A3A expression. mRNA expression was determined by quantitative RT-PCR (mean ± s.d. of 3 biological replicates, two-sided Student’s t-test). j, Knockdown efficacy of PC9 (left) or H3122 (right) transduced with A3A shRNA. Cells were treated with 1 μM gefitinib or 1 μM lorlatinib. mRNA expression was determined by quantitative RT-PCR (mean ± s.d. of 3 biological replicates, two-sided Student’s t-test). k, Re-expression of A3A in PC9 CRISPR A3A KO cells (“A3A back”). Cells were treated with 200 ng/mL DOX for 72 hours to induce A3A expression, which was verified by quantitative RT-PCR (mean ± s.d. of 3 biological replicates, two-sided Student’s t-test). l, Schema of competition assay using fluorescently labeled A3A KO/SCR cells. H3122 CRISPR SCR (GFP labeled) and A3A KO (RFP labeled) cells were mixed in a 1:1 ratio and treated with 1 μM lorlatinib for 4 weeks.
Extended Data Fig. 12 |. APOBEC mutations are enriched in NSCLCs with acquired TKI resistance.
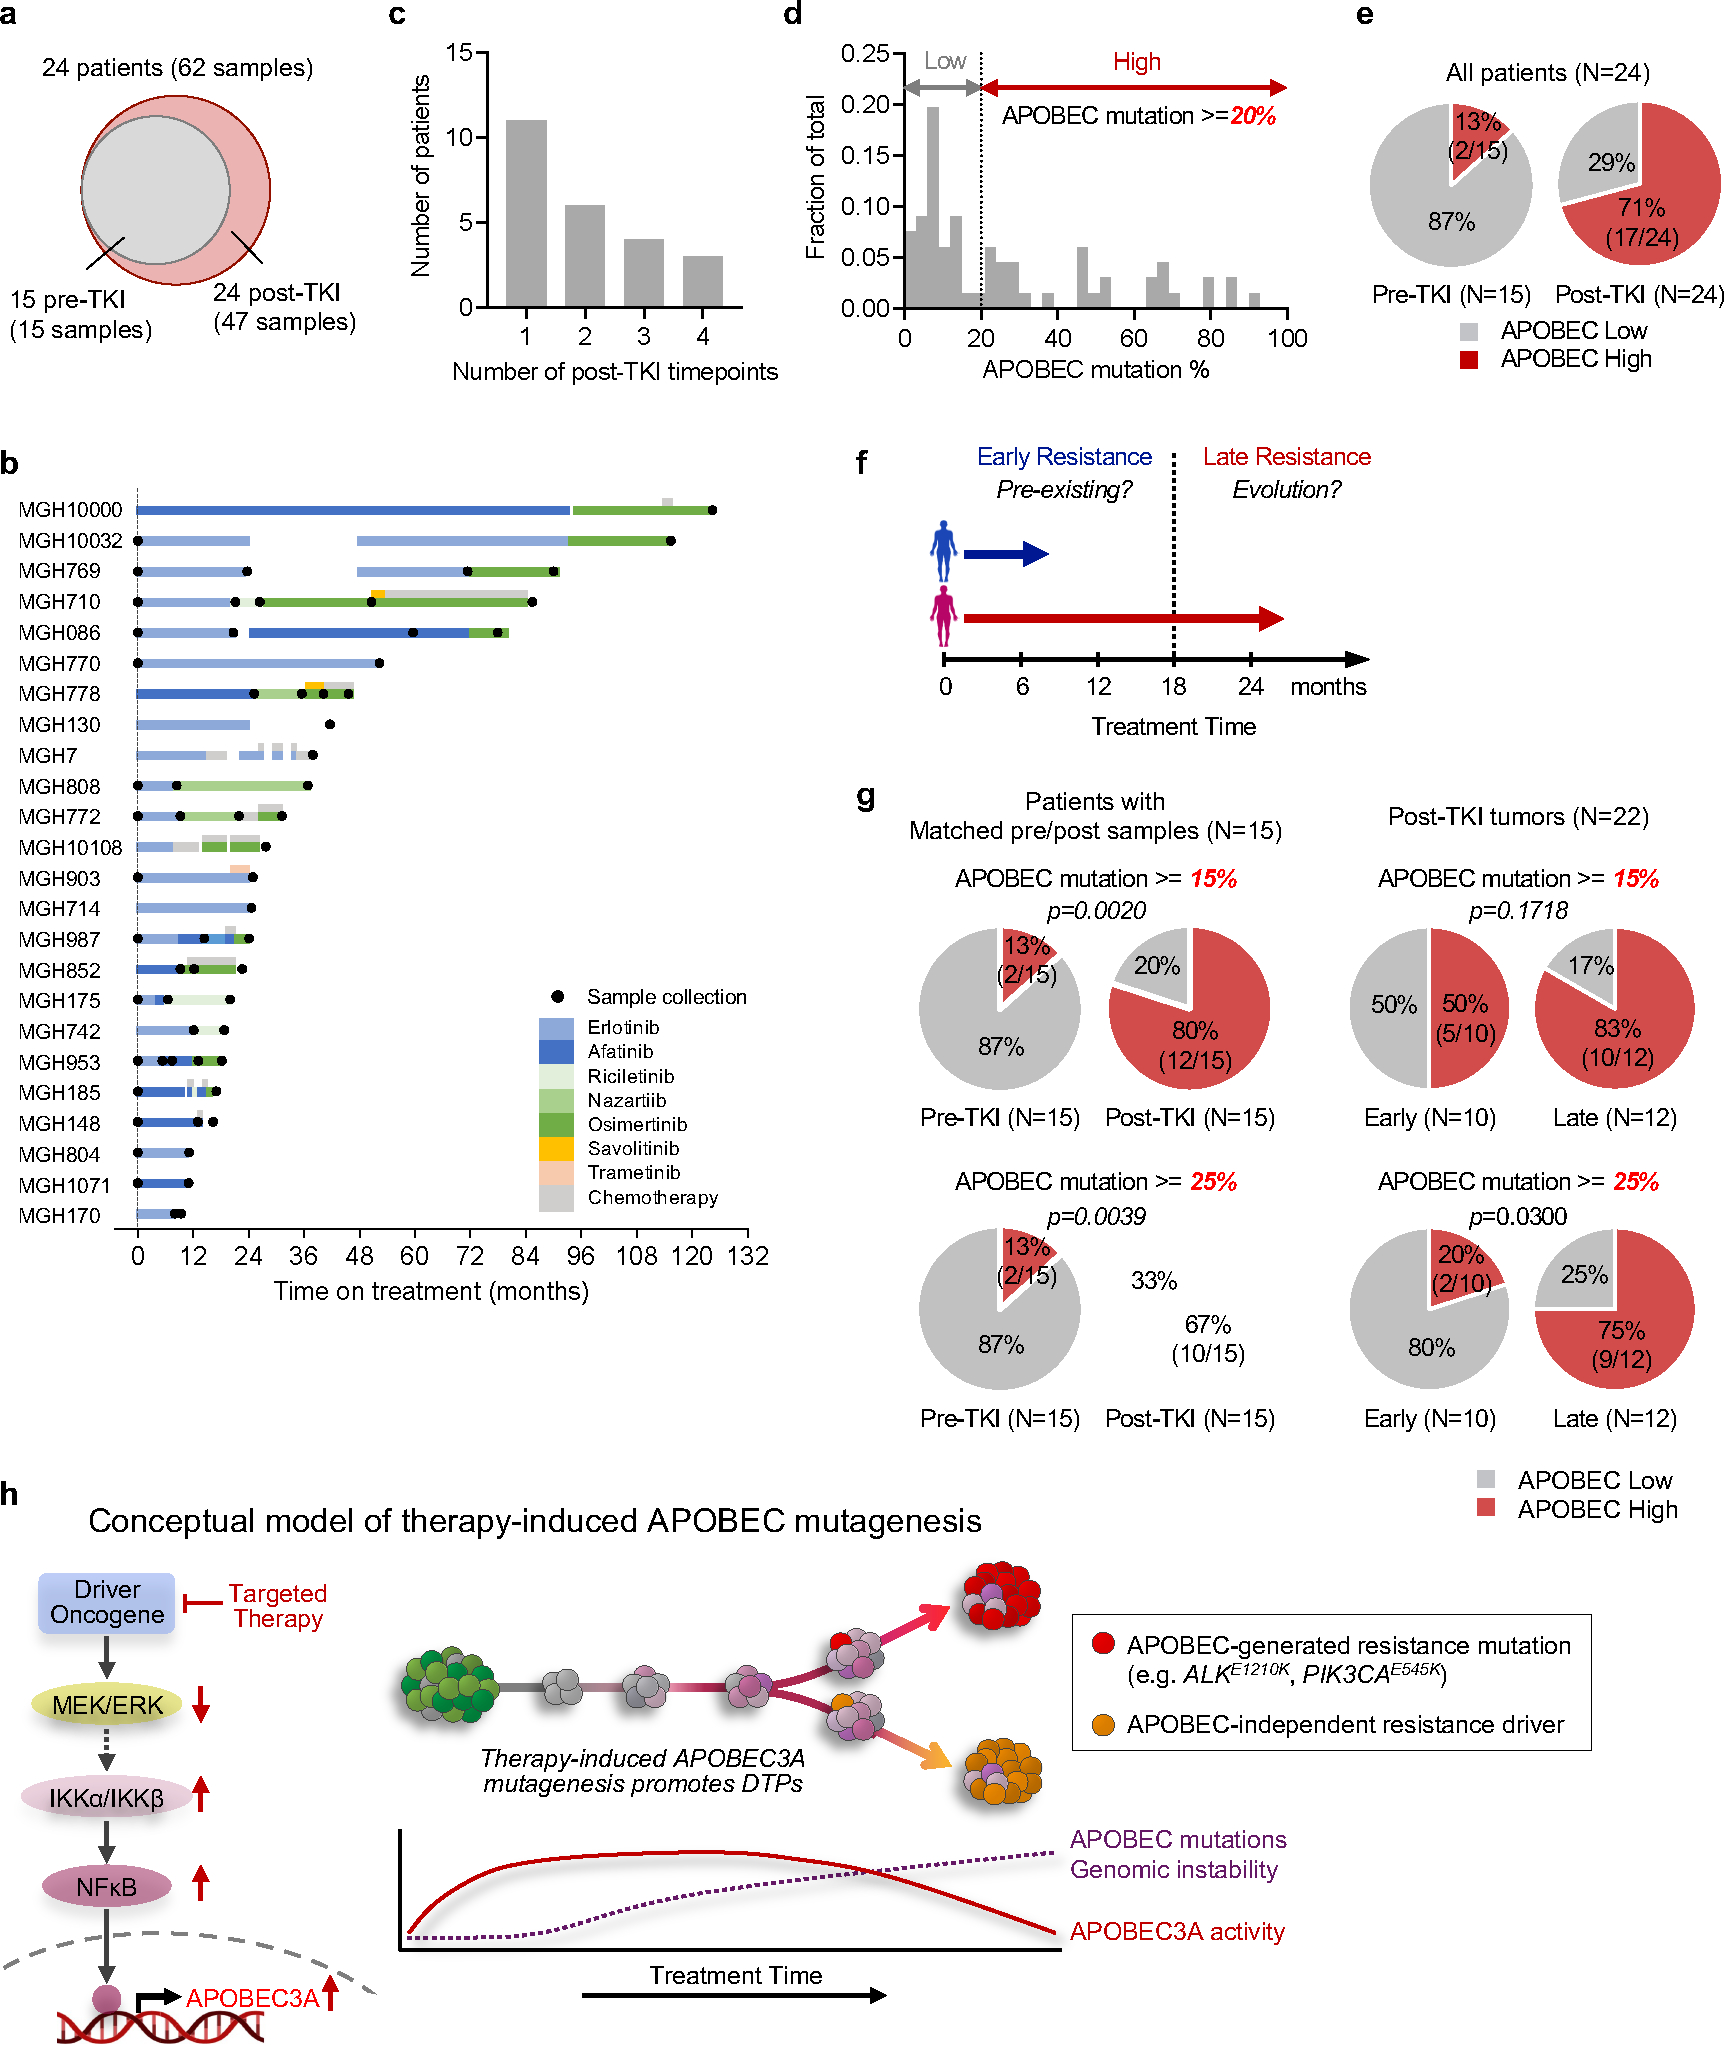
a, Distribution of tumor samples by TKI treatment timepoint. b, Treatment history and sample collection time of 24 NSCLC patients. Time on treatment was counted from the starting date of 1st-line TKI treatment. The following patients received chemotherapy treatment before 1st-line TKI treatment: MGH10032, MGH086, MGH778, MGH130, MGH903, MGH742 and MGH804. MGH patient codes and order correspond to Fig. 5a. The treatment timeline is colored according to specific therapy received. c, Number of post-TKI timepoints per patient. d, Distribution of APOBEC mutation percentages in all samples. APOBEC mutation >= 20% was defined as APOBEC “high” and less than 20% was “low”. e, Frequency of APOBEC-high tumors in all patients (n = 24). f, Schema of early versus late acquired resistance. Tumor samples were divided into two groups based on duration of TKI treatment: less (early) or greater (late) than 18 months. g, Frequency of patients APOBEC-high tumors using different thresholds for defining high versus low (APOBEC mutation >= 15% or 25%). Two-sided McNemar’s test was used to compare the two groups (e, g). h, Conceptual diagram for evolutionary trajectory and APOBEC mutational burden of evolving persistent cancer cells during targeted therapy. i, Examples of acquired (validated) driver mutations in the APOBEC context.
Supplementary Material
Acknowledgements
We thank all members of the Hata and Benes Lab for helpful discussions and feedback. This study was funded by support from the NIH K08 CA197389 (A.N.H), R01 CA249291 (A.N.H), R37 CA252081 (R.B.), R01 CA137008 (L.V.S., A.N.H.), R01 CA164273 (J.J.L., A.N.H.), U01CA220323 (N.J.D.), Doris Duke Charitable Foundation Clinical Scientist Development Award (A.N.H), Smith Family Foundation Award (A.N.H), Rullo Family Innovation Award (M.S.L.), SU2C/NSF/V Foundation Convergence Award (A.N.H, L.V.S and C.S.C.), the Ludwig Center at Harvard (A.N.H.), Tosteson & FMD Award (H.I.), Lung Cancer Research Foundation (H.I.), the Lungstrong foundation, Targeting a Cure for Lung Cancer, Be a Piece of the Solution, the Landry Family and the Suzanne E. Coyne Family.
Footnotes
Competing financial interests
The authors declare competing financial interests:
A.N.H. has received grants/research support from Amgen, Blueprint Medicines, BridgeBio, Bristol-Myers Squibb, C4 Therapeutics, Eli Lilly, Novartis, Nuvalent, Pfizer, Roche/Genentech, and Scorpion Therapeutics; has served as a compensated consultant for Engine Biosciences, Nuvalent, Oncovalent, TigaTx and Tolremo Therapeutics. C.J.O. has received research support from Gilead, Scorpion Therapeutics, and eFFECTOR Therapeutics. G.G. as received research funds from IBM and Pharmacyclics; is an inventor on patent applications related to MSMuTect, MSMutSig, MSIDetect, POLYSOLVER, SignatureAnalyzer-GPU and MinimuMM-seq; is a founder, consultant and holds privately held equity in Scorpion Therapeutics. J.F.G has served as a compensated consultant and/or had advisory roles for Amgen, Blueprint Medicines Corporation, BMS, Genentech/Roche, Gilead Sciences, Jounce Therapeutics, Lilly, Loxo Oncology, Merck, Mirati, Silverback Therapeutics, Sanofi, GlydeBio, Moderna Therapeutics, Oncorus, Regeneron, Takeda, Merus, Novocure, Curie Therapeutics, AI Proteins, AstraZeneca, Jazz Pharmaceuticals, InterVenn, and Pfizer; has stock and ownership in Ironwood Pharmaceuticals (immediate family member) and AI Proteins; and has received Honoraria from Merck, Novartis, Pfizer, and Takeda; has received research funding from Adaptimmune, ALX Oncology, Array BioPharma, AstraZeneca, Blueprint Medicines Corporation, BMS, Genentech, Jounce Therapeutics, Merck, Novartis, and Tesaro; has an immediate family member who is an employee of Ironwood Pharmaceuticals. J.J.L. has served as a compensated consultant or received honorarium from Chugai Pharma, Boehringer-Ingelheim, Pfizer, C4 Therapeutics, Nuvalent, Turning Point Therapeutics, Blueprint Medicines, Mirati Therapeutics, Novartis, Elevation Oncology, Bayer, Genentech and Regeneron; received institutional research funds from Hengrui Therapeutics, Turning Point Therapeutics, Neon Therapeutics, Relay Therapeutics, Roche/Genentech, Pfizer, Linnaeus Therapeutics, Elevation Oncology, Nuvalent, and Novartis; and received travel support from Pfizer. L.V.S. has served as a compensated consultant for Genentech, AstraZeneca and Janssen, and has received institutional research support from BI, AZ, Novartis, Genentech, LOXO and Blueprint Medicines. M.L. has served as a compensated consulted for C4 Therapeutics. R.B. has served as a compensated consultant for Pfizer and Health Advances. Y.E.M. has served as a compensated consultant for Foresee Genomics. Z.P. has served as a compensated consultant and/or received honoraria from Sanofi, Janssen, Taiho, Takeda, AstraZeneca, Eli Lilly, Daiichi Sankyo, Cullinan Oncology, C4 Therapeutics, Jazz Pharmaceuticals, Blueprint Medicines, InCyte and Genentech, travel support from AstraZeneca, and research funding (to institution) from Novartis, Takeda, Spectrum, AstraZeneca, Tesaro/GSK, Cullinan, Daiichi Sankyo, AbbVie, Janssen and Blueprint. M.S. is currently an employee of ImmunoGen; C.B., A.T.S. and are currently employees of Novartis, Inc.; J.A.E is currently an employee of Treeline Biosciences (their contributions to the manuscript occurred while they were employees of Massachusetts General Hospital). The remaining authors (H.I., R.S., A.A., N.N., S.O., A.L., S.M., W.S., H.F.C., F.M.S., N.P., P.J., D.T., S.B., M.G.C., H.L.A., V.N., K.D., A.R., M.K.B., R.G.C., L.Z., N.J.D., C.S.C., B.Y.Y., J.J.K.L, R.B., M.S.L.) declare no competing interests.
Data availability
Whole genome and exome sequencing data on clinical tumor samples is available at dbGaP under the accession number phs003256.v1.p1 (http://www.ncbi.nlm.nih.gov/projects/gap/cgi-bin/study.cgi?study_id=phs003256.v1.p1). DNA (whole genome and whole exome), RNA (whole transcriptome), ATAC sequencing data on experimental models is available from the NIH Sequence Read Archive (SRA) under BioProject ID PRJNA941908 (https://www.ncbi.nlm.nih.gov/bioproject/) and at the GEO (http://www.ncbi.nlm.nih.gov/geo) under the accession numbers GSE75602. Sequencing metrics and mutational analyses are provided as Supplementary Tables 4–9. Uncropped western blot images and flow cytometry data are provided as Supplementary Data Figures 1–5. The code used to run the ApoTrack analysis is available at https://github.com/m0s0lawrence/ApoTrack.
References
- 1.Kobayashi S et al. EGFR mutation and resistance of non-small-cell lung cancer to gefitinib. N Engl J Med 352, 786–792 (2005). 10.1056/NEJMoa044238 [DOI] [PubMed] [Google Scholar]
- 2.Engelman JA et al. MET amplification leads to gefitinib resistance in lung cancer by activating ERBB3 signaling. Science 316, 1039–1043 (2007). 10.1126/science.1141478 [DOI] [PubMed] [Google Scholar]
- 3.Sequist LV et al. Genotypic and histological evolution of lung cancers acquiring resistance to EGFR inhibitors. Sci Transl Med 3, 75ra26 (2011). 10.1126/scitranslmed.3002003 [DOI] [PMC free article] [PubMed] [Google Scholar]
- 4.Gainor JF et al. Molecular Mechanisms of Resistance to First- and Second-Generation ALK Inhibitors in ALK-Rearranged Lung Cancer. Cancer Discov 6, 1118–1133 (2016). 10.1158/2159-8290.CD-16-0596 [DOI] [PMC free article] [PubMed] [Google Scholar]
- 5.Salter JD, Bennett RP & Smith HC The APOBEC Protein Family: United by Structure, Divergent in Function. Trends Biochem Sci 41, 578–594 (2016). 10.1016/j.tibs.2016.05.001 [DOI] [PMC free article] [PubMed] [Google Scholar]
- 6.de Bruin EC et al. Spatial and temporal diversity in genomic instability processes defines lung cancer evolution. Science 346, 251–256 (2014). 10.1126/science.1253462 [DOI] [PMC free article] [PubMed] [Google Scholar]
- 7.Roberts SA et al. An APOBEC cytidine deaminase mutagenesis pattern is widespread in human cancers. Nat Genet 45, 970–976 (2013). 10.1038/ng.2702 [DOI] [PMC free article] [PubMed] [Google Scholar]
- 8.Burns MB et al. APOBEC3B is an enzymatic source of mutation in breast cancer. Nature 494, 366–370 (2013). 10.1038/nature11881 [DOI] [PMC free article] [PubMed] [Google Scholar]
- 9.Cortez LM et al. APOBEC3A is a prominent cytidine deaminase in breast cancer. PLoS Genet 15, e1008545 (2019). 10.1371/journal.pgen.1008545 [DOI] [PMC free article] [PubMed] [Google Scholar]
- 10.Law EK et al. APOBEC3A catalyzes mutation and drives carcinogenesis in vivo. J Exp Med 217 (2020). 10.1084/jem.20200261 [DOI] [PMC free article] [PubMed] [Google Scholar]
- 11.Hata AN et al. Tumor cells can follow distinct evolutionary paths to become resistant to epidermal growth factor receptor inhibition. Nat Med 22, 262–269 (2016). 10.1038/nm.4040 [DOI] [PMC free article] [PubMed] [Google Scholar]
- 12.Shaw AT et al. Resensitization to Crizotinib by the Lorlatinib ALK Resistance Mutation L1198F. The New England journal of medicine 374, 54–61 (2016). 10.1056/NEJMoa1508887 [DOI] [PMC free article] [PubMed] [Google Scholar]
- 13.Yoda S et al. Sequential ALK Inhibitors Can Select for Lorlatinib-Resistant Compound ALK Mutations in ALK-Positive Lung Cancer. Cancer Discov 8, 714–729 (2018). 10.1158/2159-8290.CD-17-1256 [DOI] [PMC free article] [PubMed] [Google Scholar]
- 14.Nik-Zainal S et al. Mutational processes molding the genomes of 21 breast cancers. Cell 149, 979–993 (2012). 10.1016/j.cell.2012.04.024 [DOI] [PMC free article] [PubMed] [Google Scholar]
- 15.Mas-Ponte D & Supek F DNA mismatch repair promotes APOBEC3-mediated diffuse hypermutation in human cancers. Nat Genet 52, 958–968 (2020). 10.1038/s41588-020-0674-6 [DOI] [PMC free article] [PubMed] [Google Scholar]
- 16.Endesfelder D et al. Chromosomal instability selects gene copy-number variants encoding core regulators of proliferation in ER+ breast cancer. Cancer Res 74, 4853–4863 (2014). 10.1158/0008-5472.CAN-13-2664 [DOI] [PMC free article] [PubMed] [Google Scholar]
- 17.Petljak M et al. Characterizing Mutational Signatures in Human Cancer Cell Lines Reveals Episodic APOBEC Mutagenesis. Cell 176, 1282–1294 e1220 (2019). 10.1016/j.cell.2019.02.012 [DOI] [PMC free article] [PubMed] [Google Scholar]
- 18.Jalili P et al. Quantification of ongoing APOBEC3A activity in tumor cells by monitoring RNA editing at hotspots. Nat Commun 11, 2971 (2020). 10.1038/s41467-020-16802-8 [DOI] [PMC free article] [PubMed] [Google Scholar]
- 19.Chan K et al. An APOBEC3A hypermutation signature is distinguishable from the signature of background mutagenesis by APOBEC3B in human cancers. Nat Genet 47, 1067–1072 (2015). 10.1038/ng.3378 [DOI] [PMC free article] [PubMed] [Google Scholar]
- 20.Buisson R et al. Passenger hotspot mutations in cancer driven by APOBEC3A and mesoscale genomic features. Science 364 (2019). 10.1126/science.aaw2872 [DOI] [PMC free article] [PubMed] [Google Scholar]
- 21.Ito F, Fu Y, Kao SA, Yang H & Chen XS Family-Wide Comparative Analysis of Cytidine and Methylcytidine Deamination by Eleven Human APOBEC Proteins. J Mol Biol 429, 1787–1799 (2017). 10.1016/j.jmb.2017.04.021 [DOI] [PMC free article] [PubMed] [Google Scholar]
- 22.Petljak M et al. Mechanisms of APOBEC3 mutagenesis in human cancer cells. Nature 607, 799–807 (2022). 10.1038/s41586-022-04972-y [DOI] [PMC free article] [PubMed] [Google Scholar]
- 23.Soria JC et al. Osimertinib in Untreated EGFR-Mutated Advanced Non-Small-Cell Lung Cancer. The New England journal of medicine 378, 113–125 (2018). 10.1056/NEJMoa1713137 [DOI] [PubMed] [Google Scholar]
- 24.Sharma S et al. APOBEC3A cytidine deaminase induces RNA editing in monocytes and macrophages. Nat Commun 6, 6881 (2015). 10.1038/ncomms7881 [DOI] [PMC free article] [PubMed] [Google Scholar]
- 25.Sharma S, Patnaik SK, Kemer Z & Baysal BE Transient overexpression of exogenous APOBEC3A causes C-to-U RNA editing of thousands of genes. RNA Biol 14, 603–610 (2017). 10.1080/15476286.2016.1184387 [DOI] [PMC free article] [PubMed] [Google Scholar]
- 26.Sharma S & Baysal BE Stem-loop structure preference for site-specific RNA editing by APOBEC3A and APOBEC3G. PeerJ 5, e4136 (2017). 10.7717/peerj.4136 [DOI] [PMC free article] [PubMed] [Google Scholar]
- 27.Oh S & Buisson R A digital PCR-based protocol to detect and quantify RNA editing events at hotspots. STAR Protoc 3, 101148 (2022). 10.1016/j.xpro.2022.101148 [DOI] [PMC free article] [PubMed] [Google Scholar]
- 28.Consortium I. T. P.-C. A. o. W. G. Pan-cancer analysis of whole genomes. Nature 578, 82–93 (2020). 10.1038/s41586-020-1969-6 [DOI] [PMC free article] [PubMed] [Google Scholar]
- 29.Lee JK et al. Clonal History and Genetic Predictors of Transformation Into Small-Cell Carcinomas From Lung Adenocarcinomas. J Clin Oncol 35, 3065–3074 (2017). 10.1200/JCO.2016.71.9096 [DOI] [PubMed] [Google Scholar]
- 30.Offin M et al. Concurrent RB1 and TP53 Alterations Define a Subset of EGFR-Mutant Lung Cancers at risk for Histologic Transformation and Inferior Clinical Outcomes. J Thorac Oncol 14, 1784–1793 (2019). 10.1016/j.jtho.2019.06.002 [DOI] [PMC free article] [PubMed] [Google Scholar]
- 31.Niederst MJ et al. RB loss in resistant EGFR mutant lung adenocarcinomas that transform to small-cell lung cancer. Nat Commun 6, 6377 (2015). 10.1038/ncomms7377 [DOI] [PMC free article] [PubMed] [Google Scholar]
- 32.Piotrowska Z et al. Heterogeneity and Coexistence of T790M and T790 Wild-Type Resistant Subclones Drive Mixed Response to Third-Generation Epidermal Growth Factor Receptor Inhibitors in Lung Cancer. JCO Precis Oncol 2018 (2018). 10.1200/PO.17.00263 [DOI] [PMC free article] [PubMed] [Google Scholar]
- 33.Oh S et al. Genotoxic stress and viral infection induce transient expression of APOBEC3A and pro-inflammatory genes through two distinct pathways. Nat Commun 12, 4917 (2021). 10.1038/s41467-021-25203-4 [DOI] [PMC free article] [PubMed] [Google Scholar]
- 34.Bivona TG et al. FAS and NF-kappaB signalling modulate dependence of lung cancers on mutant EGFR. Nature 471, 523–526 (2011). 10.1038/nature09870 [DOI] [PMC free article] [PubMed] [Google Scholar]
- 35.Blakely CM et al. NF-kappaB-activating complex engaged in response to EGFR oncogene inhibition drives tumor cell survival and residual disease in lung cancer. Cell Rep 11, 98–110 (2015). 10.1016/j.celrep.2015.03.012 [DOI] [PMC free article] [PubMed] [Google Scholar]
- 36.Burrell RA et al. Replication stress links structural and numerical cancer chromosomal instability. Nature 494, 492–496 (2013). 10.1038/nature11935 [DOI] [PMC free article] [PubMed] [Google Scholar]
- 37.Choudhury NJ et al. Molecular Biomarkers of Disease Outcomes and Mechanisms of Acquired Resistance to First-Line Osimertinib in Advanced EGFR-Mutant Lung Cancers. J Thorac Oncol (2022). 10.1016/j.jtho.2022.11.022 [DOI] [PMC free article] [PubMed] [Google Scholar]
- 38.Grillo MJ, Jones KFM, Carpenter MA, Harris RS & Harki DA The current toolbox for APOBEC drug discovery. Trends Pharmacol Sci 43, 362–377 (2022). 10.1016/j.tips.2022.02.007 [DOI] [PMC free article] [PubMed] [Google Scholar]
Extended References
- 39.Crystal AS et al. Patient-derived models of acquired resistance can identify effective drug combinations for cancer. Science (New York, N.Y.) 346, 1480–1486 (2014). 10.1126/science.1254721 [DOI] [PMC free article] [PubMed] [Google Scholar]
- 40.Bailey MH et al. Retrospective evaluation of whole exome and genome mutation calls in 746 cancer samples. Nat Commun 11, 4748 (2020). 10.1038/s41467-020-18151-y [DOI] [PMC free article] [PubMed] [Google Scholar]
- 41.Li H & Durbin R Fast and accurate long-read alignment with Burrows-Wheeler transform. Bioinformatics 26, 589–595 (2010). 10.1093/bioinformatics/btp698 [DOI] [PMC free article] [PubMed] [Google Scholar]
- 42.Cibulskis K et al. Sensitive detection of somatic point mutations in impure and heterogeneous cancer samples. Nat Biotechnol 31, 213–219 (2013). 10.1038/nbt.2514 [DOI] [PMC free article] [PubMed] [Google Scholar]
- 43.Alexandrov LB et al. Signatures of mutational processes in human cancer. Nature 500, 415–421 (2013). 10.1038/nature12477 [DOI] [PMC free article] [PubMed] [Google Scholar]
- 44.Lin JJ et al. Small cell transformation of ROS1 fusion-positive lung cancer resistant to ROS1 inhibition. NPJ Precis Oncol 4, 21 (2020). 10.1038/s41698-020-0127-9 [DOI] [PMC free article] [PubMed] [Google Scholar]
- 45.Dardaei L et al. SHP2 inhibition restores sensitivity in ALK-rearranged non-small-cell lung cancer resistant to ALK inhibitors. Nat Med 24, 512–517 (2018). 10.1038/nm.4497 [DOI] [PMC free article] [PubMed] [Google Scholar]
- 46.Lawrence MS et al. Mutational heterogeneity in cancer and the search for new cancer-associated genes. Nature 499, 214–218 (2013). 10.1038/nature12213 [DOI] [PMC free article] [PubMed] [Google Scholar]
- 47.Lawrence MS et al. Discovery and saturation analysis of cancer genes across 21 tumour types. Nature 505, 495–501 (2014). 10.1038/nature12912 [DOI] [PMC free article] [PubMed] [Google Scholar]
- 48.Ellrott K et al. Scalable Open Science Approach for Mutation Calling of Tumor Exomes Using Multiple Genomic Pipelines. Cell Syst 6, 271–281 e277 (2018). 10.1016/j.cels.2018.03.002 [DOI] [PMC free article] [PubMed] [Google Scholar]
- 49.Drier Y et al. Somatic rearrangements across cancer reveal classes of samples with distinct patterns of DNA breakage and rearrangement-induced hypermutability. Genome Res 23, 228–235 (2013). 10.1101/gr.141382.112 [DOI] [PMC free article] [PubMed] [Google Scholar]
- 50.Krzywinski M et al. Circos: an information aesthetic for comparative genomics. Genome Res 19, 1639–1645 (2009). 10.1101/gr.092759.109 [DOI] [PMC free article] [PubMed] [Google Scholar]
- 51.Dobin A et al. STAR: ultrafast universal RNA-seq aligner. Bioinformatics 29, 15–21 (2013). 10.1093/bioinformatics/bts635 [DOI] [PMC free article] [PubMed] [Google Scholar]
- 52.Buenrostro JD, Giresi PG, Zaba LC, Chang HY & Greenleaf WJ Transposition of native chromatin for fast and sensitive epigenomic profiling of open chromatin, DNA-binding proteins and nucleosome position. Nat Methods 10, 1213–1218 (2013). 10.1038/nmeth.2688 [DOI] [PMC free article] [PubMed] [Google Scholar]
- 53.Corces MR et al. An improved ATAC-seq protocol reduces background and enables interrogation of frozen tissues. Nat Methods 14, 959–962 (2017). 10.1038/nmeth.4396 [DOI] [PMC free article] [PubMed] [Google Scholar]
- 54.Langmead B & Salzberg SL Fast gapped-read alignment with Bowtie 2. Nat Methods 9, 357–359 (2012). 10.1038/nmeth.1923 [DOI] [PMC free article] [PubMed] [Google Scholar]
- 55.Li H & Durbin R Fast and accurate short read alignment with Burrows-Wheeler transform. Bioinformatics 25, 1754–1760 (2009). 10.1093/bioinformatics/btp324 [DOI] [PMC free article] [PubMed] [Google Scholar]
- 56.Zhang Y et al. Model-based analysis of ChIP-Seq (MACS). Genome Biol 9, R137 (2008). 10.1186/gb-2008-9-9-r137 [DOI] [PMC free article] [PubMed] [Google Scholar]
- 57.Chen Y, Lun AT & Smyth GK From reads to genes to pathways: differential expression analysis of RNA-Seq experiments using Rsubread and the edgeR quasi-likelihood pipeline. F1000Res 5, 1438 (2016). 10.12688/f1000research.8987.2 [DOI] [PMC free article] [PubMed] [Google Scholar]
- 58.Schep AN, Wu B, Buenrostro JD & Greenleaf WJ chromVAR: inferring transcription-factor-associated accessibility from single-cell epigenomic data. Nat Methods 14, 975–978 (2017). 10.1038/nmeth.4401 [DOI] [PMC free article] [PubMed] [Google Scholar]
- 59.Khan A et al. JASPAR 2018: update of the open-access database of transcription factor binding profiles and its web framework. Nucleic Acids Res 46, D260–D266 (2018). 10.1093/nar/gkx1126 [DOI] [PMC free article] [PubMed] [Google Scholar]
- 60.Ramirez F et al. deepTools2: a next generation web server for deep-sequencing data analysis. Nucleic Acids Res 44, W160–165 (2016). 10.1093/nar/gkw257 [DOI] [PMC free article] [PubMed] [Google Scholar]
- 61.Buisson R, Lawrence MS, Benes CH & Zou L APOBEC3A and APOBEC3B Activities Render Cancer Cells Susceptible to ATR Inhibition. Cancer Res 77, 4567–4578 (2017). 10.1158/0008-5472.CAN-16-3389 [DOI] [PMC free article] [PubMed] [Google Scholar]
- 62.Ran FA et al. Genome engineering using the CRISPR-Cas9 system. Nat Protoc 8, 2281–2308 (2013). 10.1038/nprot.2013.143 [DOI] [PMC free article] [PubMed] [Google Scholar]
- 63.Gyori BM, Venkatachalam G, Thiagarajan PS, Hsu D & Clement MV OpenComet: an automated tool for comet assay image analysis. Redox Biol 2, 457–465 (2014). 10.1016/j.redox.2013.12.020 [DOI] [PMC free article] [PubMed] [Google Scholar]
- 64.Raoof S et al. Targeting FGFR overcomes EMT-mediated resistance in EGFR mutant non-small cell lung cancer. Oncogene 38, 6399–6413 (2019). 10.1038/s41388-019-0887-2 [DOI] [PMC free article] [PubMed] [Google Scholar]
Associated Data
This section collects any data citations, data availability statements, or supplementary materials included in this article.
Supplementary Materials
Data Availability Statement
Whole genome and exome sequencing data on clinical tumor samples is available at dbGaP under the accession number phs003256.v1.p1 (http://www.ncbi.nlm.nih.gov/projects/gap/cgi-bin/study.cgi?study_id=phs003256.v1.p1). DNA (whole genome and whole exome), RNA (whole transcriptome), ATAC sequencing data on experimental models is available from the NIH Sequence Read Archive (SRA) under BioProject ID PRJNA941908 (https://www.ncbi.nlm.nih.gov/bioproject/) and at the GEO (http://www.ncbi.nlm.nih.gov/geo) under the accession numbers GSE75602. Sequencing metrics and mutational analyses are provided as Supplementary Tables 4–9. Uncropped western blot images and flow cytometry data are provided as Supplementary Data Figures 1–5. The code used to run the ApoTrack analysis is available at https://github.com/m0s0lawrence/ApoTrack.