Abstract
Accurate identification of cell cycle phases in single-cell RNA-sequencing (scRNA-seq) data is crucial for biomedical research. Many methods have been developed to tackle this challenge, employing diverse approaches to predict cell cycle phases. In this review article, we delve into the standard processes in identifying cell cycle phases within scRNA-seq data and present several representative methods for comparison. To rigorously assess the accuracy of these methods, we propose an error function and employ multiple benchmarking datasets encompassing human and mouse data. Our evaluation results reveal a key finding: the fit between the reference data and the dataset being analyzed profoundly impacts the effectiveness of cell cycle phase identification methods. Therefore, researchers must carefully consider the compatibility between the reference data and their dataset to achieve optimal results. Furthermore, we explore the potential benefits of incorporating benchmarking data with multiple known cell cycle phases into the analysis. Merging such data with the target dataset shows promise in enhancing prediction accuracy. By shedding light on the accuracy and performance of cell cycle phase prediction methods across diverse datasets, this review aims to motivate and guide future methodological advancements. Our findings offer valuable insights for researchers seeking to improve their understanding of cellular dynamics through scRNA-seq analysis, ultimately fostering the development of more robust and widely applicable cell cycle identification methods.
Keywords: cell cycle phase prediction, single-cell RNA-seq, transfer learning, enrichment score, data integration
INTRODUCTION
Understanding how cells divide and proliferate is of paramount importance, both from a fundamental biological perspective and in the realm of biomedical sciences. Cell cycle dysregulation, as seen in cancer cells, can lead to uncontrolled growth and proliferation [1]. Consequently, comprehending the mechanisms governing the cell cycle is key to developing cell cycle–targeting therapies [2]. Additionally, the cell cycle plays a vital role in organ and tissue development [3], and studying it provides insights into tissue regeneration [4].
Recently, as sequencing analysis has become increasingly important [5, 6], single-cell RNA sequencing (scRNA-seq) has emerged as a powerful tool for investigating the cell cycle [7], enabling the identification of the cell cycle phases based on gene expression profiles [8]. By analyzing gene expression profiles of individual cells, researchers can classify cells into different stages of the cell cycle and study the dynamics of gene expression during this process. This approach allows the identification of differentially expressed genes that may play a role in cell cycle regulation [9–11]. Furthermore, scRNA-seq can be employed to investigate cell cycle dynamics in specific cell types [12], shedding light on cell type–specific regulation and identifying potential therapeutic targets. Additionally, spatial transcriptomics approaches have also been developed to study the cell cycle in various tissue regions, potentially revealing region-specific cell cycle regulators [13–15].
At the same time, the cell cycle can have a significant impact on scRNA-seq analysis because it can introduce bias to the analysis results [16, 17]. Cells in different stages of the cell cycle exhibit distinct gene expression profiles, which, if not properly considered, can lead to inaccurate analysis conclusions [8]. Computational methods are commonly employed to address these biases by identifying and removing cell cycle phase variations. Nevertheless, caution is needed, as improperly removing cell cycle features can introduce biases and distort the results [16]. Therefore, accurate identification of cell cycle phases from scRNA-seq is in urgent need.
Here, we review existing methods for cell cycle phase identification. We assess the prediction performance of these methods and propose potential beneficial analysis strategies. The cell cycle can be broadly divided into two main phases: the interphase and the M (mitosis) phase. The interphase is further subdivided into three distinct stages: G1 (the cell prepares itself for division), S (DNA synthesis) and G2 (the cell condenses genetic material for division). The cell cycle starts from G1, through S and G2, ending with the M stage, where the genetic material is separated into two daughter cells. Once the M phase is complete, the parent cell divides, giving rise to two daughter cells, each of which enters its own cell cycle anew. Moreover, not all cells participate in the cell cycle continuously. Some cells may exit the cell cycle temporarily or permanently and enter a quiescent phase known as G0. In the G0 phase, these cells do not undergo division; instead, they remain resting until prompted to re-enter the cell cycle under specific conditions. Since computationally identifying the G0 phase is yet still challenging, we mainly focus on the computational identification of the G1, S, G2 and M phases in this review.
METHODS FOR CELL CYCLE IDENTIFICATION
About a dozen software tools have been developed to identify cell cycle phases from single-cell RNA-seq data. These methods can be broadly classified into two main groups: the marker gene–based clustering approach and the machine learning approach, which involves pre-training with existing cell cycle phase-labeled data. A summary of these methods, along with their key features, is presented in Table 1.
Table 1.
List of methods for cell cycle phase identification
| Name | Key features | Release date | Category | Language | Link |
|---|---|---|---|---|---|
| Oscope | Cyclic genes, pseudotime | 18 October 2015 | Marker genes–based clustering | R | https://www.biostat.wisc.edu/~kendzior/OSCOPE/ |
| cyclone | Cell cycle phase | 9 December 2015 | Marker genes–based clustering | R | https://rdrr.io/bioc/scran/man/cyclone.html |
| ccRemover | Remove cell cycle | 19 August 2017 | Marker genes–based clustering | R | https://github.com/cran/ccRemover |
| f-scLVM | Cyclic genes, remove cell cycle | 11 November 2017 | Marker genes–based clustering | Python, R | https://github.com/scfurl/f-scLVM |
| cycleX | Cell cycle phase, pseudotime | 20 November 2017 | Marker genes–based clustering | Python, R | workflow |
| reCAT | Cell cycle phase, cyclic genes, g0, pseudotime | 16 March 2019 | Marker genes–based clustering | R | https://github.com/tinglab/reCAT |
| Pre-Phaser | Cell cycle phase, g0, pseudotime | 6 September 2019 | Machine learning | C++, Python | https://github.com/ayurovsky/Pre-Phaser |
| CCPE | Cell cycle phase, cyclic genes, high dimensional, pseudotime, remove cell cycle | 6 January 2021 | Marker genes–based clustering | Matlab, Python, R | https://github.com/LiuJJ0327/CCPE |
| Cyclum | Cell cycle phase, cyclic genes, pseudotime, remove cell cycle | 18 March 2020 | Machine learning | Python | https://github.com/KChen-lab/Cyclum |
| DeepCycle | Cell cycle phase, cyclic genes, deep learning, pseudotime | 29 July 2021 | Machine learning | Python | https://github.com/andreariba/DeepCycle |
| ccAF | Cell cycle phase, g0, machine learning | 14 May 2020 | Machine learning | Python | https://github.com/plaisier-lab/ccAF |
| peco | Continuum, cyclic genes, pseudotime | 13 November 2020 | Machine learning | R | https://github.com/jhsiao999/peco |
| tricycle | Cell cycle phase, cyclic genes, pseudotime, remove cell cycle, transfer learning | 18 March 2022 | Machine learning | R | https://github.com/hansenlab/tricycle |
| Seurat | Cell cycle phase, remove cell cycle, score | 27 June 2018 | Marker genes–based clustering | Python, R | https://satijalab.org/seurat/articles/cell_cycle_vignette.html |
| Revelio | Cell cycle phase, cyclic genes, pseudotime, remove cell cycle | 1 November 2020 | Marker genes–based clustering | R | https://github.com/danielschw188/Revelio |
| CSICC | Cell cycle phase, g0, pseudotime | 12 May 2022 | Marker genes–based clustering | R, Web | https://sc1.engr.uconn.edu |
For example, ccRemover [16] applies dimension reduction and bootstrap analysis of marker gene expression to detect and remove the cell-cycle effect in scRNA-seq data. Oscope [18] identifies candidate oscillatory cyclic marker genes to construct a pseudotime profile, recovering the circular states at single-cell level. Cyclone [19] utilizes a pair-based classification prediction method by comparing the proportion of marker pairs identified by marker gene expression, enabling the prediction of the cell cycle phase for each cell.
Furthermore, f-scLVM [20] models scRNA-seq data with gene set annotation to capture cell-level heterogeneity, allowing for the identification of cyclic genes and the removal of the cell cycle effect. CycleX [21] extends the traditional pseudotime analysis to multi-dimensional level, revealing the expression behavior along the cell cycle. Additionally, reCAT [22] constructs a time series from scRNA-seq data using a method based on the traveling salesman problem. Pre-Phaser [23] leverages the idea of using k-nearest neighbor cell expression to predict cell cycle phase, providing a computational framework for a more accurate cell cycle phase detection. Additionally, CCPE [24] builds a helix model based on gene expression with unsupervised clustering and estimates the cell cycle phase from the helix curve.
On the other hand, Cyclum [25] is a machine learning–based approach. Instead of focusing on marker gene expression, it uses a circular manifold with an autoencoder to obtain cell-level circular pseudotime. Similar to Cyclum, DeepCycle [9] utilized an autoencoder and RNA velocity data, assigning angles for each cell to represent their circular position in the cell cycle. ccAF [26] creates a neural network method to classify cells into discrete cell cycle phases, while peco [27] adopts a supervised machine learning approach, training the Bayes predictor with labeled data and predicting the corresponding pseudotime.
To illustrate their performance and conduct a further comparison, we choose four representative and user-friendly methods: Tricycle [28], Seurat [29], Revelio [10] and CS1CC [30]. Tricycle represents a machine learning method, while the remaining three are marker gene–based clustering methods.
Specifically, Tricycle employs transfer learning to create reference embeddings of the cell cycle time ordering, using the first two principal components from the reference data. The authors utilized cortical neurosphere data as the reference due to the cell cycle being the primary source of expression level variation in this data. Alternatively, users can select other appropriate reference data to construct corresponding reference embeddings. Using these reference embeddings, Tricycle predicts cell positions for a new scRNA-seq dataset, assuming the mean expression model adheres to a periodic function with a single peak. To achieve this, it projects the new RNA-seq data into the reference embeddings, resulting in a polar coordinate position for each cell from 0 to 2pi. Cell cycle phases are roughly assigned based on the significance of cell cycle marker gene expressions, with the S phase approximately assigned from 0.5pi to pi, the G2M phase from pi to 1.75pi, the G1 phase from 1.75pi to 0.25pi and the remaining region as undivided [28]. Leveraging the pretrained reference embedding, Tricycle enables rapid cell cycle phase prediction.
As a marker gene-based method, in the Seurat package, the ‘CellCycleScoring’ function assigns G1, S or G2M phases to each cell. It calculates enrichment scores for phases S and G2M by comparing average expression levels across marker gene sets for phase S or G2M with the control expressions. Cell cycle phases are assigned based on the more significant enrichment score. For cells having both scores negative, they will be assigned to the G1 phase. Also, cells with larger enrichment scores greater than 1 deemed undecided [29]. Seurat remains computationally efficient even with large single-cell datasets. The computational cost is in proportion to the number of cells processed.
Revelio’s ‘getCellCyclePhaseAssignInformation’ function identifies cell cycle phases by first rotating the principal component space from the gene expression data to find the 2D plane that best explains cell cycle variance. The resulting rotated first two principal components are termed dynamic components. With the assumption that cell cycle phases follow a 2D circular trajectory in the expression space, Revelio computes the cell cycle cluster score and cell cycle marker score for these dynamic components. The assignment of cell cycle phases is based on the corresponding highest score. In addition, Revelio applies multiple filters to remove potential doublets and cells with insufficient information, ensuring accurate phase assignment for high-quality cells [10]. Similar to Seurat, Revelio can also provide rapid predictions.
CS1CC (SC1 Cell Cycle analysis tool) reveals cell cycle phases by firstly clustering cells represented in transcriptome t-SNE space into a hierarchical dendrogram. The dendrogram can include at most seven clusters of cells corresponding to seven distinct phases—G1, G1/S, S, G2, G2/M, M and G0. Using the Optimal Leaf Ordering algorithm, CS1CC assigns the leaves of the dendrogram to determine the positions of cells along the cell cycle. For each cluster, CS1CC utilizes the mean expression level of corresponding marker genes to establish the cell phase. Moreover, it provides an approach to distinguish non-dividing cells based on the Gene-Smoothness Score (GSS) in each cluster, where GSS less than 0.05 indicates non-dividing cells [30]. Since CS1CC is a web-based tool that requires the creation of a hierarchical dendrogram before prediction, this method is slightly more time-consuming compared to others. For a dataset comprising 247 cells, this approach yields results in approximately 3 min.
Currently, due to the absence of a standardized cell cycle phase division strategy, different cell cycle phase prediction methods may utilize varying phase categories. For instance, the recommended reference marker gene set for Seurat consists of three phases: G1, S and G2M, while Revelio includes the phases G1S, S, G2, G2M and MG1. Furthermore, different benchmarking datasets might employ different cell cycle indicators, leading to different phase labels. For example, our hESC benchmarking dataset labeled cell cycle phases as G1, S and G2, whereas the mESC-Q dataset labeled cells in G1, S and G2M. Consequently, calculating the prediction accuracy becomes challenging.
Inspired by the circular trajectory feature of the cell cycle, to compare the performance of these four methods, we encoded different cell cycle phases as angles in a circle, from 0 to pi. Phases G1, G1S, S, SG2, G2, G2M, M and MG1 are encoded as 0, 1/8pi, pi/4, 3/8pi, 1/2pi, 5/8pi, 3/4pi and 7/8pi correspondingly. Assume the true encoded cell cycle phase is  and the predicted encoded cell cycle phase is
  , the error between the predicted value and the true value is defined by
  . The further the predicted value is from the true value in the cycle, the larger the error, enabling a proper measurement of circular values prediction performance.
BENCHMARKING DATASETS
To evaluate the accuracy of cell cycle prediction methods, we utilized four widely used datasets comprising both human and mouse cells as benchmarking data. These datasets were thoughtfully selected to encompass diverse cell types and distributions of cell cycle phases.
Human embryonic stem cell (hESC) data [18]. Cells undergoing scRNA-seq were sorted using the fluorescence-activated cell sorting (FACS). Their cell cycles were identified using fluorescent ubiquitination-based cell-cycle indicator (FUCCI). This dataset includes 91, 80 and 76 cells in G1, S and G2 phases, respectively. All cells in this dataset are expected to be proliferating.
Mouse embryonic stem (ES) cell data by Quartz-Seq [31] (mESC-Q). Quartz-Seq is a novel single-cell RNA-seq method that can differentiate cell-cycle phases of a single cell type. The dataset comprises 20, 7 and 8 ES cells in G1, S and G2M phases, respectively. All cells in this dataset are expected to proliferate.
Mouse embryonic stem cell (mESC) data [17]. Cell cycle phases of mESCs are identified based on FACS with Hoechst staining. The dataset contains a total of 288 cells: 96 cells in each G1, S and G2M phase used for single-cell RNA-seq with Fluidigm C1 protocol. All mESCs in this dataset are expected to be proliferating.
Human retinal pigment epithelial (RPE)–FUCCI cell data [32]. RPE-FUCCI is a human untransformed cell line, RPE-1, annotated by the FUCCI system. In this dataset, 244 and 30 cells are identified as G1 and G2M phases by FUCCI after performing single-cell RNA-seq with FACS. Although all cells are classified into two cycle phases, this dataset also includes the cell cycle time (the time in minutes since the completion of metaphase) as a more detailed reference. Since this study primarily focused on the M-G1 phase transition, the RPE-FUCCI cells in this dataset are expected to be proliferating. Cells in this experiment are separated into three plates, and we specifically analyze plate 2 in this review.
We evaluated four chosen methods on our four benchmarking datasets, encompassing both human and mouse genes. Tricycle supports direct usage for both human and mouse data through its integrated ‘species’ parameter specification. For other methods, as the provided cell cycle marker genes are for humans, we converted the mouse genes in the scRNA-seq data to their human counterparts using the ‘biomaRt’ package in R, leveraging homology.
Moreover, we conducted special analysis tasks based on the hESC data. Specifically, we divided hESC data based on their cell cycle phases into three test datasets: G1, S and G2. We then evaluated the accuracy of the cell cycle prediction methods for each test dataset, which only includes a single-cell phase. This approach enables us to more effectively explore variations in predictive performance across different cell phases. Since the prediction methods rely on comparing marker gene expressions across various phases, the presence of cells from multiple cell cycle phases in the data might precondition the cell cycle prediction and potentially enhance the accuracy of the results. To test the hypothesis, we performed additional simulations blending cells from different phases to each of the test dataset. For example, we blended the G1 data set with randomly chosen proportions (20%, 40%, 60% and 80%) of the remaining S and G2 cells. Subsequently, we evaluated whether this additional padding of cells from different phases would improve prediction accuracy for G1 cells. By assessing the impact of padding the G1 dataset with cells from other phases, we can gain valuable insights into the influence of data composition on the accuracy of cell cycle phase predictions.
COMPARISON RESULTS
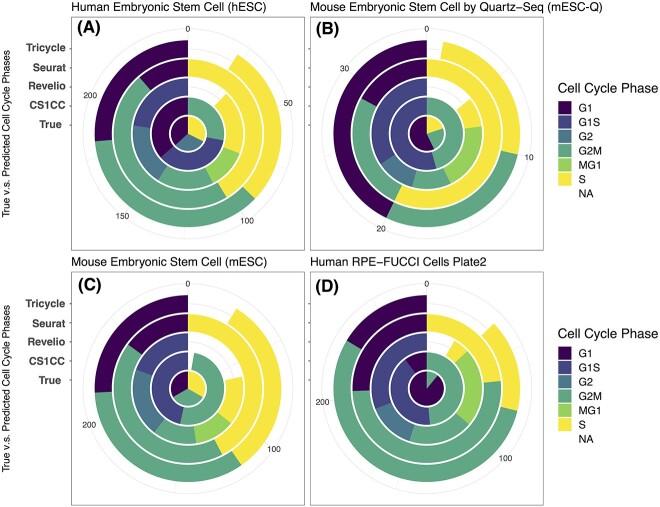
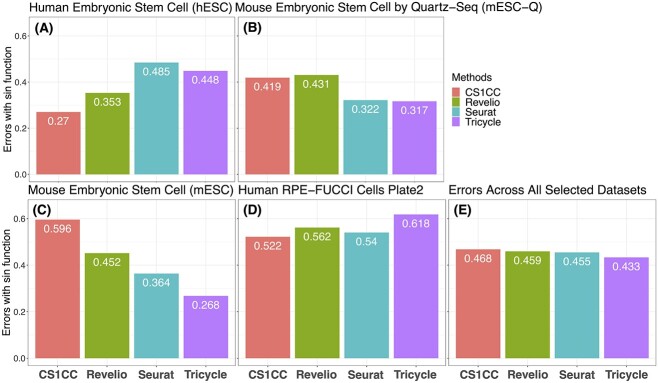
In this study, we employed four commonly used methods, namely, Tricycle, Seurat, Revelio and CS1CC, to identify cell cycle phases using four scRNA-seq data sets. The prediction results are shown in Figure 1, and the errors are shown in Figure 2. It was observed that no single method outperforms the others consistently across all datasets, indicating that the performance of these approaches is highly dependent on the specific characteristics of the scRNA-seq data.
Figure 1.
Pie charts showing the distribution of true and predicted cell cycle phases. The center of each chat exhibits the actual cell cycle phases that were experimentally labeled. The outer circles of the chart display the phases that were predicted by four different methods: CS1CC, Revelio, Seuret and Tricycle (from inside to outside). Phase G1, G1S, G2, G2M, MG1, S and NA are plotted counterclockwise. Four scRNA-seq data sets are used: (A) hESC; (B) mESC-Q; (C) mESC; and (D) human RPE-FUCCI cells (plate 2).
Figure 2.
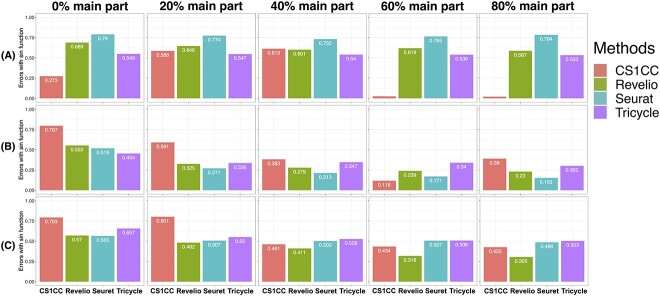
Errors of cell cycle phase identification methods on four scRNA-seq data sets. Errors are calculated in the circular space. The datasets of hESC (A), mESC-Q (B), mESC (C) and human RPE-FUCCI cells (D) are used. The average errors across datasets are summarized in (E).
Notably, in our analysis, Tricycle demonstrated relatively accurate predictions for mouse data while being less accurate for human data (Figures 1 and 2). This discrepancy may be attributed to the fact that the mouse data share more similarities with the training data used in Tricycle, compared to the human data. This highlights the importance of data compatibility and the reference embedding used for projection in the transfer learning approach. Nevertheless, Tricycle’s success in predicting mouse stem cell data given cortical neurosphere reference data (Figures 1C and 2C) showcases the potential of transfer learning, especially when dealing with new data lacking sufficient direct references.
Seurat, Revelio and CS1CC implemented a cell cycle marker gene enrichment clustering approach, which involves identifying genes with high expression levels during different cell cycle phases. Although this approach successfully predicted many cell cycle phases, it also resulted in a considerable number of mismatches. These discrepancies might be attributed to noise in the single-cell RNA-seq data, ambiguity in cell cycle marker genes, systematic errors in the marker gene enrichment approach or differences in the implementation of each model.
Both Seurat and Revelio assign cells by selecting the cell cycle phase with the highest score, potentially leading to random phase assignments for cells with similar scores across all phases. Consequently, Seurat and Revelio consistently assign cells to one of the predetermined cell cycle phases, irrespective of the actual cell cycle phases. In contrast, CS1CC begins by identifying clusters, allowing the number of clusters to vary instead of being fixed. It then proceeds to assign cell cycle phases based on the score for each cluster. This implementation offers greater flexibility in predicting datasets with various composition of phases but carries the risk of misclassifying entire clusters of cells.
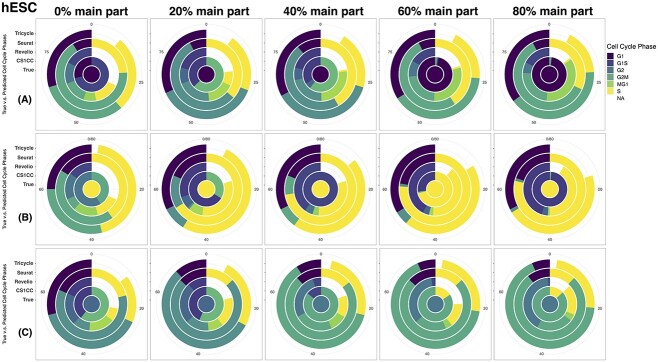
As evident from Figure 1, Seurat and Revelio consistently assign cells to all their available phases (three and five phases, respectively), whereas CS1CC demonstrates more adaptability, assigning three phases for the human datasets (Figure 1A and D) and two phases for the mouse datasets (Figures 1B and C). Similar observations were made in the simulation results (Figure 3), where cells from a single phase (as the single color in the center indicated) were assigned to multiple possible phases by Seurat and Revelio, resulting in numerous mismatches. On the other hand, when we considered G1 cells padded with randomly chosen 60% or 80% of the remaining cells from different phases (Figure 3A, 5th and 6th columns), CS1CC successfully recognized the majority cells are G1. However, for data with only S cells and 0% main part blended (Figure 3B, 1st column), CS1CC misclassified the entire samples to MG1 and G2M phases.
Figure 3.
Evaluation results of the selected methods on simulated datasets. G1 (A), S (B) and G2 (C) cells from the hESC data are merged with randomly chosen proportions (0%, 20%, 40%, 60% and 80%) of the remaining cells. The circle in the center of the chart displays the actual cell cycle phases that were experimentally labeled. The outer circles of the graph display the phases that were predicted by four different methods: CS1CC, Revelio, Seuret and Tricycle (from inside to outside). Phase G1, G1S, G2, G2M, MG1, S and NA are plotted counterclockwise.
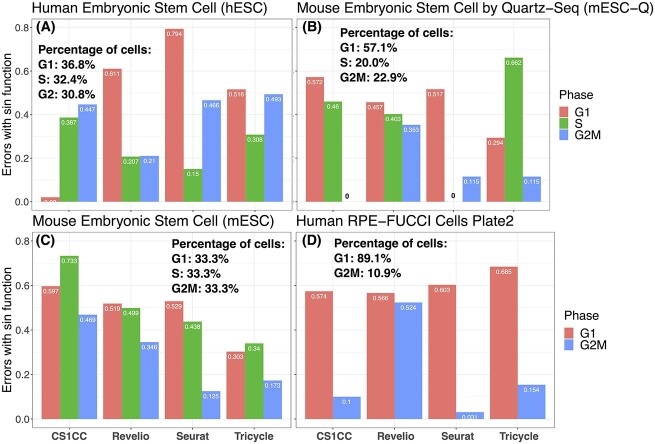
Based on the breakdown of evaluation results for each cell cycle phase across the four benchmarking datasets (Figure 4) and the error summarization of simulation results for hESC (Figure 5), it is evident that CS1CC performs exceptionally well in identifying the G1 phase in hESC. This result remained robust across different proportions of padding cells in the simulation (Figure 5A). This could be attributed to the larger number of G1-specific marker genes compared to other phases, indicating that the accuracy of the prediction improves with an increased amount of high-quality marker information. Hence, careful selection of high-quality cell cycle marker gene sets, as well as thoughtful consideration of implementation in the analysis pipeline, is crucial for this kind of approach.
Figure 4.
Evaluation results specified by individual phases for considered methods. Errors are calculated in the circular space for each phase. The phase compositions of each data set are shown on each subpanel. (A) hESC; (B) mESC-Q; (C) mESC; and (D) human RPE-FUCCI cells.
Figure 5.
Errors of the selected methods on simulated datasets. G1 (A), S (B) and G2 (C) cells from the hESC data are merged with randomly chosen proportions (0%, 20%, 40%, 60% and 80%) of the remaining cells. Errors are calculated in the circular space for each method.
Additionally, analyzing the simulation results in Figure 5, we noticed that higher proportions of primary data blended into the test datasets resulted in lower error scores for all four methods. This suggests that leveraging benchmarking data with multiple known cell cycle phases and merging them with the new data for cell cycle phase prediction could improve prediction accuracy, especially for methods that use the unsupervised clustering approach.
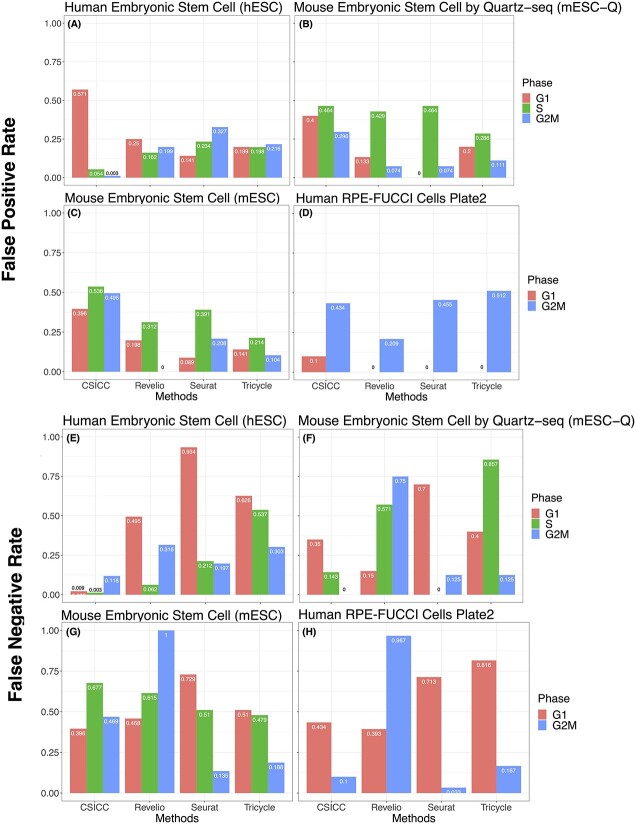
In addition to the circular error calculation, we also evaluated the performance based on whether the predicted phase matches (or partial matches, e.g. G2 matches G2M) the underlying true phase. The breakdown of false positives and false negatives for each cell phase across all methods is depicted in Figure 6, exhibiting results similar to those in Figure 4. The accuracy based on phase matching for the benchmarking datasets and the simulations is illustrated in Supplementary Figures S1–S4, exhibiting results similar to those obtained by circular error calculation. Notably, CS1CC generally demonstrated a relatively higher accuracy for the benchmarking data and the G1 cell simulation studies.
Figure 6.
Evaluation results based on phase matching for considered methods. False-positive (A–D) and false-negative rates (E–H) are calculated for each phase based on direct phase matching or partial matching. (A) and (E) hESC; (B) and (F) mESC-Q; (C) and (G) mESC; and (D) and (H) human RPE-FUCCI cells.
Overall, our evaluation emphasizes that the accuracy of cell cycle prediction methods varies depending on the specific dataset. The transfer learning approach’s success depends on the shared signal between the reference embedding and the dataset. For the cell cycle marker gene approach, the proper selection of the marker gene set is critical. Moreover, integrating benchmarking data with known cell cycle phases into new datasets can significantly enhance prediction accuracy. Therefore, researchers should carefully consider the cell types in their dataset and the compatibility of the selected cell cycle marker gene sets when choosing a cell cycle prediction method.
DISCUSSION AND FUTURE PERSPECTIVES
In this study, we conducted a comprehensive evaluation of four commonly used methods for identifying cell cycle phases from single-cell RNA-seq data. Our findings indicate that the transfer learning approach demonstrates promising performance, particularly when a suitable reference embedding is utilized. Additionally, the marker gene approach can yield accurate results if the selected marker gene list is well suited to the dataset, emphasizing the significance of careful marker gene selection, normalization and filtering steps in the analysis pipeline. Furthermore, merging benchmarking data with known cell cycle phases to the new query data set proves to be a viable strategy for improving prediction accuracy.
To enable a direct comparison of results across all four methods, we categorized the continuous results provided by Tricycle using a strategy proposed from their function annotations. This categorization might have reduced the validity of Tricycle’s method since they indicated that a continuous cell cycle assignment would be more meaningful. As for Seurat, Revelio and SC1CC, we evaluated their performance based solely on their suggested cell cycle marker genes. Fine-tuning the marker gene list for a specific dataset could increase prediction accuracy.
Our analysis offers valuable insights into the accuracy of cell cycle prediction methods and their performance across different datasets. Developing accurate cell cycle prediction methods is crucial for gaining a comprehensive understanding of single-cell RNA-seq data and effectively removing the cell cycle as a confounding factor during differential analysis. Our findings emphasize the importance of carefully evaluating the accuracy of different cell cycle prediction methods and selecting the one that best suits the specific dataset.
Looking ahead, further research efforts are needed to address certain challenges in cell cycle prediction from single-cell RNA-seq data. One critical aspect is the difficulty of finding an optimal reference embedding or a comprehensive list of marker genes that can be widely applicable across various datasets. As each dataset may have unique characteristics, developing a more powerful and widely applicable method for predicting cell cycle phases would significantly enhance the accuracy and utility of such analyses in a broader context.
Moreover, future studies could explore the combination of multiple prediction methods to leverage their respective strengths and overcome their limitations. Integrating diverse approaches may lead to more robust and accurate cell cycle phase predictions, especially for datasets with complex and heterogeneous cell populations.
In summary, advancing the accuracy and generalizability of cell cycle prediction methods remains an important area of research in the field of single-cell RNA-seq analysis. By addressing the current limitations and challenges, researchers can uncover deeper insights into cellular dynamics and improve the interpretation of scRNA-seq data, enabling more accurate downstream analyses and enhancing our understanding of complex biological processes.
Key Points
Four commonly used methods for identifying cell cycle phases from single-cell RNA-seq data were evaluated in this study.
The transfer learning approach such as Tricycle showed promising performance, especially when a suitable reference embedding was utilized.
The marker gene enrichment approach can yield accurate results if the selected marker gene list is well suited to the dataset, emphasizing the significance of careful marker gene selection, normalization and filtering steps in the analysis pipeline.
Integrating benchmarking data with multiple known cell cycle phases into new datasets can significantly enhance prediction accuracy.
Researchers should carefully evaluate the accuracy of different cell cycle prediction methods and select the one that best suits their specific datasets.
Supplementary Material
Author Biographies
Xinyu Guo is a PhD student in the Department of Quantitative and Computational Biology at the University of Southern California.
Liang Chen is a professor in the Department of Quantitative and Computational Biology at the University of Southern California.
Contributor Information
Xinyu Guo, Department of Quantitative and Computational Biology, University of Southern California, 1050 Childs Way, Los Angeles, CA 90089, United States.
Liang Chen, Department of Quantitative and Computational Biology, University of Southern California, 1050 Childs Way, Los Angeles, CA 90089, United States.
FUNDING
This work was supported by the National Institutes of Health (R01GM137428, R01NS104041 and R01NS125276 to L.C.).
DATA AVAILABILITY
Details about the public data we used have been incorporated in the article. No additional data have been generated for this study.
References
- 1. Evan GI, Vousden KH. Proliferation, cell cycle and apoptosis in cancer. Nature 2001;411:342–8. [DOI] [PubMed] [Google Scholar]
- 2. Liu J, Peng Y, Wei W. Cell cycle on the crossroad of tumorigenesis and cancer therapy. Trends Cell Biol 2022;32:30–44. [DOI] [PMC free article] [PubMed] [Google Scholar]
- 3. Budirahardja Y, Gönczy P. Coupling the cell cycle to development. Dev Camb Engl 2009;136:2861–72. [DOI] [PubMed] [Google Scholar]
- 4. Heber-Katz E, Zhang Y, Bedelbaeva K, et al. Cell cycle regulation and regeneration. Curr Top Microbiol Immunol 2013;367:253–76. [DOI] [PubMed] [Google Scholar]
- 5. Hussain W, Rasool N, Khan YD. A sequence-based predictor of Zika virus proteins developed by integration of PseAAC and statistical moments. Comb Chem High Throughput Screen 2020;23:797–804. [DOI] [PubMed] [Google Scholar]
- 6. Naseer S, Ali RF, Khan YD, et al. iGluK-deep: computational identification of lysine glutarylation sites using deep neural networks with general pseudo amino acid compositions. J Biomol Struct Dyn 2022;40:11691–704. [DOI] [PubMed] [Google Scholar]
- 7. Eberwine J, Sul J-Y, Bartfai T, et al. The promise of single-cell sequencing. Nat Methods 2014;11:25–7. [DOI] [PubMed] [Google Scholar]
- 8. Chervov A, Zinovyev A. Computational challenges of cell cycle analysis using single cell transcriptomics. arXiv:2208.05229.
- 9. Riba A, Oravecz A, Durik M, et al. Cell cycle gene regulation dynamics revealed by RNA velocity and deep-learning. Nat Commun 2022;13:2865. [DOI] [PMC free article] [PubMed] [Google Scholar]
- 10. Schwabe D, Formichetti S, Junker JP, et al. The transcriptome dynamics of single cells during the cell cycle. Mol Syst Biol 2020;16:e9946. [DOI] [PMC free article] [PubMed] [Google Scholar]
- 11. McDavid A, Finak G, Gottardo R. The contribution of cell cycle to heterogeneity in single-cell RNA-seq data. Nat Biotechnol 2016;34:591–3. [DOI] [PMC free article] [PubMed] [Google Scholar]
- 12. Haque A, Engel J, Teichmann SA, et al. A practical guide to single-cell RNA-sequencing for biomedical research and clinical applications. Genome Med 2017;9:75. [DOI] [PMC free article] [PubMed] [Google Scholar]
- 13. Dries R, Chen J, del RossiN, et al. Advances in spatial transcriptomic data analysis. Genome Res 2021;31:1706–18. [DOI] [PMC free article] [PubMed] [Google Scholar]
- 14. Longo SK, Guo MG, Ji AL, et al. Integrating single-cell and spatial transcriptomics to elucidate intercellular tissue dynamics. Nat Rev Genet 2021;22:627–44. [DOI] [PMC free article] [PubMed] [Google Scholar]
- 15. Vandereyken K, Sifrim A, Thienpont B, et al. Methods and applications for single-cell and spatial multi-omics. Nat Rev Genet 2023;24:494–515. [DOI] [PMC free article] [PubMed] [Google Scholar]
- 16. Barron M, Li J. Identifying and removing the cell-cycle effect from single-cell RNA-sequencing data. Sci Rep 2016;6:33892. [DOI] [PMC free article] [PubMed] [Google Scholar]
- 17. Buettner F, Natarajan KN, Casale FP, et al. Computational analysis of cell-to-cell heterogeneity in single-cell RNA-sequencing data reveals hidden subpopulations of cells. Nat Biotechnol 2015;33:155–60. [DOI] [PubMed] [Google Scholar]
- 18. Leng N, Chu L-F, Barry C, et al. Oscope identifies oscillatory genes in unsynchronized single-cell RNA-seq experiments. Nat Methods 2015;12:947–50. [DOI] [PMC free article] [PubMed] [Google Scholar]
- 19. Scialdone A, Natarajan KN, Saraiva LR, et al. Computational assignment of cell-cycle stage from single-cell transcriptome data. Methods San Diego Calif 2015;85:54–61. [DOI] [PubMed] [Google Scholar]
- 20. Buettner F, Pratanwanich N, McCarthy DJ, et al. F-scLVM: scalable and versatile factor analysis for single-cell RNA-seq. Genome Biol 2017;18:212. [DOI] [PMC free article] [PubMed] [Google Scholar]
- 21. Tan YK, Zhang X, Chen J. cycleX: multi-dimensional pseudotime reveals cell cycle and differentiation relationship of dendritic cell progenitors. bioRxiv:222372.
- 22. Liu Z, Lou H, Xie K, et al. Reconstructing cell cycle pseudo time-series via single-cell transcriptome data. Nat Commun 2017;8:22. [DOI] [PMC free article] [PubMed] [Google Scholar]
- 23. Yurovsky A, Futcher B, Skiena S. Pre-Phaser: precise cell-cycle phase detector for scRNA-seq. Proc. 10th ACM Int. Conf. Bioinforma. Comput. Biol. Health. Inform 2019;376–82. [Google Scholar]
- 24. Liu J, Yang M, Zhao W, et al. CCPE: cell cycle pseudotime estimation for single cell RNA-seq data. Nucleic Acids Res 2022;50:704–16. [DOI] [PMC free article] [PubMed] [Google Scholar]
- 25. Liang S, Wang F, Han J, et al. Latent periodic process inference from single-cell RNA-seq data. Nat Commun 2020;11:1441. [DOI] [PMC free article] [PubMed] [Google Scholar]
- 26. Feldman HM, Toledo CM, Arora S, et al. Neural G0: a quiescent-like state found in neuroepithelial-derived cells and glioma. Mol Syst Biol 2021;17(6):e9522. [DOI] [PMC free article] [PubMed] [Google Scholar]
- 27. Hsiao CJ, Tung P, Blischak JD, et al. Characterizing and inferring quantitative cell cycle phase in single-cell RNA-seq data analysis. Genome Res 2020;30:611–21. [DOI] [PMC free article] [PubMed] [Google Scholar]
- 28. Zheng SC, Stein-O’Brien G, Augustin JJ, et al. Universal prediction of cell-cycle position using transfer learning. Genome Biol 2022;23:41. [DOI] [PMC free article] [PubMed] [Google Scholar]
- 29. Butler A, Hoffman P, Smibert P, et al. Integrating single-cell transcriptomic data across different conditions, technologies, and species. Nat Biotechnol 2018;36:411–20. [DOI] [PMC free article] [PubMed] [Google Scholar]
- 30. Moussa M, Măndoiu II. Computational cell cycle analysis of single cell RNA-Seq data. Computational Advances in Bio and Medical Sciences: 10th International Conference, ICCABS 2020, Virtual Even, December 10-12, 2020, Revised Selected Papers; 71–87.
- 31. Sasagawa Y, Nikaido I, Hayashi T, et al. Quartz-Seq: a highly reproducible and sensitive single-cell RNA sequencing method, reveals non-genetic gene-expression heterogeneity. Genome Biol 2013;14:3097. [DOI] [PMC free article] [PubMed] [Google Scholar]
- 32. Krenning L, Sonneveld S, Tanenbaum ME. Time-resolved single-cell sequencing identifies multiple waves of mRNA decay during the mitosis-to-G1 phase transition. Elife 2022;11:e71356. [DOI] [PMC free article] [PubMed] [Google Scholar]
Associated Data
This section collects any data citations, data availability statements, or supplementary materials included in this article.
Supplementary Materials
Data Availability Statement
Details about the public data we used have been incorporated in the article. No additional data have been generated for this study.


