

Abstract
Visualization and visual analytic tools amplify one’s perception of data, facilitating deeper and faster insights that can improve decision making. For multidimensional data sets, one of the most common approaches of visualization methods is to map the data into lower dimensions. Scatterplot matrices (SPLOM) are often used to visualize bivariate relationships between combinations of variables in a multidimensional dataset. However, the number of scatterplots increases quadratically with respect to the number of variables. For high dimensional data, the corresponding enormous number of scatterplots makes data exploration overwhelmingly complex, thereby hindering the usefulness of SPLOM in human decision making processes. One approach to address this difficulty utilizes Graph-theoretic Scatterplot Diagnostic (Scagnostics) to automatically extract a subset of scatterplots with salient features and of manageable size with the hope that the data will be sufficient for improving human decisions. In this paper, we use Electroencephalogram (EEG) to observe brain activity while participants make decisions informed by scatterplots created using different visual measures. We focused on 4 categories of Scagnostics measures: Clumpy, Monotonic, Striated, and Stringy. Our findings demonstrate that by adjusting the level of difficulty in discriminating between data sets based on the Scagnostics measures, different parts of the brain are activated: easier visual discrimination choices involve brain activity mostly in visual sensory cortices located in the occipital lobe, while more difficult discrimination choices tend to recruit more parietal and frontal regions as they are known to be involved in resolving ambiguities. Our results imply that patterns of neural activity are predictive markers of which specific Scagnostics measures most assist human decision making based on visual stimuli such as ours.
Keywords: Multidimensional data visualization, Scagnostic measures, EEG, ERP, Cognition, Brain activities, Scatterplot features
Introduction
In an era of big data, visualization and visual analytic tools amplify one’s perception of dense information, allowing deeper and faster insights that can facilitate decision making. For multidimensional data sets, one of the most common approaches for visualization is to map the data into a lower number of dimensions. Scatterplot matrices (SPLOMs) are widely used for exploring multidimensional data by reducing the data into a series of 2D scatterplots. Since human perception plays an important role in data visualization, many measures have been proposed to quantify scatterplots in terms of: visual separation of clustered points [1–4], the overall shape of the data [5], or the correlation of dimensions [6].
Other studies investigate low-level visual patterns by measuring features that are barely noticeable [7, 8]. Using an eye-tracking system, Etemadpour et al. [9] showed that many human perceptual decisions based on scatterplots can be modeled by Gestalt laws [10]. They have shown that the density of clusters are more dominant in decision-making than the size and shape of clusters. However, Rensink found that judgments of scatterplots are less influenced by the shape of the dot cloud, and more by the shape of the underlying probability distribution [11].
Matute et al. [12] introduced a skeleton-based descriptor as a similarity measure that captures the shape and orientation of scatterplots. A Bayesian estimation that refines the perceptual model based on individual differences by Kay and Heer [13] showed that these scatterplots offer both high precision and low individual variation. Still, further work needs to be done to increase human interpretability while minimizing individual variation.
Scatterplot diagnostics (Scagnostics) are based on graph-theoretic metrics that categorize important features of scatterplots into nine main categories: outlying, skewed, clumpy, striated, sparse, convex, skinny, stringy, and monotonic. These characteristics were proposed by Wilkinson et al. [5] to find potentially interesting plots in order to assist users in easier decision-making. However, many of the defined measures are often far from optimal in capturing patterns in data compared to human perception during visual analysis [14, 15].
Because scatterplots are used as an abstract representation of complex data that conveys condensed information in a limited space, they may cause information loss, overlapping, collusion, distortions, etc., leading to multiple interpretations and perceptual ambiguity. Perceptual decisions in these situations may be predicted from brain activation patterns in sensory and object processing brain regions. Fluctuations in neural noise have been discussed as a key factor in determining choice outcomes when people face perceptual ambiguity [16–18]. These studies have shown that attenuation of internal decision-related signals occurs when people are facing difficult, perceptually ambiguous, choices. In this paper we employ electroencephalogram (EEG) to observe brain activity during visual analysis of Scagnostic distributions of scatterplots. The results of this paper generate empirical evidence concerning how to improve visual measures that quantify scatterplots in visual analytic systems. The results of this study show the impact of different visual measures on human cognition when they make decisions looking at scatterplots during visual analysis tasks. If an scatterplot contains a best visual measures such as high probability (explained in Section 3) of stringy does not necessarily mean that it can convey the best visual cognition or visual perception. Some measures such as high monotonic in scatterplots are much perceivable compared to others. Perceivable refers to the degree to which participants can visually discern or recognize specific characteristics associated with Scagnostics measures in scatterplots. Our results offer interesting insight on the use of visual measures for dimension reduction layouts in data visualization tasks and provide a departing point for further systematic investigations.
Background
Usually, scatterplots are useful for interpreting trends in statistical data. However, subspace analysis methods are used to deal with the “Curse of Dimensionality". This means that a set of few dimensions will be examined instead of the whole high dimensional space. This method leads to cluster identification and detection of a set of relevant dimensions for each cluster [19]. This refers to the challenges and limitations associated with high-dimensional data analysis, such as increased computational complexity, sparsity of data, and difficulty in visualization and interpretation. Although our study did not specifically address the curse of dimensionality, it is an important factor to consider when interpreting the practical implications of our findings and their application to real-world scenarios.
Since the choice of subspace clustering method can lead to different interpretations, visualization tools are developed to help understand the subspace clustering [20]. Subspace clustering techniques aim to identify clusters within specific subspaces or subsets of features within high-dimensional data [21].
The curse of dimensionality presents significant challenges in high-dimensional data analysis, where traditional visualization techniques are limited, and data sparsity becomes a prevalent issue. However, subspace clustering techniques provide a potential solution by identifying clusters within specific subspaces or feature subsets, enabling a more focused and effective analysis of complex datasets. Gaining a deeper understanding of the interplay between scatterplots, subspace clustering, and the curse of dimensionality can yield valuable insights into the feasibility and practicality of applying visualization methods in exploring high-dimensional data. Moreover, it can inform the development of novel approaches that leverage the benefits of subspace clustering to mitigate the adverse effects of the curse of dimensionality, thereby enhancing the interpretability and usability of scatterplot-based visualizations. By exploring this relationship, our research aims to contribute to a more comprehensive understanding of the challenges and opportunities associated with visualizing high-dimensional data using scatterplots.
ScagExplorer has been developed in order to automatize the search for good quality visualizations to recommend to users [22] based on Scagnostics measures. This Scagnostics technique focuses on identifying patterns in scatterplots, such as clusters [23]. Shao et al. [24] is one example among several studies that have utilized numerical methods for selecting optimal scatterplots. In their work, they developed a visual-interactive regression analysis system for scatterplot data, introducing a novel regression lens concept. This lens enables users to explore both global and local regression modeling, interactively selecting data subsets and receiving visual feedback on candidate model quality. The system also provides user guidance by suggesting appropriate models and data subsets based on regression quality scores. Through their study, Shao et al. demonstrate the effectiveness of the regression lens in facilitating user-driven regression modeling and enhancing model understanding.
However, numerical measures do not always agree with human perception [15, 25]. Pandey et al. [26] showed that Scagnostics measures are not able to reliably reproduce the groupings generated by observers. However, quantitative evaluations done by other scientists show that local density-based measures, including Clumpy, in Scagnostics outperform other measures [24, 27, 28]. These studies demonstrated that edge orientation and density features exhibit higher discriminatory power in accurately characterizing scatter plot shapes compared to alternative measures.
Lehmann et al. [29] showed Monotonic, Stringy, and Striated data have the best relation to human perception. Results from previous research sometimes contradict each other and motivated us to investigate the relation between Scagnostics measures and human decision making by employing EEG to record the electrical activity generated by the brain. As explained above, different subspace clustering methods can lead to different interpretations. Moreover, Wang et al. [30] showed viewing images that have many possible interpretations required recruiting additional higher-order brain regions which dramatically increased top-down and bottom-up influences in the brain. Utilizing EEG, we can characterize the spatiotemporal brain activity during people’s perceptual decision making process when presented with different scatterplots that are quantified by Scagnostics measures. Previous studies showed that decision-making of subjective and difficult, perceptually ambiguous, choices (i.e. an image with different interpretations/high ambiguity) requires additional higher-order brain regions besides visual sensory [16]. When stimuli provided discriminative information or ambiguity, choice outcomes could be predicted by neural activity preceding the stimulus. Cognitive studies showed the interaction between highly categorical (more abstract) salient and weakly perceptual (more concrete) salient information activated similar frontoparietal brain networks, but no differential activity was seen within frontal regions [31]. The high discriminability could be predicted from regions in ventral visual cortex, namely the lateral-occipital complex (LOC) and medial temporal cortex [32]. Also, the parieto-occipital brain area encodes choice-information for the highest discriminated situation [17]. It was found that the choices in the guessing situation could only be predicted from activity patterns in the medial posterior parietal cortex (PPC), a region located in the precuneus, and lateral parts of the posterior parietal lobe [32]. Moreover, the PPC is involved in perceptual decision making, object recognition, and stimulus detection tasks [33].
Some studies like [34] suggests that PPC is also involved in coordinate transformations that integrates multi-sensory inputs and provide information about coordination of different saccadic targets represented in different reference frames for motor intention and planning, such as eye centered, head centered, and body centered frames.
Roitman et al. [35] showed that PPC is a critical component in numerical cognition. Behavioral studies showed that numerosity judgement follow Weber’s law [36] that differentiate the number presented in stimuli based on some features such as surface area or density [37]. However, for more precision and quantity that represents the magnitude and cardinal value, neurons within PPC are involved.
According to Sato et al. [38], the difficulty of a task in the presence of the target and the distractor is dictated by the contrast, which reflects the salience of the target with respect to that of distractors. High contrast corresponds to low target-distractor similarity resulting in discrimination of the target from the distractor that defines an easy task, while low contrast corresponds to high target-distractor similarity resulting in a difficult task to discriminate the target from the distractors. Previous studies have shown that the brain activation in response to difficult tasks increased [39].
Considering this background knowledge about human neural information processing, we expect that difficult tasks, i.e. those with less distinguishable features in the scatterplots, will be associated with higher brain activation in general. More specifically, in our experiment, we explored the following research questions:
Q1: Do different Scagnostics measures, i.e. “Clumpy, Monotonic, Stringy, and Striated," have different effects on brain activity?
Q2: Do easily distinguishable features in scatterplots invoke mainly primary visual activity detected in more posterior brain sites, while extremely difficult to discern patterns result in additional recruitment of other brain regions, generally towards the frontal lobe?
Q3: Does the amplitude of brain activity increase as the visual processing tasks become more difficult?
Methods
In Chapter 3 of this thesis, we focus on crucial aspects including datasets (Section 3.1), Scagnostic measures (Section 3.2), design study (Section 3.3), and EEG acquisition (Section 3.4).
Datasets
To construct scatter plots, we used an R Package, “Scagnostics," developed by Wilkinson [40]. The package returns a vector or a matrix consisting of Scagnostics (rows) by variable pairs (columns). We have three different sets of data:
SATdata: A data set that contains SAT and Subject Test scores leading to 6 dimensions and 500 data points.
Math_test: A data set that contains information about students score in Mathematics in different years and different levels. The data includes both categorical and quantitative dimensions, and we have chosen 12 dimensions for generating scatterplots.
Merged: This is a synthetic dataset that was generated from randomly merged datasets. The data contain 2742 data points with 77 dimensions.
According to Netzel et al. [41], increasing the number of dimensions has significant effects on people’s performance. An increase in the number of scatterplots leads to an increase in cognitive load as participants need to inspect sub-diagrams more thoroughly when distance deviation is decreased. Also, the scatterplots from datasets with lower dimensionality are sensitive to the choice of the feature space [15]. Hence, for this EEG study, we generated scatterplots using different datasets that include low, medium, and high number of dimensions. Regarding the use of R libraries to generate the scatterplots, it is important to clarify that the specific consideration of opacity and point size was beyond the scope of our research objectives.
Scatterplots and Scagnostics Measures
We selected four measures to characterize 2d scatterplots. Based on previous studies [24, 27, 28], local density-based measures showed good performance. Therefore, we selected “Clumpy" and “Striated" measures within this category. We also selected “Monotonic" measures. These measures relate to the trend in scatterplots based on Spearman’s correlation coefficient [5]. The fourth measure we chose is “Stringy". Data is “Stringy" if thin shapes occur among the data point clouds. “Monotonic" and “Stringy" are shown to agree strongest with human judgement and calculated Scagnostics measures [29, 42].
For the EEG study, each scatterplot is a stimulus. To manipulate the amount of sensory evidence, we varied the scatterplot’s Scagnostics measures “Clumpy", “Striated", “Monotonic" and “Stringy" measures into three different levels (high, mid and low probabilities of Scagnostics measures). Details regarding these categories are discussed in Section 3.3. In total, we generated 203 scatterplots using the different datasets and categories.
As mentioned above to compute scagnostics “scatterplot diagnostics", R package is used that calculates graph theoretic scagnostics that are summaries of high-dimensional scattered point data that was initially presented as an idea by Paul Tukey in 1989 for characterizing scatterplots [23]. To follow Tukeys’ nonparametric shape descriptors, Wilkinson implemented the original Tukey’s idea through scagnostics measures defined on planar proximity graphs [5] which depend on proximity graphs that are all subsets of the Delaunay triangulation like the minimum spanning tree (MST), the alpha complex [43], and the convex hull [44]. In particular, in this paper scatterplots with a low score on the associated scagnostic are interchangeably referred as low probability and the scatterplots with a high score on the associated scagnostic are called high probability. The implementation of scagnostics are described in detail in [45].
Study Design
A pretest was conducted to categorize the scatterplots into three different categories of Scagnostics measures. Similar to [46], we used the judgement of two independent coders to classify the scatterplots into three different categories of high, mid, and low probabilities of Scagnostics measures: 1) Low: Stimulus levels corresponding to low probability of discerning pattern; 2) Mid: “guessing situation"; 3) High: high probability of discerning pattern (Fig. 1). The coders had extensive knowledge on the definitions and interpretation of each measure to ensure consistency in their assessments. Intercoder agreement was measured using percentage agreement, providing a quantitative measure of agreement between the coders. In instances where disagreements arose regarding the probability categorization (high, mid, low) of specific Scagnostics measures for certain scatterplots, the coders engaged in collaborative discussions. Through careful examination of the scatterplots, review of Scagnostics values, and consideration of visual patterns, the coders reached a consensus on the appropriate categorization. These collaborative efforts ensured that any discrepancies were addressed and resolved in a rigorous manner.
Fig. 1.
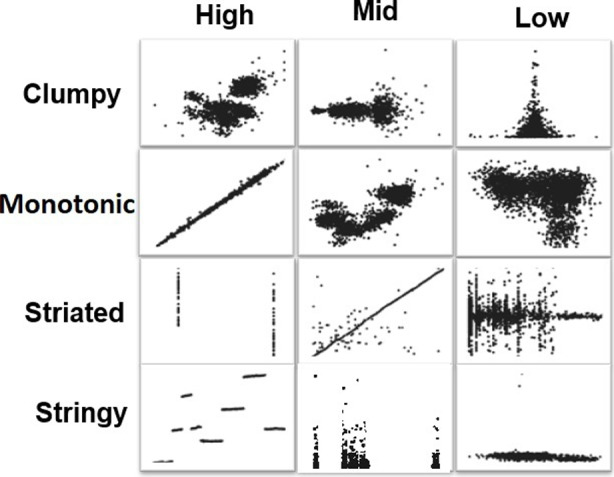
Sample of scatterplots with different probabilities of Scagnostics measures
We recruited 12 participants (5 females) for the study with the average age of 23.3 years old, standard deviation of 4.16 and standard error of 1.20. All participants reported normal or corrected-to-normal vision with no color vision deficiencies. All participants had prior experience in performing data analysis with scatter plots. Before starting the real experiment, in order to explain the concept of Scagnostics measures, we showed participants visual examples and a document that includes Scagnostics diagram [22]. One of the co-authors also provided a short, 5 minute, explanation of the user tasks and expectations. We gave them a word-wise definition and simple description of the Scagnostics measures similar to [42]:
Clumpy: Degree that points are gathered in condense area
Monotonic: Degree that plot only increases or decreases and is densest along that path
Striated: Degree that points align into a low frequency wave with parallel lines
Stringy: Degree that points align to a concise wave that the points are connected to others
Here, we only wanted to obtain participants’ judgements about scatterplots based on their visual perception rather than their previous knowledge of Scagnostics. Previous studies [47, 48] showed that the activities in the visual system can be decoded from the visually induced EEG responses. This motivated us to just ask users to passively look at the scatterplot images and perceive the information visually and later we decoded the evoked responses.
Figure 2 shows the paradigm used to decode the participants’ performance and categorize the scatterplots based on brain activity. A series of images were shown to the participants. The images were divided into four different trials with trial 1 (Clumpy) containing 59 scatterplots, trial 2 (Monotonic) containing 74 scatterplots, trial 3 (Striated) containing 31 scatterplots and trial 4 (Stringy) containing 39 scatterplots. In each trial, the scatterplots Scagnostics measures changed randomly. The number of scatterplots that are shown in each trial is fixed but the sequence of showing them to the participants was randomized. The participants had to answer binary questions (yes/no) to themselves without speaking out loud. For example in the first trial, participants were asked to indicate whether the observed stimulus is “Clumpy" or not. Each stimulus was presented for approximately 1 second with 3 seconds resting time between trials.
Fig. 2.

Scatterplot categorization pipeline based on EEG evoked potential. A series of scatterplots are shown to the participants in four different trials for Clumpy, Monotonic, Striated, and Stringy. There is a 3 second resting time between different trials. In each trial, a series of scatterplots are shown where their Scagnostics measures are changed randomly. The tasks are binary and the individuals answer to the tasks without speaking out loud answering to themselves
EEG Acquisition and Analysis
Scalp electroencephalogram (EEG) data were collected with a 32 channel cap placed on the scalp using Brain Vision’s BrainAmp MR system, (Brain Products GmbH, Gilching, Germany) and Brain Product DC Amplifier (Brain Vision, NC, USA) at a sampling frequency of 500 Hz and 24 bits per sample. Data were transmitted to a computer and stored using Brain Vision’s Recorder software.
EEG data were then analyzed using Python’s MNE library [49]. Electrode layout is shown in Fig. 3. First, the signal was bandpass filtered between 8 and 40Hz. Next, data were downsampled to 125 Hz and a notch filter was applied to remove power line artifacts that occur at 60Hz and higher harmonics. Data were further filtered using a temporal Independent Components Analysis (ICA) that removes artifacts by zeroing out the related independent components before inverse transform of the latent sources back into the measurement space [50]. To ensure the appropriateness of applying ICA, we conducted thorough data analysis and testing using Shapiro-Wilk Test [51] in R before employing the MNE-Python library for ICA implementation. Through our rigorous analysis, we confirmed that the EEG data exhibited non-Gaussian properties, including skewed distributions, heavy tails, and sparsity. These non-Gaussian characteristics are commonly observed in EEG signals due to the intricate and dynamic nature of brain activity. Therefore, the assumption of non-Gaussianity aligns well with the underlying physiological processes we aim to capture and analyze.
Fig. 3.

Electrode layout. The electrical activity of the heartbeat (ECG) is used for filtering movement data. The dark red hotspot area indicates the approximate location of activity in the visual cortex projected to the scalp. Red: positive potential amplitudes, blue: negative potential amplitudes
Data from the 12 subjects (5 females) were averaged and separated into 12 epochs corresponding to the 12 different types of stimuli presented to the subject (i.e. visualisations of: clumpy, monotonic, striated, and stringy datasets of varying difficulty in discriminating subsets–low, mid, and high).
Based on previous studies [52], there is a strong link between eye-movement and salient part of a visual scene. Therefore employing an eye-tracking study, we [9] demonstrated a link between eye-movement on scatterplots and individual decision-making during visual analysis. We showed the perceptual decisions on scatterplots can be adapted from Gestalt laws [53]. Hence, co-registration of eyetracking and EEG tools can provide complementary information that can be used for predicting poor visual analysis behaviors. However, in this paper we transfer the insight obtained from our eyetracking study to investigate the decision-making process utilizing EEG in order to examine how certain layouts produce certain characteristics that change the brain activities.
Results
In order to investigate the impact of epoch duration on the analysis of Event-Related Potentials (ERPs) and their relationship with Scagnostics measures, we explored Q1: Epochs and ERPs that is explained in Section 4.1. In order to explore the impact of varying levels of Scagnostic measures on visual perception and cognitive processing, we investigated Q2: Different Levels of Scagnostic Measure. We categorized the scatterplots into low, medium, and high levels for each Scagnostic measure (Clumpy, Monotonic, Striated, and Stringy) based on predefined thresholds that is explained in Section 4.2. To investigate the influence of task difficulty on participants’ perception and brain responses, we explored Q3: Task Difficulty. We systematically manipulated the complexity of the categorization task by presenting scatterplots with varying levels of difficulty, based on the Scagnostic measures (Clumpy, Monotonic, Striated, and Stringy) that is explained in Section 4.3.
Exploring Q1: Epochs and ERPs for 4 Scagnostics Measures
We analyzed equal-duration chunks of the EEG signal as Epoch objects. Each Epoch corresponded to a 600-1000 ms segment of data occurring after each trial. In our case, an experimental trial is a scatterplot stimulus.
Data From the Averaged ERPs Across All Subjects and All Levels of Scagnostics Measures
Figure 4 shows the time course and the amplitude spectra of the total neural signal measured at all electrodes and averaged across 12 subjects. Panels A-D contain stacked time courses of all epochs for each type of scatterplot: clumpy, monotonic, striated, and stringy.
Fig. 4.
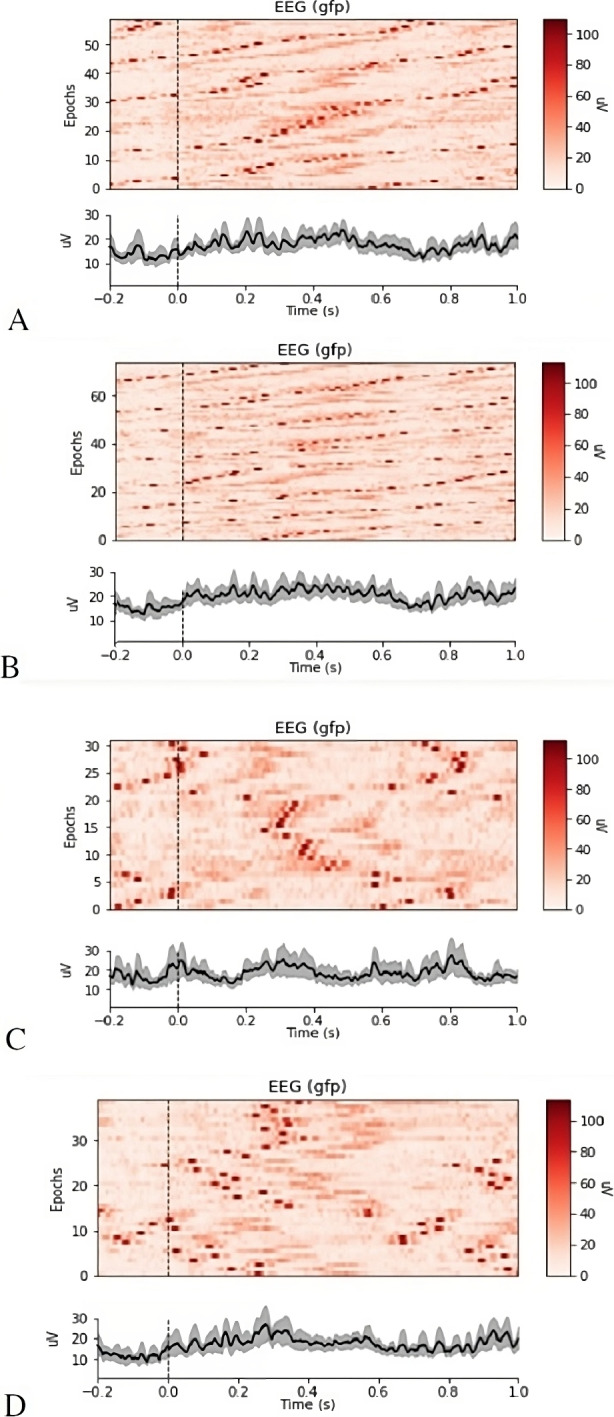
ERPs averaged across electrodes and participants, (A–D) show neuronal signals 200 ms before, and 1000ms after, the presentation (vertical dotted line) of each type of scatterplot: clumpy, monotonic, striated, and stringy. Each panel illustrates the data from all epochs (top) and the average across epochs (bottom)
As shown in Fig. 4, the different categories of Scagnostics measures trigger changes in neural processing at different times.
Our main emphasis is on Event Related Potentials (ERPs). Scalp topography visualizations in Fig. 5 demonstrate the different spatial patterns of activation onset and frequencies of the evoked responses for each Scagnostics measure:
Clumpy: Strong activity occurs between 450 and 600 ms in visual cortex including occipital, parietal, PPC and TP.
Monotonic: Strong negative activity between 280 and 400 ms in visual cortex are preceded by positive activation between 240 and 300 ms in parts of the parietal and temporal lobes.
Striated: Occipital and parietal-occipital are activated at 60 ms. Some strong activity is also observed in fronto-parietal areas.
Stringy: Occipital and parietal-occipital are activated at 240 ms. Similar to Striated, fronto-parietal is activated also.
Furthermore, the brain activity patterns during Striated and Stringy scatterplot stimuli are more similar to one another compared to Clumpy and Monotonic. During Clumpy scatterplot trials, occipital and parietal-occipital are strongly active closer to the end of the Epochs while for Monotonic stimuli, the occipital regions are more active in the middle of the Epochs.
Fig. 5.

Topography visualization of evoked response potentials (ERP) for: (A) Clumpy scatterplots; (B) Monotonic scatterplots; (C) Striated scatterplots; (D) Stringy scatterplots; Neural signals of participant, measured at all electrodes and averaged over all scatterplots and trials at different Scagnostics measures. Top row: The ERP every 0.06 seconds; Bottom row: the average EEG signal change and ERP shows the top three strongest activations at the shown time courses
ERPs Analysis at Different Levels of Scagnostics Measures
High Probability of Scagnostics Measures
The top three activated ERPs for High-Scagnostic measures of Clumpy stimuli (Fig. 6A) show a late positive topography in occipital and the posterior parietal cortex (PPC) for High-Clumpy trials while exhibiting a negative polarity around N200 in PPC for High-Monotonic. There is a consistently early negative polarity N200 (180-325 ms [54]) and N300 (125-300 ms [55]) in frontal and prefrontal cortex for both High-Stringy and High-Striated with the highest amplitude in High-Striated. These brain regions are implicated with complex behaviors, for example in the encoding of stimulus in working memory [56].
Fig. 6.
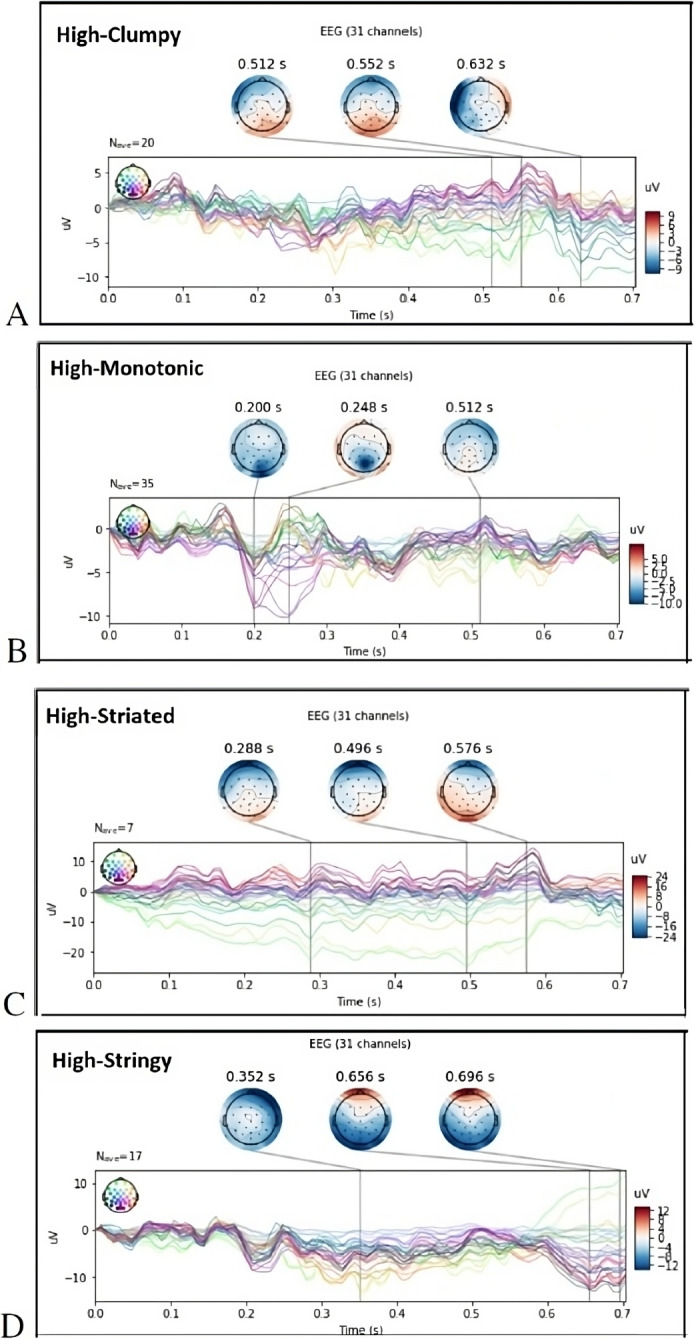
Topography visualization of evoked response potentials (ERP) for high probability of Scagnostics measures. The top three strongest activations based on ERP analyses at the shown time courses: (A) High-Clumpy scatterplots; (B) High-Monotonic scatterplots; (C) High-Striated scatterplots; (D) High-Stringy scatterplots. Neural signals averaged across participants, measured at all electrodes and averaged over all scatterplots and trials at different Scagnostics measures
Studies on the N300 and N400 ERP responses showed that they can uncover processing differences between object and action identification [55, 57]. Furthermore, [58] found that the PPC source activity can be increased with task relevance. Looking at High-Monotonic ERPs (Fig. 6B), we can see that PPC is triggered in N300, which might indicate that participants found higher task relevance (i.e. whether the scatterplot is monotonic or not) when viewing the High-Monotonic stimuli.
In High-Striated and High-Stringy scatterplot stimuli, we see that frontal and pre-frontal areas are triggered, which could be indicative of more attention to the special features of Striated and Stringy stimuli [59, 60].
Mid Probability of Scagnostics Measures
As illustrated in Fig. 7A, the top three activated ERPs for Mid-Clumpy stimuli show N200 and N300 components between 240 and 350 ms post stimulus onset around occipital and the posterior parietal cortex (PPC). The N200 contains at least two sub-components. The P300 (P3) ERP component elicited in the process of decision making peaks at P300 up to 900 ms post stimulus [61].
Fig. 7.
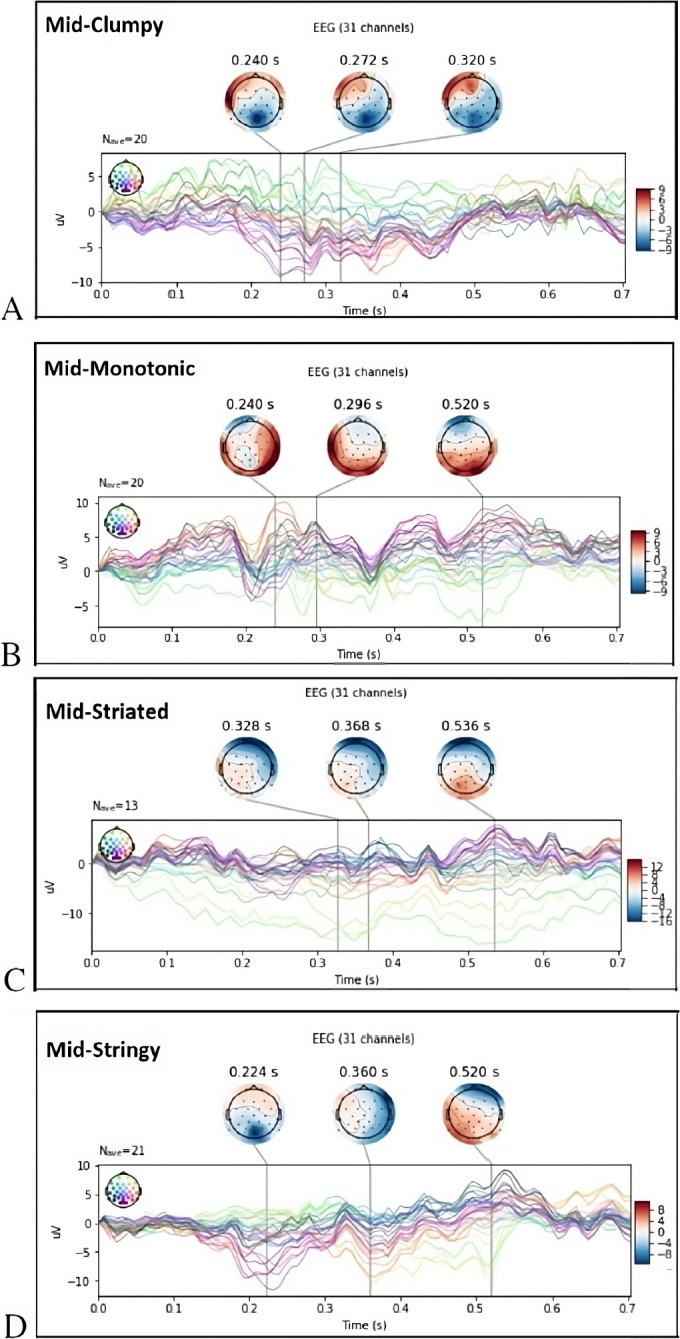
Topography visualization of evoked response potentials (ERP) for mid probability of Scagnostics measures. The top three strongest activations based on ERP analyses at the shown time courses: (A) Clumpy scatterplots; (B) Monotonic scatterplots; (C) Striated scatterplots; (D) Stringy scatterplots. Neural signals averaged across participants, measured at all electrodes and averaged over all scatterplots and trials at different Scagnostics measures
ERP analysis of Mid-Monotonic (Fig. 7B) shows P3a is generated in temporal-parietal areas and for P3b a right-lateralized activity is generated in PPC areas. In response to Mid-Striated, the N300 is more frontally distributed as illustrated in Fig. 7C. The N400 signal for Mid-Stringy and Mid-Striated peaks around 360 and 368 milliseconds post-stimulus onset. However, N400 activity for Mid-Striated occurs mostly within frontal lobe. For Mid-Stringy stimuli, right temporal and parietal lobes contributed to N400 as well.
Low Probability of Scagnostics Measures
As illustrated in Fig. 8A, the top three ERPs during Low-Clumpy trials show N200 components between 240 and 350 ms post stimulus occurring around frontal and the temporal lobes. The late positive complex (LPC) peaks around 648 ms after stimulus onset at frontal and in left parietal cortices. As shown in Fig. 8B, for Low-Monotonic trials, a late positive ERP occurs in the frontal lobe. A N400 component is seen in parieto-occipital and centroparietal regions. For both Low-Striated and Low-Stringy stimuli, P300 is observed in PPC regions, and for Low-Stringy stimuli, the temporal regions are also triggered (Fig. 8C and D). The higher amplitude of P300 can be associated with a higher load of cognitive process of perception and selective attention [54].
Fig. 8.

Topography visualization of evoked response potentials (ERP) for low probability of Scagnostics measures. The top three strongest activations based on ERP analyses at the shown time courses: (A) Clumpy scatterplots; (B) Monotonic scatterplots; (C) Striated scatterplots; (D) Stringy scatterplots. Neural signals averaged across participants, measured at all electrodes and averaged over all scatterplots and trials at different Scagnostics measures
The ERPs for these four categories show that Scagnostics measures at different levels of probability triggered different parts of the brain at different times. This result answers our question, Q1: Do different Scagnostics measures, i.e. “Clumpy, Monotonic, Stringy, and Striated," have different effects on brain activity?
Exploring Q2: Different Levels of Scagnostic Measures
To address Q2, we constructed topographic plots representing the changes across the whole-scalp over time for all the selected measures on different levels of Scagnostics.
High Probability of Scagnostics Measures
As shown in Fig. 9, a persistent positive or negative deflecting component occurs around 240 milliseconds after stimulus onset reflecting a larger cognitive response in occipital cortex for all 4 categories of Scagnostics measures.
Fig. 9.

Topography visualization of evoked response potentials (ERP) for high probability of Scagnostics measures every 0.08 seconds: (A) Clumpy scatterplots; (B) Monotonic scatterplots; (C) Striated scatterplots; (D) Stringy scatterplots. Neural signals averaged across participants, measured at all electrodes and averaged over all scatterplots and trials at different Scagnostics measures
For N1—negative-going evoked potential between 80 and 120 ms after the onset of a stimulus [62], in High-Striated (Fig. 9C) and High-Stringy (Fig. 9D) scatterplot stimuli, we see that frontal and pre-frontal areas are active with stronger activity for High-Striated scatterplots. The ERPs for these four categories show that even high probability Scagnostics measures do not behave similarly between different measure types and activate different parts of the brain at different times. Here, the N100 component (N160/N170) ERP in frontal cortex for all four types of Scagnostics measures can be related to basic perceptual processing regardless of task demands, as observed by other researchers, including [63]. However, consistently negative polarity for both High-Stringy and High-Striated in frontal and prefrontal regions that are implicated with complex behaviors can be indicative of the encoding of stimulus in working memory [56].
According to [61], the P300 (P3) ERP component elicited in the process of decision making. The amplitude of P300 increases with higher discriminability of the stimulus. P320 appears in PPC during High-Clumpy trials (Fig. 9A). This might indicate early decision making for scatterplots that contain high clumpy features.
Previous studies by [64–66], showed that N3 components may indicate enhanced attention as a response to the important or interesting stimulus. ERPs during High-Monotonic trials shows PPC is triggered in N300 in Fig. 6B. After N300, there is a consistent negative polarity. This indicates that monotonic measures can be used an as an important visual feature in scatterplots and can be easily distinguished.
The C1 component as the earliest response of the primary visual cortex to a stimulus [67] peaks for High-Striated and High-Stringy trials. P1, the first positive going component, is also in occipito-parietal regions for these two Scagnostic measures. While, for High-Clumpy and High-Monotonic, occipital-parietal regions are triggered on average around 160 ms similarly for High-Striated. PPC is more active at N200 for High-Clumpy and High-Monotonic.
As mentioned above, N300 and N400 ERP responses uncover processing differences between stimulus (i.e. scatterplot) and action identification (i.e. whether it is clumpy or not?). As studied by [68], the N400 response is a measure of semantic processing in response to words and pictures. Also, if it occurs in temporal lobe, it may involve object recognition [57]. Figure 9A shows lateralized N300 and N400 ERPs for High-Clumpy stimuli occurring in the temporal lobe. A similar pattern emerges for N320 signal during High-Stringy stimulus (Fig. 9D). Therefore, we can state that highly monotonic and clumpy features of scatterplots are highly recognizable by participants. Monotonic is one of the most important and easily distinguishable features. While, High-Stringy feature contains more complex decision making process, it is still recognizable. Furthermore, we can conclude that as we anticipated in Q2, easily distinguishable features such as what we see in High-Monotonic and High-Clumpy scatterplots are mainly invoking primary visual cortex.
Mid Probability of Scagnostics Measures
According to [69], processing of salient information results in temporal—parietal cortex activation. P300 decodes conscious contributions to the visual encoding of target location that impact frontal lobes [70]. According to [58, 71, 72], P3a and P3b generation that comes from frontal and temporal/parietal activation are different components of P300. P3a is interpreted as reflecting frontal lobe activity and is called the “novelty P300” that has a maximum amplitude over frontal/central electrode sites with a peak latency falling in the range of 250-280 ms, and it is observed with repeated stimulus presentation. Novelty P300 decreases in amplitude appear to be more related to orienting responses (e.g. startle, unexpected stimulus, salient and unanticipated information, etc.) [73, 74]. P3a is observed in Mid-Clumpy. In contrast, P3b potential elicited during target stimulus processing peaked at around 300 ms with greatest amplitude near parietal regions. P3b is observed in PPC and parietal areas for Mid-Monotonic.
Previous studies by [75, 76] showed that for easy tasks, P300 amplitude for the distractor and target was largest over the parietal electrodes, whereas difficult discrimination tasks produced P3a potentials that were similar to novelty P300 (P3a). As shown in Fig. 10B, the PPC source activity is highest in Mid-Monotonic tasks compared to other Mid-Scagnostics. This implies that the salient features in Mid-Monotonic stimuli were more relevant to the task (determining whether each particular scatterplot was easily assignable to a particular Scagnostics measure), and therefore generated a stronger response. Therefore, we conclude that distinguishing monotonic features in Mid-Monotonic tasks was easier than distinguishing clumpy features in Mid-Clumpy tasks. This again confirms [58] observations that the PPC source activity increases with task relevance.
Fig. 10.

Topography visualization of evoked response potentials (ERP) for Mid probability of Scagnostics measures every 0.08 seconds: (A) Clumpy scatterplots; (B) Monotonic scatterplots; (C) Striated scatterplots; (D) Stringy scatterplots. Neural signals averaged across participants, measured at all electrode and averaged over all scatterplots and trials at different Scagnostics measures
The N300 is more frontally distributed as demonstrated in Fig. 10C in response to Mid-Striated stimuli. Having a comparison between Figs. 9C (High-Striated) and 10C (Mid-Striated) in the N300 time window (e.g. at 320 ms), we see right temporal lobe also contributes to the neuronal signal.
A number of studies investigated the cognitive factors that contribute to temporal lobe activation [77, 78]. Some studies have shown that during the object categorizations at more subordinate or superordinate levels, temporal cortex activity increases for concepts that are semantically more-confusing [79]. This shows that Mid-Striated is more confusing compared to High-Striated. A positive peak over posterior areas has been elicited about 520 ms for Mid-Monotonic, 536 ms for Mid-Striated, and 520 ms for Mid-Stringy after stimulus onset, which we believe is related to the late positive component (LPC) that often is attributed to a reevaluation of a response [80].
Enhancement of P200 has been shown to be related to evaluation processes when occurring in frontal brain areas during identification of task-relevant stimuli [81], and to perceptual processing when occurring in posterior occipital brain areas [82]. As shown in Fig. 10D, P200 is triggered in frontal brain regions and can be an index of stimuli evaluation.
According to some studies [83] where a target is defined by conjunctions of color and shape or spatial frequency and orientation, positive frontal brain activity is more sensitive to the demands of the current task to ensure that the participant is able to focus attention on the relevant visual information when the stimulus contains some, but not all, of the target defining features. Similarly, in Mid-Clumpy and Mid-Stringy, positive frontal brain activity may represent the sensitivity of the brain to some parts of the scatterplots that contain task-relevant features.
Low Probability of Scagnostics Measures
The frontoparietal principle role is discussed in space-based, feature-based, object-based and category-based attentional control [60]. Since we investigate the role of low probability Scagnostics measures in identifying features on scatterplots, a conjunction search is involved for the visual search because the features (target) are surrounded by distractors. Therefore, we believe the frontoparietal activation is evoked during low Scagnostics tasks where there is top-down attention to a combination of features defining the target [84].
With respect to frontoparietal regions, taking ERPs into account, Table 1 lists the regions activated when different low Scagnostics measures are observed by participants. The highlighted columns are the top three highest ERP responses that are shown in Fig. 8.
Table 1.
Table of brain regions with signal peaking around different milliseconds after the stimulus that elicits it

The highlighted columns are the top three highest ERP responses that are shown in the temporal analysis of ERPs in Fig. 8
Abstract Terminology: F Frontal, FP Prefrontal, O Occipital; P Parietal, FC between Frontal and Central, PPC Posterior-parietal cortex, FT between Frontal and Temporal, CP between Central and Parietal, TP between Temporal and Parietal
The highest frequency electrical brain activity (highest ERP responses) are considered for scatterplots with low probability of Clumpy, Monotonic, Striated and Stringy features that are shown in Fig. 8
Based on previous studies [84, 85], a target detection for displays with non-singleton or target-absent objects use a higher level of activation throughout all the frontoparietal regions. Here, non-singleton objects refer to target Scagnostics features that are highly embedded in distractor data points.
During clumpy feature detection in Mid-Clumpy scatterplots (non-singleton) shown in Fig. 10A and Low-Clumpy scatterplots (target absent) in Fig. 11A, the prefrontal, frontal, PPC and temporal are triggered when compared to High-Clumpy scatterplots Fig. 9A.
Fig. 11.

Topography visualization of evoked response potentials (ERP) for Low probability of Scagnostics measures every 0.08 seconds: (A) Clumpy scatterplots; (B) Monotonic scatterplots; (C) Striated scatterplots; (D) Stringy scatterplots. Neural signals averaged across participants, measured at all electrodes and averaged over all scatterplots and trials at different Scagnostics measures
According to Table 1, higher-order regions of the brain are triggered including the frontoparietal regions in low Scagnostics measures.
Exploring Q3: Task Difficulty
Figure 12 shows neural signals of participant, measured over all ERP time-lines at all electrodes and averaged over all scatterplots and trials at different Scagnostics measures. As can be seen there is always a positive occipital topography for all Scagnostics measures, while there is negative frontal and prefrontal polarity for all measures that is most pronounced in the High-Monotonic, High-Stringy and High-Striated measures.
Fig. 12.

Topography visualization of evoked response potentials (ERP). For each electrode, data are averaged across participants and separated into 12 different epochs based on Scagnostics measure and level of probability: A High probability, easily discriminable scatterplot features; B Mid probability, perceptually ambiguous scatterplot features, and C Low probability, indistinguishable scatterplot features
The average over all channels for the High-Monotonic stimuli shows positive polarity activity in the occipital lobe coupled with strong negative polarity activity in the parietal and central lobe and PPC. Previous studies showed that amplitude is more negative on posterior sites when a stimuli has an attentional component and contains perceptual goodness such as symmetry, beautiful components, horizontal or vertical edges, structure-preserving transformations, etc [86–88]. This cognitive assessment of goodness is also discussed in the context of evaluative cognition that produces an assessment of value. In this context, compared to other Scagnostic measures, our results from the High and Mid-Monotonic tasks imply that Monotonic measures preserve the perceptually goodness of the overall high dimensional dataset the most. For further information about evaluative and descriptive cognition refer to [89].
According to previous studies [90], more difficult or multiple task demands reduce P300 amplitude and lengthen peak latency. The more response conflict and more difficult tasks also caused a decrease of P300 amplitude of the parietal and occipital areas [91]. Our findings follow a similar trend, as seen in Figs. 9A, 10A, and 11A at time 320 ms, the amplitude of the parietal and occipital areas decreased sequentially from High-Clumpy to Low-Clumpy. This might indicate early decision making for scatterplots that contain High-Clumpy features. The workload state increased by the task difficulty (less-distinguishable clumpy features) and P300 amplitude in Mid-Clumpy was observed in higher-level brain areas.
Figures 9C, 10C, and 11C at time 320 ms show a decrease in amplitude of P300 for Mid-Striated and Low-Striated compared to High-Striated related tasks. The P300 component that is known to reflect neural activity related to attentional and working memory processes [92] can be amplified with a larger P300 amplitude in frontal brain regions during working memory performance that is not necessary related to a more efficient use of neural resources [93]. Again, a comparison between Figs. 10D and 11D show P300 parietal amplitude decreases in Low-Stringy trials, while P300 frontal amplitudes increases ( 35 uV). In general, when the target was distinguishable or larger, P300 was largest over the parietal electrodes. However, for the difficult tasks that the target feature was not distinguishable and the distractor was larger, P300 was more associated with the frontal/central electrodes.
In Fig. 12, for Low-Scagnostic measures, the higher level areas such as frontal, central, and temporal lobes are triggered. Therefore, some late positive ERP occurs in the frontal lobe seen in Low-Monotonic, Low-Stringy, Mid-Clumpy, or Mid-Stringy. As Friederici et al. [94] proposed, this may be indicative of processing difficulty related to revision processes in ambiguous or difficult contexts.
As a post study, to check if the findings above using EEG match the given answers by participants to pattern identification tasks are similar to passively look at the scatterplot images, we have designed a pilot study with 12 participants. In this experiment we have asked the participants to answer binary questions actively by pressing the mouse left or right click button. The same sequence of scatterplots and blocks of questions were used that were randomized. The same amount of time as passive experiment that is explained above is given to the users to response. For instance, after a participant perceived an scatterplot as a monotonic scatterplot, they could click on any button on the mouse and we recorded their response as yes.
We investigated the subjects’ given answers when performing the tasks. When looking into the average responses for Monotonic vs. Clumpy tasks, all scatterplots, and all subjects, no statistically significant difference was observed when comparing the High-Monotonic vs. High-Clumpy. For this comparison, we have used unpaired t-test at the %95 confidence level (M = 0.58, SD = 0.495) than found in the population as a whole, (t = 1.048, df = 624, p = 0.029). This shows that High-Clumpy and High-Monotonic have similar impact on human perception and this conform our results in EEG that showed the same brain activity pattern for these two categories of scatterplots (refer to Section 4.2.1).
However, the comparison between Mid-Clumpy vs. Mid-Monotonic using unpaired t-test showed a significant difference between these two categories (p = 0.0001). Mid-Monotonic had higher mean value (M = 0.32) compared to Mid-Clumpy (M = 0.15). This means that Mid-Monotonic was easier in recognition by subjects in comparison to Mid-Clumpy. This conclusion also conforms our finding in Section 4.2.2 whereas P300 was largest.
In addition, our comparisons between High-Striated and High-Stringy using Two-sample t-test (Welch) showed a significant differences between the mean values (p = 0.0003, df = 132.85). Mean value for High-Striated (M = 0.5) is higher than Mean value for High-Stringy (M = 0.259). However, the effect size d is medium, 0.52. In other words, the magnitude of the difference between the average of High-Striated and the average of High-Stringy is medium. This can conform our findings in Section 4.2.2 that showed High-Stringy feature contains more complex decision making process but still recognizable.
Moreover, the comparison between Mid-Striated and Mid-Stringy using Welch showed a significant difference (p = 1.2e-11, df = 216.95) and the Mean value difference for Mid-Striated (M = 0.55) and Mid-Stringy (M = 0.185) indicates a large magnitude differences between two categories. Again, this shows Mid-Stringy was more complex to be recognized by individuals.
Discussion and Future Directions
In this chapter, we delve into several intriguing topics. Firstly, we explore the influence of individual differences on object recognition, considering factors such as cognitive abilities, prior experience, and visual processing strategies (Section 5.1). Secondly, we investigate the complex interactions between stimuli recognition and the action word, revealing the dynamic interplay between visual processing and semantic activation (Section 5.2). Lastly, we delve into the fascinating phenomenon of feature-based attention activations, uncovering the neural mechanisms underlying selective attention to specific visual features (Section 5.3).
Individual Differences and Object Recognition
The distinctive features of an image that include the most cognitive relevance of the image such as shape structure, contrast, edges, etc., have been studied in sensory-based, object recognition, perceptual research [95]. While more traditional visual object recognition research studies focus on bottom-up processing of visual stimuli, more recent models represent perception as based on principles of prediction error minimization [96–98].
In these models, higher level areas generate prediction and send information to the lower level areas to compare with incoming information. The lower level areas then send the results back to the higher level areas for adjusting the prediction based on the prediction error–which is the difference between the prediction and the input information. This process continues iteratively for both high and low-level predictions. Therefore, the perception and cognition of scatterplots’ feature (i.e. Monotonic, Clumpy, Striated, Stringy) is a more low-level prediction that can be influenced by individuals’ top-down factors, such as “the experience, knowledge and prior expectations in the form of predictions passed to the lower-level brain areas even the primary visual cortex [98]".
As a future study within this context, we will investigate the effects of task demand on the performance of scatterplot feature detection and its effects on brain activation with the aim of improving our understanding of individual differences in visualization-reading ability.
The Interactions Between the Stimuli Recognition and the Action Word
The distribution of the N400 around frontal brain regions is recognized in the context of recognition memory, and is strongly related to concrete words and pictures [99].
The FN400 (N400 around 400 ms distributed in fronto-central) is the brain response related to either familiarity conceptual fluency [100], familiarity [101], or cognitive process during categorization and category-based induction (CBI) [102]. We need to perform further experiments to better understand Scagnostics measures within either of these contexts. N400 arises from a highly distributed brain network that includes higher-level perceptual areas and multi-modal processing and storage areas [103] that can be used to shed light on understanding the cognitive processing of interaction between linguistic and non-linguistic information. Based on our observations in this study, the words Striated and Stringy needed more training and clarifications compared to Clumpy and Monotonic. Based on studies done by [55], objects that evoked incoherent and inconsistent semantic representation to the action verbs showed a more robust N300 response. Although in this project we did not study the effects of Scagnostic words (or action verb) on the recognition of scatterplot features, we see a more robust N300 response to the Striated objects that could be related to semantic inconsistency of the stimuli with Mid level of striated probability with the action verb “Striated." Therefore, in the future we will investigate brain patterns at N300 and N400 more critically to assess working memory associations with stimulus’s (scatterplot) features as related to the performed task containing specific action words.
Feature-Based Attention Activations
In general, brain activation patterns between different Scagnostic measures showed Clumpy and Monotonic are more similar to each other than Striated and Stringy, and it seems that our participants found, on average, that Clumpy and Monotonic representations of the higher dimensional data were much easier to discern patterns from. These are attention-related activation. Recent studies showed that feature-based attention activates frontoparietal regions [59, 60]. According to Fox et al. [104], the neural activation across different areas of the frontoparietal network has a temporal ordering. We plan to continue this area of study in the context of Scagnostics measures in the future.
Limitations
It is crucial to acknowledge the limitations of our study, and therefore, in this section, we aim to address some of them comprehensively. Firstly, while our research focused on examining the relationship between attention-related activation and the perception of scatterplot characteristics, we did not explicitly investigate the direct influence of attention on decision making. Future studies could delve deeper into exploring the intricate connections between attentional processes during scatterplot perception and their impact on decision-making processes across diverse domains such as data analysis, information visualization, and pattern recognition. Moreover, although our findings provide valuable insights into the brain’s response to specific visual patterns, our study did not directly concentrate on enhancing known visual measures within this context. Future research endeavors could explore the practical implications of our study by leveraging the observed brain activity patterns to refine existing visual measures or propose novel ones that align more closely with human perception and cognition. Enriching the applications of our findings can be achieved by incorporating insights from decision-making research and advancements in visual measure development (e.g. [105]).
In terms of the high-dimensional nature of the datasets, it is important to clarify that while the scatterplots presented to participants were two-dimensional, our study incorporated measures to ensure that the underlying datasets retained their high-dimensional structure. By employing data simulation techniques during scatterplot generation, we successfully preserved the desired Scagnostics properties while maintaining the high-dimensional nature of the datasets. This approach enabled us to isolate and examine the effects of Scagnostics measures on participants’ perception, irrespective of the specific underlying data distributions. However, it is important to acknowledge that the study design did not directly address the analysis of high-dimensional datasets. To gain further insights into the relationship between brain activity and the perception of high-dimensional scatterplots, future research can consider integrating techniques such as dimensionality reduction, data projection, or visual analytics.
Although R libraries were utilized for scatterplot generation, our study did not specifically investigate the impact of opacity and point size on participants’ perception or the brain’s response. We acknowledge the significance of these visual attributes in scatterplot interpretation and recognize the need for future research to explore their influence in correlation with Scagnostics measures.
Furthermore, it is important to note that the study involving 12 participants was designed as an initial pilot study, intended to provide preliminary insights into the importance of considering cognition in the evaluation of data visualization. Given the limitations in participant availability and resources, we acknowledge that the sample size is relatively small, and thus, the results should be interpreted with caution. Nevertheless, it is crucial to highlight that this study serves as a foundational stepping stone for further research and underscores the potential impact of cognition on the perception and interpretation of visualizations.
Acknowledgements
The authors would like to thank Prof. Chris Weaver at University of Oklahoma for his initial helpful guidance and encouragement in designing this study about Scagnostic measures. We would like to also thank Dr. Chelsea P Reichert for her support and guides in analyzing the brain data. Finally, we thank students Arezoo Bybordi, Marino Echavarria, Vincent Filardi, Kenneth Ng, Chhewang Sherpa and Yu Xuan Huang at The City College of New York who helped us in implementation, conducting and facilitating the user study.
Author Contributions
Ronak Etemadpour as the first author contributed in conceptualization, designing the study, gaining fund for the project, conducting the study, performing data analysis, data curation, administrating the project, data interpretation and drafting the manuscript. SS performed the data analysis, coding and programming, and partially drafting the manuscript. AS supervised experimental design, training sessions of neuroimaging protocols, quality assurance, and critical review and drafting of manuscript.
Funding
This work was supported by a grant from the PSC CUNY 61256-00 49.
Declarations
Conflict of Interest
The authors declare no competing interests.
References
- 1.Albuquerque G, Eisemann M, Magnor M (2011) Perception-based visual quality measures. In: 2011 IEEE conference on visual analytics science and technology (VAST). IEEE, pp 13–20
- 2.Sedlmair M, Tatu A, Munzner T, Tory M (2012) A taxonomy of visual cluster separation factors. In: Computer graphics forum, vol 31. Wiley Online Library, pp 1335–1344
- 3.Sips M, Neubert B, Lewis JP, Hanrahan P (2009) Selecting good views of high-dimensional data using class consistency. In: Computer graphics Forum, vol 28. Wiley Online Library, pp 831–838
- 4.Lehmann DJ, Kemmler F, Zhyhalava T, Kirschke M, Theisel H (2015) Visualnostics: visual guidance pictograms for analyzing projections of high-dimensional data. In: Computer graphics forum, vol 34. Wiley Online Library, pp 291–300
- 5.Wilkinson L, Anand A, Grossman R (2005) Graph-theoretic scagnostics. In: IEEE Symposium on information visualization. INFOVIS 2005. IEEE, pp 157–164
- 6.Tatu A, Bak P, Bertini E, Keim D, Schneidewind J (2010) Visual quality metrics and human perception: an initial study on 2D projections of large multidimensional data. In: Proceedings of the international conference on advanced visual interfaces, pp 49–56
- 7.Harrison L, Yang F, Franconeri S, Chang R. Ranking visualizations of correlation using Weber’s law. IEEE Trans Visual Comput Graphics. 2014;20(12):1943–1952. doi: 10.1109/TVCG.2014.2346979. [DOI] [PubMed] [Google Scholar]
- 8.Rensink R, Baldridge G. The visual perception of correlation in scatterplots. J Vis. 2010;10(7):975–975. doi: 10.1167/10.7.975. [DOI] [Google Scholar]
- 9.Etemadpour R, Olk B, Linsen L (2014) Eye-tracking investigation during visual analysis of projected multidimensional data with 2D scatterplots. In: 2014 international conference on information visualization theory and applications (IVAPP). IEEE, pp 233–246
- 10.Koffka K. Principles of Gestalt psychology, Routledge; 2013. [Google Scholar]
- 11.Rensink RA. The nature of correlation perception in scatterplots. Psychon Bull Rev. 2017;24(3):776–797. doi: 10.3758/s13423-016-1174-7. [DOI] [PMC free article] [PubMed] [Google Scholar]
- 12.Matute J, Telea AC, Linsen L. Skeleton-based scagnostics. IEEE Trans Visual Comput Graphics. 2017;24(1):542–552. doi: 10.1109/TVCG.2017.2744339. [DOI] [PubMed] [Google Scholar]
- 13.Kay M, Heer J. Beyond Weber’s law: a second look at ranking visualizations of correlation. IEEE Trans Visual Comput Graphics. 2015;22(1):469–478. doi: 10.1109/TVCG.2015.2467671. [DOI] [PubMed] [Google Scholar]
- 14.Sedlmair M, Aupetit M (2015) Data-driven evaluation of visual quality measures. In: Computer graphics forum, vol 34. Wiley Online Library, pp 201–210
- 15.Etemadpour R, Motta R, de Souza Paiva JG, Minghim R, De Oliveira MCF, Linsen L. Perception-based evaluation of projection methods for multidimensional data visualization. IEEE Trans Visual Comput Graphics. 2014;21(1):81–94. doi: 10.1109/TVCG.2014.2330617. [DOI] [PubMed] [Google Scholar]
- 16.Deco G, Romo R. The role of fluctuations in perception. Trends Neurosci. 2008;31(11):591–598. doi: 10.1016/j.tins.2008.08.007. [DOI] [PubMed] [Google Scholar]
- 17.Bode S, Sewell DK, Lilburn S, Forte JD, Smith PL, Stahl J. Predicting perceptual decision biases from early brain activity. J Neurosci. 2012;32(36):12488–12498. doi: 10.1523/JNEUROSCI.1708-12.2012. [DOI] [PMC free article] [PubMed] [Google Scholar]
- 18.Bode S, Bogler C, Haynes JD. Similar neural mechanisms for perceptual guesses and free decisions. Neuroimage. 2013;65:456–465. doi: 10.1016/j.neuroimage.2012.09.064. [DOI] [PubMed] [Google Scholar]
- 19.Parsons L, Haque E, Liu H. Subspace clustering for high dimensional data: a review. ACM SIGKDD Explorations Newsl. 2004;6(1):90–105. doi: 10.1145/1007730.1007731. [DOI] [Google Scholar]
- 20.Assent I, Krieger R, Müller E, Seidl T. VISA: visual subspace clustering analysis. ACM SIGKDD Explorations Newsl. 2007;9(2):5–12. doi: 10.1145/1345448.1345451. [DOI] [Google Scholar]
- 21.Maimon, O Rokach L (2010) Introduction to knowledge discovery and data mining, data mining and knowledge discovery handbook. Springer, pp 1–15
- 22.Dang TN, Wilkinson L (2014a) Scagexplorer: exploring scatterplots by their scagnostics. In: 2014 IEEE pacific visualization symposium. IEEE, pp 73–80
- 23.Dang TN, Wilkinson L. Transforming scagnostics to reveal hidden features. IEEE Trans Visual Comput Graphics. 2014;20(12):1624–1632. doi: 10.1109/TVCG.2014.2346572. [DOI] [PubMed] [Google Scholar]
- 24.Shao L, Mahajan A, Schreck T, Lehmann DJ (2017) Interactive regression lens for exploring scatter plots. In: Computer graphics forum, vol 36. Wiley Online Library, pp 157–166
- 25.Wang Y, Wang Z, Liu T, Correll M, Cheng Z, Deussen O, Sedlmair M. Improving the robustness of scagnostics. IEEE Trans Visual Comput Graphics. 2019;26(1):759–769. doi: 10.1109/TVCG.2019.2934796. [DOI] [PubMed] [Google Scholar]
- 26.Pandey AV, Krause J, Felix C, Boy J, Bertini E (2016) Towards understanding human similarity perception in the analysis of large sets of scatter plots. In: Proceedings of the 2016 CHI conference on human factors in computing systems, pp 3659–3669
- 27.Aupetit M, Sedlmair M (2016) SepMe: 2002 new visual separation measures. In: 2016 IEEE pacific visualization symposium (PacificVis). IEEE, pp 1–8
- 28.Shao L, Schleicher T, Behrisch M, Schreck T, Sipiran I, Keim DA. Guiding the exploration of scatter plot data using motif-based interest measures. J Vis Lang Comput. 2016;36:1–12. doi: 10.1016/j.jvlc.2016.07.003. [DOI] [Google Scholar]
- 29.Lehmann DJ, Hundt S, Theisel H (2015) A study on quality metrics vs. human perception: can visual measures help us to filter visualizations of interest? It Inf Technol 57(1):11–21
- 30.Wang M, Arteaga D, He BJ. Brain mechanisms for simple perception and bistable perception. Proc Natl Acad Sci. 2013;110(35):E3350–E3359. doi: 10.1073/pnas.1221945110. [DOI] [PMC free article] [PubMed] [Google Scholar]
- 31.Shankar S, Kayser AS. Perceptual and categorical decision making: goal-relevant representation of two domains at different levels of abstraction. J Neurophysiol. 2017;117(6):2088–2103. doi: 10.1152/jn.00512.2016. [DOI] [PMC free article] [PubMed] [Google Scholar]
- 32.Bode S, He AH, Soon CS, Trampel R, Turner R, Haynes JD. Tracking the unconscious generation of free decisions using uitra-high field fMRI. PLoS ONE. 2011;6(6):e21612. doi: 10.1371/journal.pone.0021612. [DOI] [PMC free article] [PubMed] [Google Scholar]
- 33.Meijer GT, Mertens PE, Pennartz CM, Olcese U, Lansink CS. The circuit architecture of cortical multisensory processing: distinct functions jointly operating within a common anatomical network. Prog Neurobiol. 2019;174:1–15. doi: 10.1016/j.pneurobio.2019.01.004. [DOI] [PubMed] [Google Scholar]
- 34.Xing J, Andersen RA. Models of the posterior parietal cortex which perform multimodal integration and represent space in several coordinate frames. J Cogn Neurosci. 2000;12(4):601–614. doi: 10.1162/089892900562363. [DOI] [PubMed] [Google Scholar]
- 35.Roitman JD, Brannon EM, Platt ML. Representation of numerosity in posterior parietal cortex. Front Integr Neurosci. 2012;6:25. doi: 10.3389/fnint.2012.00025. [DOI] [PMC free article] [PubMed] [Google Scholar]
- 36.Walsh V. A theory of magnitude: common cortical metrics of time, space and quantity. Trends Cogn Sci. 2003;7(11):483–488. doi: 10.1016/j.tics.2003.09.002. [DOI] [PubMed] [Google Scholar]
- 37.Lipton JS, Spelke ES. Origins of number sense: large-number discrimination in human infants. Psychol Sci. 2003;14(5):396–401. doi: 10.1111/1467-9280.01453. [DOI] [PubMed] [Google Scholar]
- 38.Sato T, Murthy A, Thompson KG, Schall JD. Search efficiency but not response interference affects visual selection in frontal eye field. Neuron. 2001;30(2):583–591. doi: 10.1016/S0896-6273(01)00304-X. [DOI] [PubMed] [Google Scholar]
- 39.Zhang H, Eppes A, Beatty-Martínez A, Navarro-Torres C, Diaz MT. Task difficulty modulates brain-behavior correlations in language production and cognitive control: behavioral and fMRI evidence from a phonological go/no-go picture-naming paradigm. Cogn Affect Behav Neurosci. 2018;18(5):964–981. doi: 10.3758/s13415-018-0616-2. [DOI] [PMC free article] [PubMed] [Google Scholar]
- 40.Wilkinson L, Anand A, Urbanek MS (2018) Package ‘scagnostics’
- 41.Netzel R, Vuong J, Engelke U, O’Donoghue S, Weiskopf D, Heinrich J. Comparative eye-tracking evaluation of scatterplots and parallel coordinates. Vis Inform. 2017;1(2):118–131. doi: 10.1016/j.visinf.2017.11.001. [DOI] [Google Scholar]
- 42.Eilbert J, Peters Z, Eliott FM, Stassun KG, Kunda M (2018) Shapes in scatterplots: comparing human visual impressions and computational metrics. In: CogSci
- 43.Edelsbrunner H, Kirkpatrick D, Seidel R. On the shape of a set of points in the plane. IEEE Trans Inf Theory. 1983;29(4):551–559. doi: 10.1109/TIT.1983.1056714. [DOI] [Google Scholar]
- 44.Skiena SS. The algorithm design manual. Springer; 1998. [Google Scholar]
- 45.Wilkinson L, Anand A, Grossman R. High-dimensional visual analytics: interactive exploration guided by pairwise views of point distributions. IEEE Trans Visual Comput Graphics. 2006;12(6):1363–1372. doi: 10.1109/TVCG.2006.94. [DOI] [PubMed] [Google Scholar]
- 46.Sedlmair M, Munzner T, Tory M. Empirical guidance on scatterplot and dimension reduction technique choices. IEEE Trans Visual Comput Graphics. 2013;19(12):2634–2643. doi: 10.1109/TVCG.2013.153. [DOI] [PubMed] [Google Scholar]
- 47.Sasane S, Schwabe L (2012) Decoding of EEG activity from object views: active detection vs. passive visual tasks. In: International conference on brain informatics. Springer, pp 277–287
- 48.Kay KN, Naselaris T, Prenger RJ, Gallant JL. Identifying natural images from human brain activity. Nature. 2008;452(7185):352–355. doi: 10.1038/nature06713. [DOI] [PMC free article] [PubMed] [Google Scholar]
- 49.Esch L, Dinh C, Larson E, Engemann D, Jas M, Khan S, Gramfort A, Hämäläinen MS. MNE: software for acquiring, processing, and visualizing MEG/EEG data. Magnetoencephalography: From signals to dynamic cortical networks; 2019. pp. 355–371. [Google Scholar]
- 50.Hyvärinen A, Oja E. Independent component analysis: algorithms and applications. Neural Netw. 2000;13(4–5):411–430. doi: 10.1016/S0893-6080(00)00026-5. [DOI] [PubMed] [Google Scholar]
- 51.Shapiro SS, Wilk MB. An analysis of variance test for normality (complete samples) Biometrika. 1965;52(3/4):591–611. doi: 10.2307/2333709. [DOI] [Google Scholar]
- 52.Tatler BW, Hayhoe MM, Land MF, Ballard DH. Eye guidance in natural vision: reinterpreting salience. J Vis. 2011;11(5):5–5. doi: 10.1167/11.5.5. [DOI] [PMC free article] [PubMed] [Google Scholar]
- 53.Shomstein S, Behrmann M. Object-based attention: strength of object representation and attentional guidance. Percept Psychophys. 2008;70(1):132–144. doi: 10.3758/PP.70.1.132. [DOI] [PMC free article] [PubMed] [Google Scholar]
- 54.Patel SH, Azzam PN. Characterization of N200 and P300: selected studies of the event-related potential. Int J Med Sci. 2005;2(4):147. doi: 10.7150/ijms.2.147. [DOI] [PMC free article] [PubMed] [Google Scholar]
- 55.Maguire MJ, Magnon G, Ogiela DA, Egbert R, Sides L. The N300 ERP component reveals developmental changes in object and action identification. Dev Cogn Neurosci. 2013;5:1–9. doi: 10.1016/j.dcn.2012.11.008. [DOI] [PMC free article] [PubMed] [Google Scholar]
- 56.Ellmore TM, Ng K, Reichert CP. Early and late components of EEG delay activity correlate differently with scene working memory performance. PLoS ONE. 2017;12(10):e0186072. doi: 10.1371/journal.pone.0186072. [DOI] [PMC free article] [PubMed] [Google Scholar]
- 57.Mazerolle EL, D’Arcy RC, Marchand Y, Bolster RB. ERP assessment of functional status in the temporal lobe: examining spatiotemporal correlates of object recognition. Int J Psychophysiol. 2007;66(1):81–92. doi: 10.1016/j.ijpsycho.2007.06.003. [DOI] [PubMed] [Google Scholar]
- 58.Bledowski C, Prvulovic D, Hoechstetter K, Scherg M, Wibral M, Goebel R, Linden DE. Localizing P300 generators in visual target and distractor processing: a combined event-related potential and functional magnetic resonance imaging study. J Neurosci. 2004;24(42):9353–9360. doi: 10.1523/JNEUROSCI.1897-04.2004. [DOI] [PMC free article] [PubMed] [Google Scholar]
- 59.Liu T, Slotnick SD, Serences JT, Yantis S. Cortical mechanisms of feature-based attentional control. Cereb Cortex. 2003;13(12):1334–1343. doi: 10.1093/cercor/bhg080. [DOI] [PubMed] [Google Scholar]
- 60.Scolari M, Seidl-Rathkopf KN, Kastner S. Functions of the human frontoparietal attention network: evidence from neuroimaging. Curr Opin Behav Sci. 2015;1:32–39. doi: 10.1016/j.cobeha.2014.08.003. [DOI] [PMC free article] [PubMed] [Google Scholar]
- 61.Wang L, Li C, Wu J (2017) The status of research into intention recognition. Improving the quality of life for dementia patients through progressive detection, treatment, and care. IGI Global, pp 201–221
- 62.Read GL, Innis IJ (2017) Electroencephalography (EEG). Int Encyclopedia Commun Res Meth 1–18
- 63.Radhakrishnan R, Addy PH, Sewell RA, Skosnik PD, Ranganathan M, D’Souza DC (2014) Cannabis, cannabinoids, and the association with psychosis. The effects of drug abuse on the human nervous system. Elsevier, pp 423–474
- 64.Escera C, Yago E, Alho K. Electrical responses reveal the temporal dynamics of brain events during involuntary attention switching. Eur J Neurosci. 2001;14(5):877–883. doi: 10.1046/j.0953-816x.2001.01707.x. [DOI] [PubMed] [Google Scholar]
- 65.Picton TW, Stuss DT, Champagne SC, Nelson RF. The effects of age on human event-related potentials. Psychophysiology. 1984;21(3):312–326. doi: 10.1111/j.1469-8986.1984.tb02941.x. [DOI] [PubMed] [Google Scholar]
- 66.Mueller V, Brehmer Y, Von Oertzen T, Li SC, Lindenberger U. Electrophysiological correlates of selective attention: a lifespan comparison. BMC Neurosci. 2008;9(1):18. doi: 10.1186/1471-2202-9-18. [DOI] [PMC free article] [PubMed] [Google Scholar]
- 67.Di Russo F, Martínez A, Sereno MI, Pitzalis S, Hillyard SA. Cortical sources of the early components of the visual evoked potential. Hum Brain Mapp. 2002;15(2):95–111. doi: 10.1002/hbm.10010. [DOI] [PMC free article] [PubMed] [Google Scholar]
- 68.Kutas M, Federmeier KD. Thirty years and counting: finding meaning in the N400 component of the event-related brain potential (ERP) Annu Rev Psychol. 2011;62:621–647. doi: 10.1146/annurev.psych.093008.131123. [DOI] [PMC free article] [PubMed] [Google Scholar]
- 69.Menon V, Ford JM, Lim KO, Glover GH, Pfefferbaum A. Combined event-related fMRI and EEG evidence for temporal-parietal cortex activation during target detection. NeuroReport. 1997;8(14):3029–3037. doi: 10.1097/00001756-199709290-00007. [DOI] [PubMed] [Google Scholar]
- 70.Krigolson OE, Cheng D, Binsted G. The role of visual processing in motor learning and control: insights from electroencephalography. Vision Res. 2015;110:277–285. doi: 10.1016/j.visres.2014.12.024. [DOI] [PubMed] [Google Scholar]
- 71.Kirino E, Belger A, Goldman-Rakic P, McCarthy G. Prefrontal activation evoked by infrequent target and novel stimuli in a visual target detection task: an event-related functional magnetic resonance imaging study. J Neurosci. 2000;20(17):6612–6618. doi: 10.1523/JNEUROSCI.20-17-06612.2000. [DOI] [PMC free article] [PubMed] [Google Scholar]
- 72.Friedman D, Cycowicz YM, Gaeta H. The novelty P3: an event-related brain potential (ERP) sign of the brain’s evaluation of novelty. Neurosci Biobehav Rev. 2001;25(4):355–373. doi: 10.1016/S0149-7634(01)00019-7. [DOI] [PubMed] [Google Scholar]
- 73.Comerchero MD, Polich J. P3a and P3b from typical auditory and visual stimuli. Clin Neurophysiol. 1999;110(1):24–30. doi: 10.1016/S0168-5597(98)00033-1. [DOI] [PubMed] [Google Scholar]
- 74.Nieuwenhuis S, De Geus EJ, Aston-Jones G. The anatomical and functional relationship between the P3 and autonomic components of the orienting response. Psychophysiology. 2011;48(2):162–175. doi: 10.1111/j.1469-8986.2010.01057.x. [DOI] [PMC free article] [PubMed] [Google Scholar]
- 75.Hagen GF, Gatherwright JR, Lopez BA, Polich J. P3a from visual stimuli: task difficulty effects. Int J Psychophysiol. 2006;59(1):8–14. doi: 10.1016/j.ijpsycho.2005.08.003. [DOI] [PubMed] [Google Scholar]
- 76.Katayama J, Polich J. Stimulus context determines P3a and P3b. Psychophysiology. 1998;35(1):23–33. doi: 10.1111/1469-8986.3510023. [DOI] [PubMed] [Google Scholar]
- 77.Noppeney U, Price CJ, Penny WD, Friston KJ. Two distinct neural mechanisms for category-selective responses. Cereb Cortex. 2006;16(3):437–445. doi: 10.1093/cercor/bhi123. [DOI] [PubMed] [Google Scholar]
- 78.Haxby JV, Gobbini MI, Montgomery K (2004) Spatial and temporal distribution of face and object representations in the human brain
- 79.Lafer-Sousa R, Conway BR. Parallel, multi-stage processing of colors, faces and shapes in macaque inferior temporal cortex. Nat Neurosci. 2013;16(12):1870. doi: 10.1038/nn.3555. [DOI] [PMC free article] [PubMed] [Google Scholar]
- 80.Lüdtke J, Friedrich CK, De Filippis M, Kaup B. Event-related potential correlates of negation in a sentence-picture verification paradigm. J Cogn Neurosci. 2008;20(8):1355–1370. doi: 10.1162/jocn.2008.20093. [DOI] [PubMed] [Google Scholar]
- 81.Potts GF, Patel SH, Azzam PN. Impact of instructed relevance on the visual ERP. Int J Psychophysiol. 2004;52(2):197–209. doi: 10.1016/j.ijpsycho.2003.10.005. [DOI] [PubMed] [Google Scholar]
- 82.Bourisly AK, Shuaib A. Neurophysiological effects of aging: a P200 ERP study. Transl Neurosci. 2018;9(1):61–66. doi: 10.1515/tnsci-2018-0011. [DOI] [PMC free article] [PubMed] [Google Scholar]
- 83.Potts GF. An ERP index of task relevance evaluation of visual stimuli. Brain Cogn. 2004;56(1):5–13. doi: 10.1016/j.bandc.2004.03.006. [DOI] [PubMed] [Google Scholar]
- 84.Madden DJ, Parks EL, Tallman CW, Boylan MA, Hoagey DA, Cocjin SB, Johnson MA, Yh Chou GG, Potter Nk Chen, et al. Frontoparietal activation during visual conjunction search: effects of bottom-up guidance and adult age. Hum Brain Mapp. 2017;38(4):2128–2149. doi: 10.1002/hbm.23509. [DOI] [PMC free article] [PubMed] [Google Scholar]
- 85.Corbetta M, Patel G, Shulman GL. The reorienting system of the human brain: from environment to theory of mind. Neuron. 2008;58(3):306–324. doi: 10.1016/j.neuron.2008.04.017. [DOI] [PMC free article] [PubMed] [Google Scholar]
- 86.Makin AD, Wright D, Rampone G, Palumbo L, Guest M, Sheehan R, Cleaver H, Bertamini M. An electrophysiological index of perceptual goodness. Cereb Cortex. 2016;26(12):4416–4434. doi: 10.1093/cercor/bhw255. [DOI] [PMC free article] [PubMed] [Google Scholar]
- 87.Wright D, Makin AD, Bertamini M. Right-lateralized alpha desynchronization during regularity discrimination: hemispheric specialization or directed spatial attention? Psychophysiology. 2015;52(5):638–647. doi: 10.1111/psyp.12399. [DOI] [PMC free article] [PubMed] [Google Scholar]
- 88.Bertamini M, Rampone G, Oulton J, Tatlidil S, Makin AD. Sustained response to symmetry in extrastriate areas after stimulus offset: an EEG study. Sci Rep. 2019;9(1):1–11. doi: 10.1038/s41598-019-40580-z. [DOI] [PMC free article] [PubMed] [Google Scholar]
- 89.Jacobsen T, Klein S, Löw A. The posterior sustained negativity revisited-an SPN reanalysis of Jacobsen and Höfel (2003) Symmetry. 2018;10(1):27. doi: 10.3390/sym10010027. [DOI] [Google Scholar]
- 90.Kahneman D (1973) Attention and effort, vol 1063. Citeseer
- 91.Xu G, Wu Y, Li M. The study of influence of sound on visual ERP-based brain computer interface. Sensors. 2020;20(4):1203. doi: 10.3390/s20041203. [DOI] [PMC free article] [PubMed] [Google Scholar]
- 92.Polich J, Kok A. Cognitive and biological determinants of P300: an integrative review. Biol Psychol. 1995;41(2):103–146. doi: 10.1016/0301-0511(95)05130-9. [DOI] [PubMed] [Google Scholar]
- 93.Saliasi E, Geerligs L, Lorist MM, Maurits NM. The relationship between P3 amplitude and working memory performance differs in young and older adults. PLoS ONE. 2013;8(5):e63701. doi: 10.1371/journal.pone.0063701. [DOI] [PMC free article] [PubMed] [Google Scholar]
- 94.Friederici AD, Hahne A, Saddy D. Distinct neurophysiological patterns reflecting aspects of syntactic complexity and syntactic repair. J Psycholinguist Res. 2002;31(1):45–63. doi: 10.1023/A:1014376204525. [DOI] [PubMed] [Google Scholar]
- 95.Roldan SM. Object recognition in mental representations: directions for exploring diagnostic features through visual mental imagery. Front Psychol. 2017;8:833. doi: 10.3389/fpsyg.2017.00833. [DOI] [PMC free article] [PubMed] [Google Scholar]
- 96.Vance J, Stokes D. Noise, uncertainty, and interest: predictive coding and cognitive penetration. Conscious Cogn. 2017;47:86–98. doi: 10.1016/j.concog.2016.06.007. [DOI] [PubMed] [Google Scholar]
- 97.Ransom M, Fazelpour S, Mole C. Attention in the predictive mind. Conscious Cogn. 2017;47:99–112. doi: 10.1016/j.concog.2016.06.011. [DOI] [PubMed] [Google Scholar]
- 98.Yip HMK, Cheung LY, Wong YK, Wong ACN (2020) The effect of task on object processing revealed by EEG decoding. bioRxiv [DOI] [PubMed]
- 99.Voss JL, Federmeier KD. FN400 potentials are functionally identical to N400 potentials and reflect semantic processing during recognition testing. Psychophysiology. 2011;48(4):532–546. doi: 10.1111/j.1469-8986.2010.01085.x. [DOI] [PMC free article] [PubMed] [Google Scholar]
- 100.Paller KA, Lucas HD, Voss JL. Assuming too much from ‘familiar’ brain potentials. Trends Cogn Sci. 2012;16(6):313–315. doi: 10.1016/j.tics.2012.04.010. [DOI] [PubMed] [Google Scholar]
- 101.Leynes PA, Batterman A, Abrimian A (2019) Expectations alter recognition and event-related potentials (ERPS). Brain Cogn 135:103573 [DOI] [PubMed]
- 102.Yang J, Long C. Common and distinctive cognitive processes between categorization and category-based induction: evidence from event-related potentials. Brain Res. 2020;1749:147134. doi: 10.1016/j.brainres.2020.147134. [DOI] [PubMed] [Google Scholar]
- 103.Kutas M, Federmeier KD (2009) N400. Scholarpedia 4(10):7790
- 104.Foxe JJ, Simpson GV. Flow of activation from V1 to frontal cortex in humans. Exp Brain Res. 2002;142(1):139–150. doi: 10.1007/s00221-001-0906-7. [DOI] [PubMed] [Google Scholar]
- 105.Albuquerque G, Eisemann M, Lehmann DJ, Theisel H, Magnor M (2010 Improving the visual analysis of high-dimensional datasets using quality measures. In: 2010 IEEE symposium on visual analytics science and technology. IEEE, pp 19–26