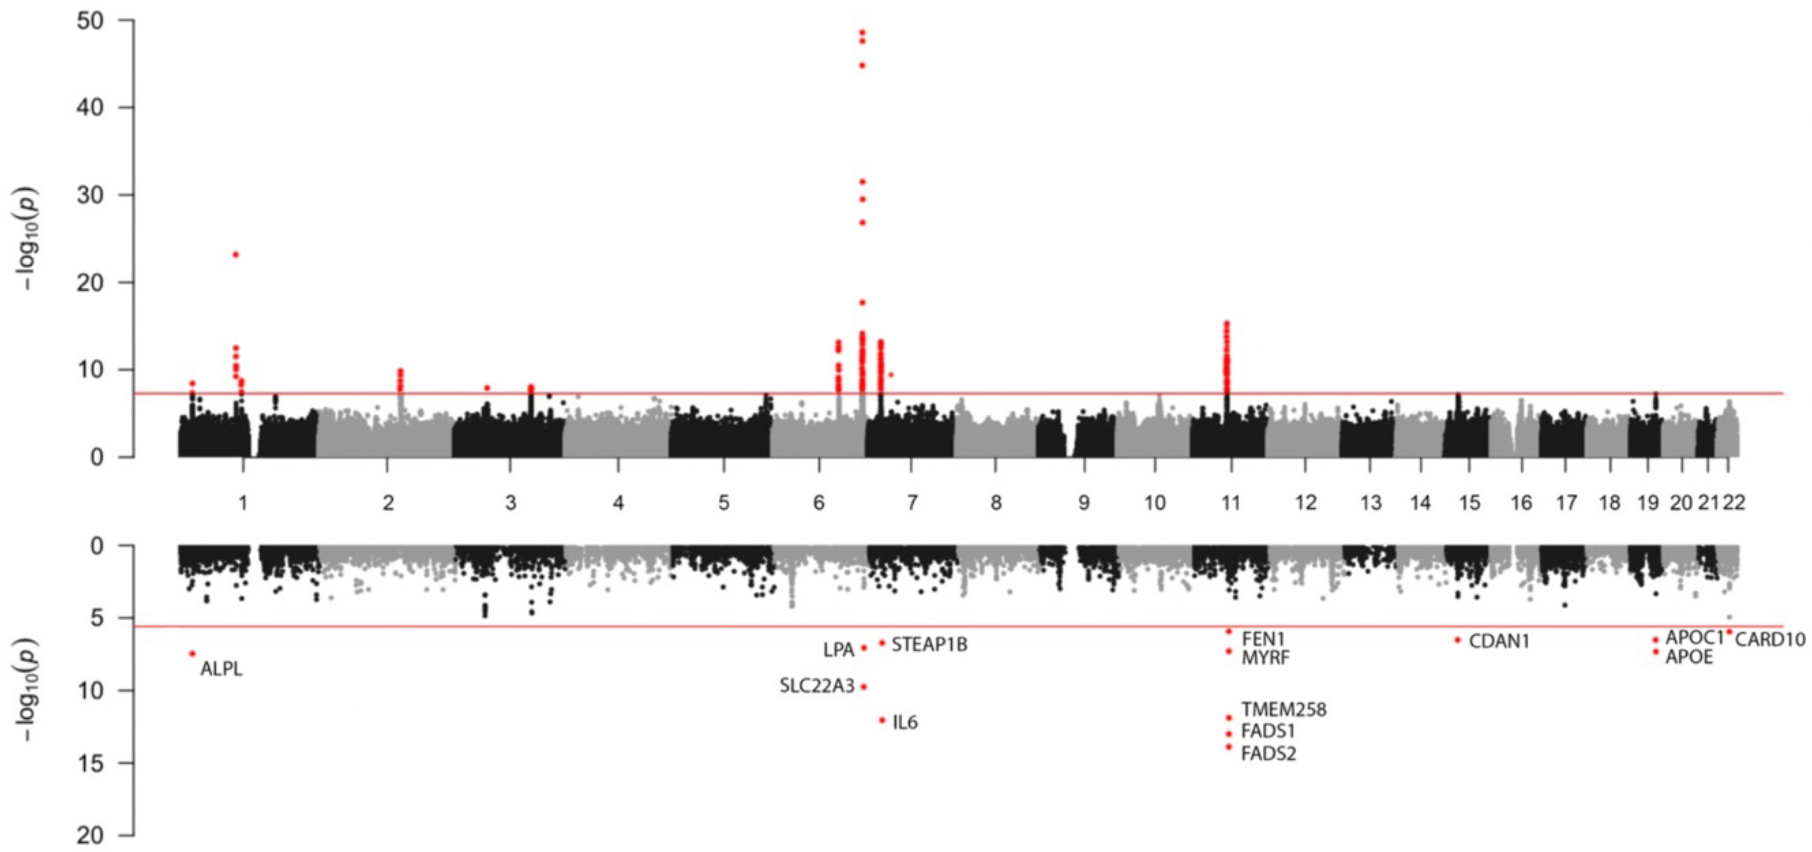
Figure 1: Hudson Plot of Multi-Ancestry GWAS findings (top) and MAGMA Gene Association Analysis (bottom).

Hudson plot with multi-ancestry GWAS Manhattan plot (top) with genome-wide significant variants (p-value < 5×10−08) labeled in red and a gene analysis of multi-ancestry GWAS data (bottom) using Multi-Marker Analysis of Genomic Annotation (MAGMA) with gene wide significant results (19,021 protein coding genes, p-value < 2.6 × 10⁻⁶) labeled in red.
