

Key Points
Question
Among people with weight loss within the past 2 years, is the rate of cancer diagnosis significantly increased during the subsequent 12 months compared with those without recent weight loss?
Findings
Among 157 474 health professionals followed up for a mean of 28 years, recent weight loss of greater than 10.0% of body weight was associated with an increased rate of cancer during the next 12 months vs those without recent weight loss (1362 cancer cases/100 000 person-years vs 869 cancer cases/100 000 person-years, respectively; between-group difference, 493 cases/100 000 person-years).
Meaning
Recent weight loss was associated with a significantly higher rate of cancer during the next 12 months compared with those without recent weight loss.
Abstract
Importance
Weight loss is common in primary care. Among individuals with recent weight loss, the rates of cancer during the subsequent 12 months are unclear compared with those without recent weight loss.
Objective
To determine the rates of subsequent cancer diagnoses over 12 months among health professionals with weight loss during the prior 2 years compared with those without recent weight loss.
Design, Setting, and Participants
Prospective cohort analysis of females aged 40 years or older from the Nurses’ Health Study who were followed up from June 1978 until June 30, 2016, and males aged 40 years or older from the Health Professionals Follow-Up Study who were followed up from January 1988 until January 31, 2016.
Exposure
Recent weight change was calculated from the participant weights that were reported biennially. The intentionality of weight loss was categorized as high if both physical activity and diet quality increased, medium if only 1 increased, and low if neither increased.
Main Outcome and Measures
Rates of cancer diagnosis during the 12 months after weight loss.
Results
Among 157 474 participants (median age, 62 years [IQR, 54-70 years]; 111 912 were female [71.1%]; there were 2631 participants [1.7%] who self-identified as Asian, Native American, or Native Hawaiian; 2678 Black participants [1.7%]; and 149 903 White participants [95.2%]) and during 1.64 million person-years of follow-up, 15 809 incident cancer cases were identified (incident rate, 964 cases/100 000 person-years). During the 12 months after reported weight change, there were 1362 cancer cases/100 000 person-years among all participants with recent weight loss of greater than 10.0% of body weight compared with 869 cancer cases/100 000 person-years among those without recent weight loss (between-group difference, 493 cases/100 000 person-years [95% CI, 391-594 cases/100 000 person-years]; P < .001). Among participants categorized with low intentionality for weight loss, there were 2687 cancer cases/100 000 person-years for those with weight loss of greater than 10.0% of body weight compared with 1220 cancer cases/100 000 person-years for those without recent weight loss (between-group difference, 1467 cases/100 000 person-years [95% CI, 799-2135 cases/100 000 person-years]; P < .001). Cancer of the upper gastrointestinal tract (cancer of the esophagus, stomach, liver, biliary tract, or pancreas) was particularly common among participants with recent weight loss; there were 173 cancer cases/100 000 person-years for those with weight loss of greater than 10.0% of body weight compared with 36 cancer cases/100 000 person-years for those without recent weight loss (between-group difference, 137 cases/100 000 person-years [95% CI, 101-172 cases/100 000 person-years]; P < .001).
Conclusions and Relevance
Health professionals with weight loss within the prior 2 years had a significantly higher risk of cancer during the subsequent 12 months compared with those without recent weight loss. Cancer of the upper gastrointestinal tract was particularly common among participants with recent weight loss compared with those without recent weight loss.
This study compares the rates of subsequent cancer diagnoses over 12 months among health professionals in the Nurses’ Health Study and the Health Professionals Follow-Up Study with weight loss during the prior 2 years compared with those without recent weight loss.
Introduction
Cancer accounted for approximately 2 of every 10 deaths in the US in 2020.1,2 Most cancer cases are diagnosed after evaluation for symptoms.3 Weight loss is a common symptom in general medical practice. Prior studies suggested that weight loss was associated with higher rates of cancer diagnosis during the next several months.4,5,6,7,8,9 However, nearly all of these prior studies assessed weight loss disease codes entered by clinicians rather than serial weight measurements, and most studies included limited numbers of cancer types or did not include a control group.
Characteristics of weight loss that require further evaluation for a possible cancer diagnosis are poorly defined.3,10 However, unexpected or unintentional weight loss in which an individual was not attempting to lose weight may be an important characteristic when considering the likelihood that weight loss is due to an occult cancer. In addition, the absolute risk of cancer associated with specific amounts of weight loss has not been well characterized.4,11
This study analyzed data from the Nurses’ Health Study (NHS) and the Health Professionals Follow-Up Study (HPFS) to identify associations of recent weight loss with subsequent cancer risk and with specific cancer types over more than 30 years of follow-up.
Methods
Study Population
In 1976, the NHS enrolled 121 731 US female nurses aged 30 to 55 years.12 In 1986, the HPFS enrolled 51 530 US male health professionals aged 40 to 75 years.13 Sex was ascertained by self-report at enrollment. Questionnaires were sent to participants biennially to assess medical, lifestyle, and health information. In this study, baseline was June 1978 for the NHS and January 1988 for the HPFS. Participants entered the study at baseline if aged 40 years or older or upon reaching 40 years of age during follow-up. Follow-up continued until June 30, 2016, for the NHS and January 31, 2016, for the HPFS.
The study protocol was approved by the institutional review boards of Brigham and Women’s Hospital and Harvard T. H. Chan School of Public Health and the participating cancer and death registries (additional information about the registries appears at the end of the article). All participants provided written informed consent for accessibility of related medical records.
Assessment of Weight Change
Weight was reported by participants on biennial questionnaires. Recent weight change within the past 2 years was calculated as a percentage between each consecutive pair of questionnaires throughout follow-up (calculated by subtracting the current weight from the previous weight and dividing by the previous weight). Self-reported weight was highly correlated with staff-measured weight (r = 0.97 for both cohorts with a sample size of 263 participants).14
Classification of Weight Loss Behaviors
We assessed the degree to which weight loss was intentional based on changes in physical activity level and diet quality between consecutive questionnaires administered every 2 years for physical activity and every 4 years for food frequency assessments.15 Self-reported measurements were validated in previous studies and had a Spearman correlation coefficient of 0.80 (95% CI, 0.75-0.85) for the Alternative Healthy Eating Index 2010 score and 7-day dietary records and 0.60 (95% CI, 0.52-0.68) for physical activity and using multiple methods (eg, doubly labeled water).16,17
We hypothesized that those who intended to lose weight were more likely to increase their physical activity levels and improve their diet quality (ie, have a high number of weight loss–promoting behaviors) and those who were not trying to lose weight would not increase their physical activity levels or improve their diet quality (ie, have a low number of weight loss–promoting behaviors). Thus, weight loss–promoting behaviors were classified into 1 of 3 groups: (1) “high” if participants increased their physical activity levels (represented by an increase in weekly exercise and measured in metabolic equivalent task hours per week) between questionnaires and improved their diet quality (represented by an increase in Alternative Healthy Eating Index 2010 score) between questionnaires; (2) “medium” if they only increased physical activity or only improved diet quality; and (3) “low” if they neither increased physical activity nor improved diet quality. Physical activity and diet quality were initially assessed in 1986; therefore, weight loss behaviors were classified from 1988 onward.
Ascertainment of Incident Invasive Cancer Types
We identified incident invasive cancer types (excluding nonmelanoma skin cancer, in situ breast cancer, and stage T1a prostate cancer) via participants’ biennial self-report or regular searches of death certificates identified using the National Death Index. Cancer diagnosis and the date of the diagnosis were confirmed by physician review of medical records, death certificates, or cancer registry data. Cancer overall and by individual cancer types with 50 cases or more are included in this study (eMethods in Supplement 1).
Assessment of Covariates
Covariates were selected for the multivariable analyses based on their potential associations with cancer risk or weight loss. Data on race were collected because race is associated with cancer risk.18 Race was self-reported by participants in 1992 in the NHS and in 1986 in the HPFS via questionnaires that had fixed response categories. Health and lifestyle factors were updated from successive questionnaires, including family history of cancer, cigarette smoking, smoking cessation, alcohol consumption, multivitamin use, physical activity level (measured by metabolic equivalent task hours per week), dietary quality (measured by Alternative Healthy Eating Index 2010 score, excluding alcohol consumption), previous body mass index (BMI; calculated as weight in kilograms divided by height in meters squared), and menopausal status and hormone therapy use in females. Detailed information on the covariates appears in the eMethods in Supplement 1.
Assessment of Major Comorbidities
Participants were asked to report physician-diagnosed common diseases every 2 years, which were confirmed through medical records or death certificates. Recently diagnosed major comorbidities were defined as diseases diagnosed within the past 2 years (ie, the same period as the weight change measurement) that could cause weight loss. Common weight loss–associated diseases were diabetes, myocardial infarction, stroke, congestive heart failure, Crohn disease, ulcerative colitis, and depression.10,19
Statistical Analysis
Person-years were calculated from the assessment of weight change to the first cancer diagnosis, death, or end of follow-up, whichever came first. To handle time-varying exposures and covariates, the Andersen-Gill data structure was applied by creating a new record with updated covariates for each questionnaire cycle when a participant was at risk.20
In the primary analyses, recent weight change was categorized into 4 groups (no weight loss, weight loss of 0.1%-5.0%, weight loss of 5.1%-10.0%, and weight loss of >10.0%),10 and cancer risk was assessed for 12 months after report of the most recent weight (eFigure 1A in Supplement 1). The absolute cancer incidence rates were computed as the number of observed cases divided by person-years, the between-group differences were computed among the 4 weight change groups, and the 95% CIs were calculated using a Poisson model. Age-standardized incidence rates were calculated by standardizing the crude incidence rate in 5-year age groups to the 2000 US standard population aged 40 years or older with 95% CIs estimated based on the gamma distribution.21 Using SEER*Stat software version 8.4 (National Cancer Institute), incidence rates for total cancer and individual types of cancer from 2014 to 2018 were obtained from the National Cancer Institute’s Surveillance, Epidemiology, and End Results (SEER) Program for comparison with incidence rates in the current study population (eTable 1 in Supplement 1).
To assess relative risk of cancer diagnosis by recent weight change, multivariable-adjusted hazard ratios were estimated using Cox proportional hazards regression with time since the questionnaire cycle as the time scale and conditioned on age and calendar years with adjustment for covariates. Missing covariate data were imputed using median values from the 2 cohort populations. The P values were calculated using the Wald test, including the median values of weight change from each category in the regression models. Sensitivity analyses were conducted after stratifying by sex and cohort and after excluding participants with recently diagnosed major comorbidities. To evaluate cancer risk during the first year (1-12 months) and second year (13-24 months) after questionnaire completion, weight change was analyzed as a continuous variable using restricted cubic splines in a multivariable-adjusted Cox regression with associations tested using the likelihood ratio test.22
Cancer risk was also evaluated using other periods after report of weight change, including 1 to 6 months, 7 to 12 months, 13 to 24 months, and 25 to 36 months. To further define long-term weight change trajectories while controlling for differences by age and sex, we examined 20-year BMI trends before cancer diagnosis among cancer cases and randomly selected age- and sex-matched controls at 1:5 (case:controls). Eligible controls were participants who were alive and free of cancer at the date of case diagnosis. We assessed differences in BMI changes by comparing cases with controls using the Wilcoxon rank sum test.
Among participants aged 60 years or older, stratification analyses were performed to evaluate cancer incidence by weight change across age, sex, smoking history and status, previous BMI, and intentionality of weight loss. We also calculated 1-year absolute cancer probabilities by examining weight change together with other participant characteristics, including age, sex, smoking history and status, previous BMI, and weight loss intentionality, using cumulative incidence function modeling.23 A 1-year absolute risk threshold of 3.0% was evaluated based on practice guidelines for risk-informed cancer workup.24 Associations between weight change and stage at cancer diagnosis were examined using competing risk regression, and treating diagnosis at other cancer stages as competing events. The P values for heterogeneity were calculated using the Laird and DerSimonian method to compare cancer stage–specific relative risks.25
The analyses were performed using SAS version 9.4 (SAS Institute Inc). A 2-sided P < .05 indicated statistical significance; however, in the cancer risk analyses of the 21 individual cancer types, P ≤ .002 was applied after Bonferroni correction for the number of cancer types evaluated.
Results
Participant Characteristics
Of the 173 261 potential participants from the NHS and the HPFS for this study, 7832 had a history of cancer at baseline and were excluded. There were an additional 2971 participants who either did not have a recorded birth date or had not returned any questionnaires after the baseline questionnaire, leaving 162 458 who were aged 40 years or older, did not have cancer, and met other inclusion criteria. An additional 4984 participants were excluded due to lack of weight data during any 2 consecutive questionnaires.
Of the 157 474 participants included in this study, the median age was 62 years (IQR, 54-70 years) and 111 912 were female (71.1%). There were 2631 participants (1.7%) who identified as Asian, Native American, or Native Hawaiian, 2678 Black participants (1.7%), and 149 903 White participants (95.2%). During 1.64 million person-years of follow-up, 15 809 incident cancer cases were identified with an incidence rate of 964 cases/100 000 person-years. The follow-up rate was 95.4% (mean, 28 years [SD, 10 years]). Participants with any weight loss had similar sex, race, BMI, and lifestyle factors compared with those without recent weight loss (Table and eTable 2 in Supplement 1). Missing data on covariates ranged from 0.8% for menopausal status and hormone therapy use to 2.1% for tobacco smoking in pack-years.
Table. Age-Adjusted Characteristics of Study Participants According to Recent Weight Change and Weight Loss–Promoting Behaviors.
| No weight lossa | Any weight lossa | ||||
|---|---|---|---|---|---|
| Overall | Weight loss–promoting behavior categoriesb | ||||
| Low | Medium | High | |||
| Study participants, person-years | 1 049 077 | 591 639 | 38 604 | 172 021 | 165 011 |
| Recent weight change, mean (SD), %c | 3.4 (4.8) | −4.6 (4.4) | −3.8 (3.7) | −4.2 (4.1) | −4.5 (4.3) |
| Age, mean (SD), y | 60.7 (11.1) | 64.3 (11.5) | 67.0 (9.3) | 66.4 (9.9) | 66.1 (9.9) |
| Sex, % | |||||
| Male | 21.5 | 21.7 | 50.2 | 34.3 | 29.3 |
| Female | 78.5 | 78.3 | 48.8 | 65.7 | 70.7 |
| Race, person-years | 1 035 594 | 583 317 | 37 551 | 168 473 | 162 228 |
| Race, % | |||||
| Asian | 1.0 | 1.0 | 1.0 | 1.0 | 1.0 |
| Black | 1.4 | 1.4 | 0.8 | 1.0 | 1.1 |
| Native American or Native Hawaiiand | 0.2 | 0.2 | 0.1 | 0.2 | 0.2 |
| White | 97.4 | 97.4 | 98.1 | 97.8 | 97.7 |
| Family history of cancer, % | 37.6 | 37.8 | 41.3 | 43.1 | 43.7 |
| Physical activity, mean (SD), MET h/wk | |||||
| Cumulative | 20.8 (20.6) | 20.3 (19.6) | 23.9 (21.0) | 21.2 (20.2) | 20.5 (19.4) |
| Current | 22.1 (26.8) | 22.5 (26.6) | 17.6 (20.6) | 21.0 (25.5) | 27.2 (29.8) |
| Body mass index, mean (SD)e | 25.1 (4.1) | 25.4 (4.4) | 25.6 (3.9) | 25.5 (4.2) | 25.5 (4.2) |
| Body mass index, % | |||||
| <25.0 | 55.9 | 53.5 | 50.6 | 52.2 | 52.3 |
| 25.0-29.9 | 32.7 | 33.0 | 37.6 | 34.9 | 34.6 |
| 30.0-34.9 | 8.6 | 9.7 | 8.9 | 9.4 | 9.5 |
| ≥35.0 | 2.8 | 3.7 | 2.9 | 3.5 | 3.6 |
| Tobacco smoking, person-years | 1 027 062 | 578 588 | 37 443 | 167 460 | 161 247 |
| Tobacco smoking, pack-years, % | |||||
| Never | 46.8 | 45.9 | 46.5 | 47.3 | 48.1 |
| <5 | 8.7 | 8.7 | 7.5 | 8.5 | 8.9 |
| 5-19 | 18.7 | 18.4 | 18.8 | 18.4 | 18.4 |
| 20-39 | 15.7 | 15.9 | 16.0 | 15.2 | 14.7 |
| ≥40 | 10.1 | 11.0 | 11.3 | 10.6 | 10.0 |
| Smoking status, person-years | 1 037 148 | 584 343 | 37 829 | 169 156 | 162 767 |
| Smoking status, % | |||||
| Current | 12.5 | 14.4 | 10.0 | 10.8 | 9.9 |
| Duration since smoking cessation, y | |||||
| <2.0 | 2.7 | 1.5 | 1.1 | 1.3 | 1.4 |
| 2.0-3.9 | 2.1 | 1.8 | 1.4 | 1.7 | 1.9 |
| 4.0-5.9 | 2.0 | 1.9 | 1.5 | 1.9 | 2.0 |
| ≥6.0 (or never) | 80.8 | 80.3 | 86.0 | 84.4 | 84.8 |
| Alcohol consumption, mean (SD), g/d | 7.1 (10.5) | 7.1 (10.6) | 8.6 (11.5) | 7.6 (10.9) | 7.1 (10.4) |
| Multivitamin use, % | 50.7 | 52.3 | 55.6 | 54.8 | 56.2 |
| Alternative Healthy Eating Index 2010 score, mean (SD)f | |||||
| Cumulative | 48.6 (9.7) | 48.5 (9.4) | 48.0 (9.2) | 48.0 (9.5) | 48.0 (9.4) |
| Current | 50.7 (11.7) | 50.8 (11.4) | 45.6 (10.2) | 48.4 (11.1) | 52.5 (11.4) |
| Menopausal status and hormone therapy use, person-years | 823 109 | 452 200 | 20 218 | 112 472 | 119 162 |
| Menopausal status and hormone therapy use, % | |||||
| Premenopausal | 17.9 | 17.3 | 7.3 | 12.8 | 11.9 |
| Postmenopausal | |||||
| Never user | 29.0 | 29.5 | 26.9 | 27.6 | 27.1 |
| Past user | 28.1 | 29.2 | 20.5 | 27.0 | 32.2 |
| Current user | 25.0 | 24.0 | 45.4 | 32.5 | 28.9 |
Abbreviation: MET, metabolic equivalent task.
The data (except for age) have been standardized to the age distribution of the study population. The time-varying variables were updated during follow-up. The data for the continuous variables are cumulative means unless otherwise indicated.
Weight loss–promoting behaviors (intentionality of weight loss) were categorized as (1) high if both physical activity (in MET hours per week) and diet quality (based on Alternative Healthy Eating Index 2010 score) increased during consecutive questionnaires, (2) medium if only 1 of these increased (physical activity or diet quality score), and (3) low if neither increased. Intentionality of weight loss was assessed starting in 1988.
The negative values indicate weight loss.
These categories were available for Nurses’ Health Study participants only.
Calculated as weight in kilograms divided by height in meters squared.
The Alternative Healthy Eating Index 2010 score excluding alcohol consumption has an overall score of 0 to 100 points; higher scores indicate a healthier diet.
Recent Weight Change and 1-Year Risk of Cancer
Among participants diagnosed with cancer during the year following weight assessment, 15% had weight loss of greater than 5.0% of body weight and 5% had weight loss of greater than 10.0% before cancer diagnosis (eFigure 1B in Supplement 1). The mean length of time between reported weight change and subsequent cancer diagnosis was 6.5 months (SD, 3.5 months) for participants with weight loss of 5.1% to 10.0% of body weight and was 6.0 months (SD, 3.5 months) for those with weight loss of greater than 10.0% (eFigure 2 in Supplement 1).
The cancer incidence rate was 1362 cases/100 000 person-years among participants with recent weight loss of greater than 10.0% vs 869 cases/100 000 person-years among those without recent weight loss (between-group difference, 493 cases/100 000 person-years [95% CI, 391-594 cases/100 000 person-years], P < .001; Figure 1 and eTable 3 in Supplement 1). Among participants categorized with low intentionality for weight loss, there were 2687 cancer cases/100 000 person-years for those with weight loss of greater than 10.0% of body weight compared with 1220 cancer cases/100 000 person-years for those without recent weight loss (between-group difference, 1467 cases/100 000 person-years [95% CI, 799-2135 cases/100 000 person-years], P < .001; Figure 1 and eTable 3 in Supplement 1).
Figure 1. Recent Weight Change and 1-Year Risk of Cancer Overall and by Category of Weight Loss–Promoting Behaviors.
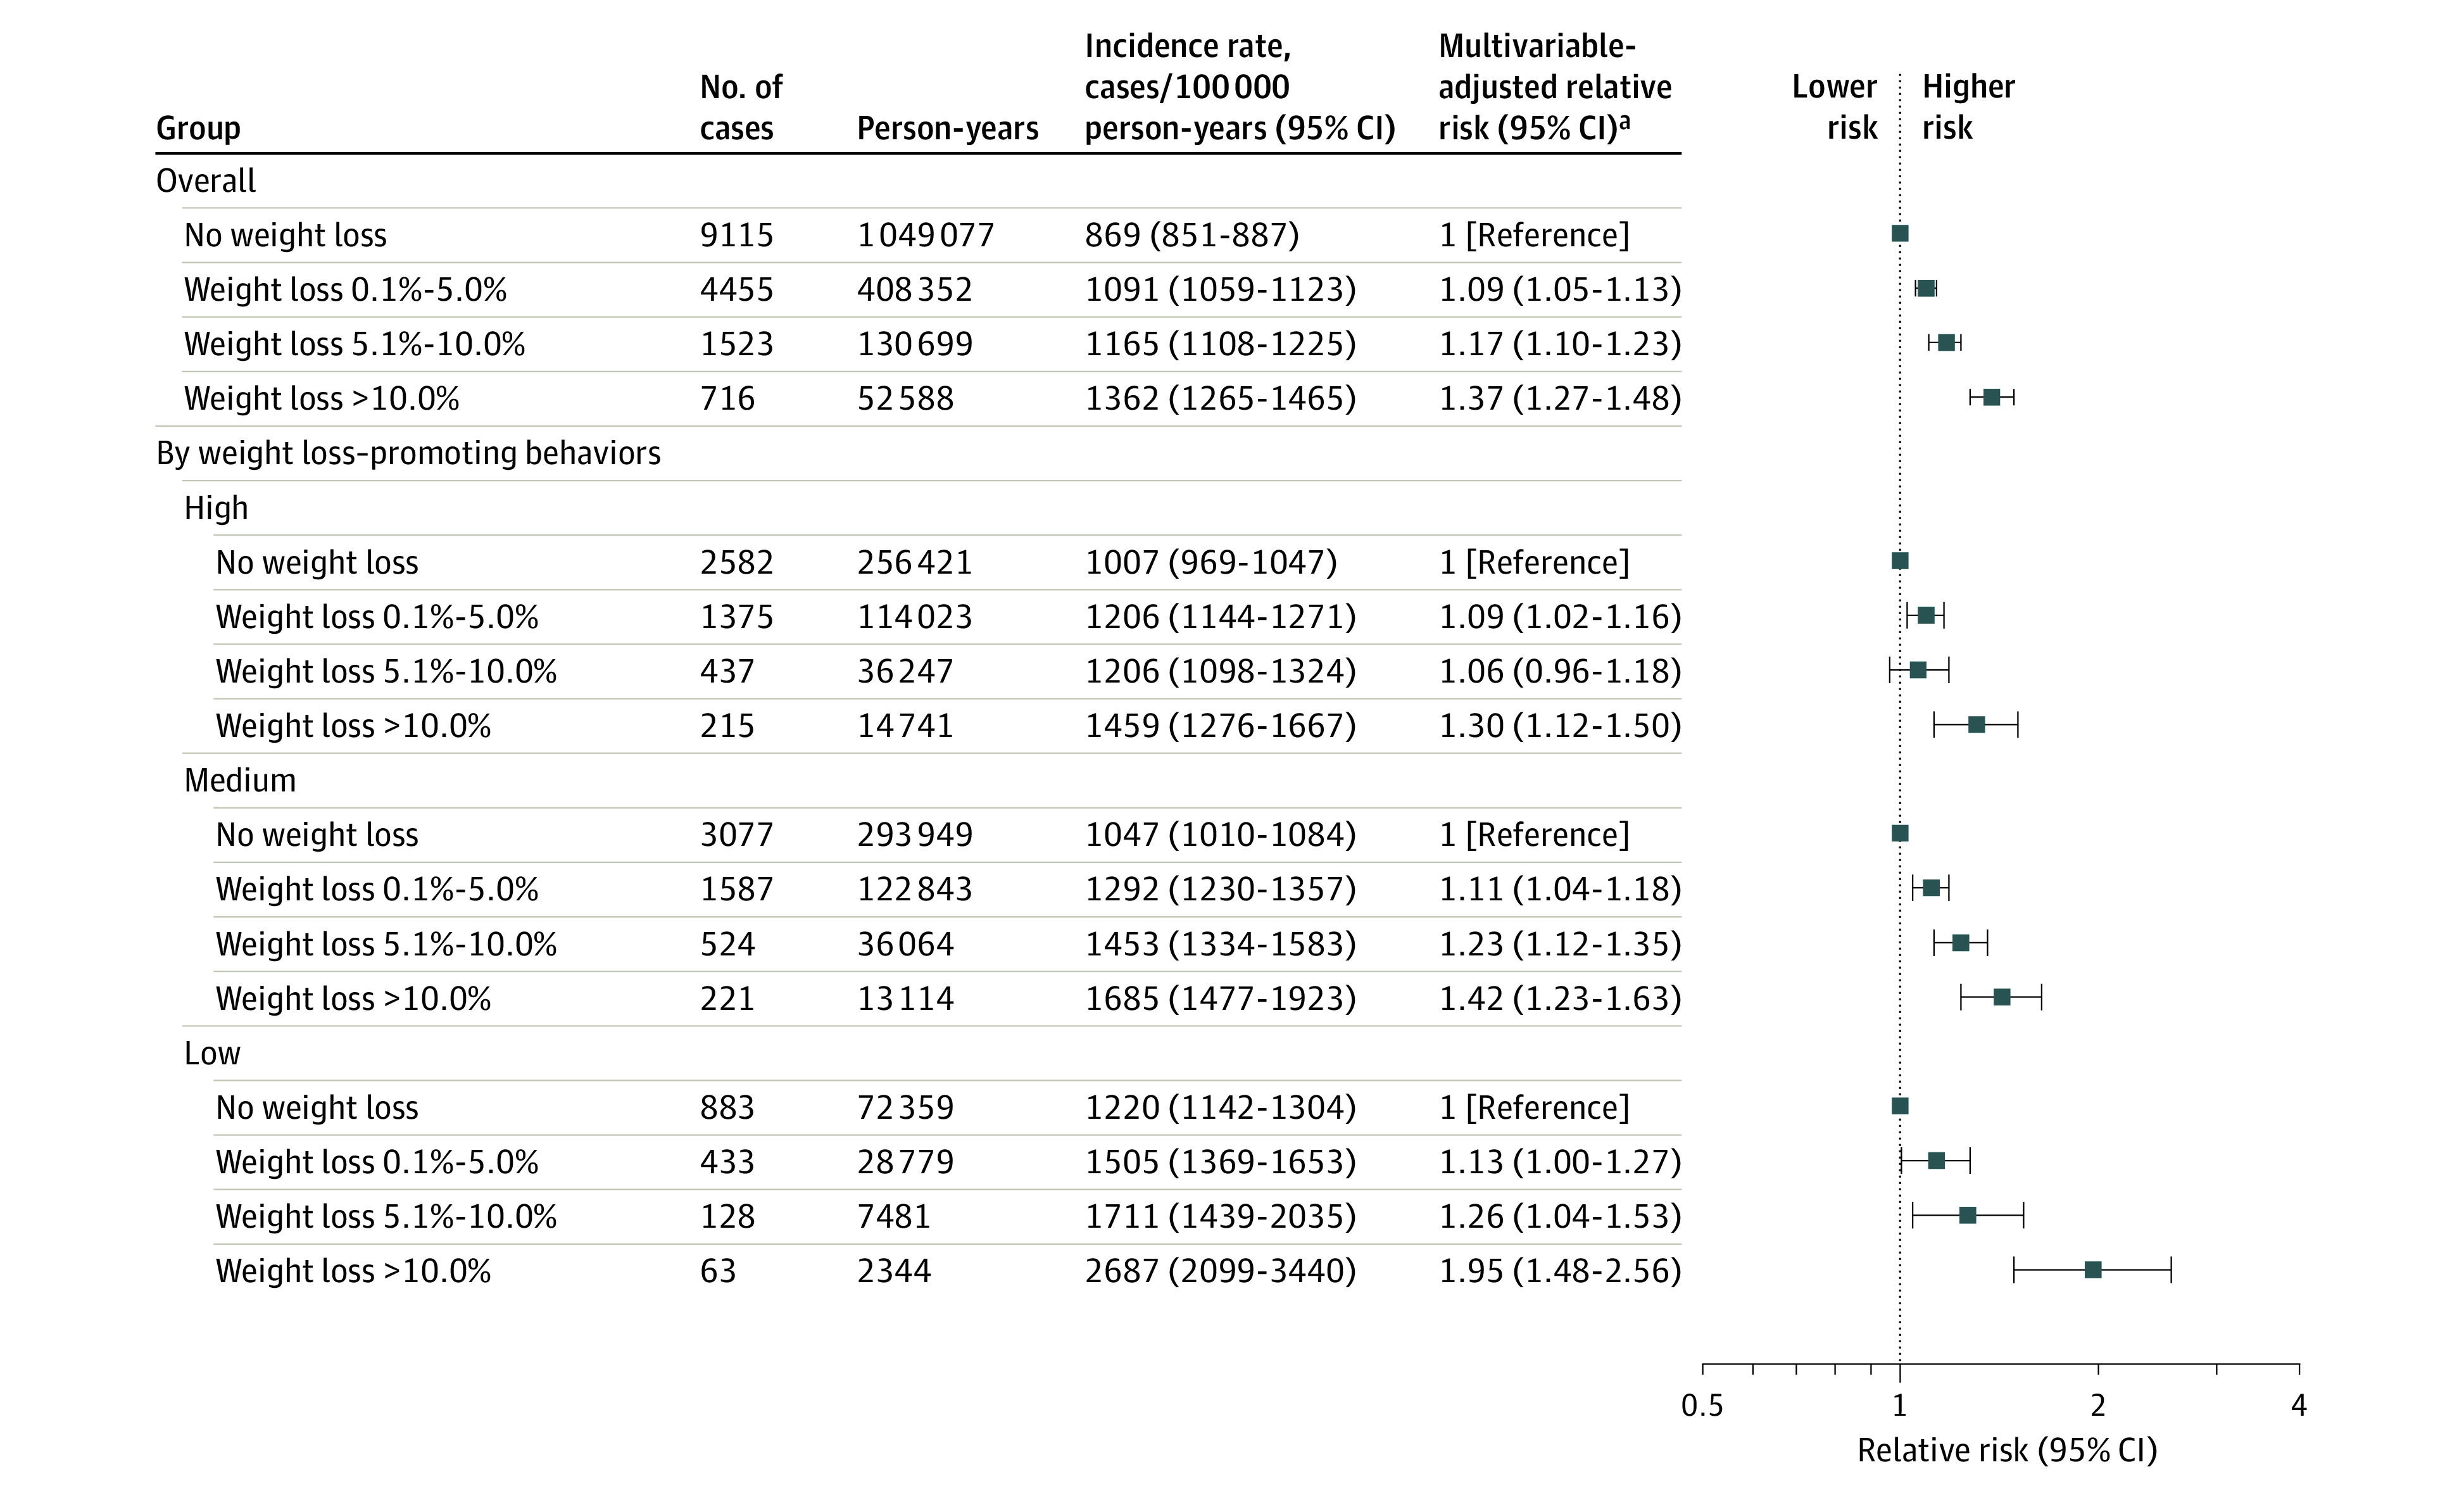
Weight loss–promoting behaviors (intentionality of weight loss) were categorized as (1) high if both physical activity (in metabolic equivalent task hours per week) and diet quality (based on Alternative Healthy Eating Index 2010 score) increased during consecutive questionnaires, (2) medium if only 1 of these increased (physical activity or diet quality score), and (3) low if neither increased. Intentionality of weight loss was assessed starting in 1988.
aIncluded age (in months), calendar year of the survey cycle, sex and cohort, race (White or non-White), family history of cancer (yes or no), smoking (never and <5, 5-19, 20-39, or ≥40 pack-years), duration since smoking cessation (current, <2.0 years, 2.0-3.9 years, 4.0-5.9 years, and never or quit ≥6.0 years ago), alcohol consumption (0 g/d, 0.1-4.9 g/d, 5.0-14.9 g/d, 15.0-29.9 g/d, or ≥30.0 g/d), multivitamin use (yes or no), physical activity in metabolic equivalent task hours per week (quintiles by sex), Alternative Healthy Eating Index 2010 score (excludes alcohol consumption and uses quintiles by sex), previous body mass index (calculated as weight in kilograms divided by height in meters squared; continuous variable), menopausal status and hormone therapy use in females (premenopausal, postmenopausal and never user, postmenopausal and past user, or postmenopausal and current user).
Compared with no recent weight loss, any recent weight loss of greater than 10.0% was significantly associated with higher rates of specific cancer diagnoses (Figure 2 and eTable 4 in Supplement 1). Cancer of the upper gastrointestinal tract (esophagus, stomach, liver, biliary tract, or pancreas) was particularly common among participants with recent weight loss; there were 173 cases/100 000 person-years for those with weight loss of greater than 10.0% of body weight compared with 36 cases/100 000 person-years for those without recent weight loss (between-group difference, 137 cases/100 000 person-years [95% CI, 101-172 cases/100 000 person-years]). For hematological types of cancer (non-Hodgkin lymphoma, multiple myeloma, and leukemia), there were 146 cases/100 000 person-years for those with weight loss of greater than 10.0% vs 66 cases/100 000 person-years for those without recent weight loss (between-group difference, 80 cases/100 000 person-years [95% CI, 47-113 cases/100 000 person-years]). For colorectal cancer, there were 141 cases/100 000 person-years for those with weight loss of greater than 10.0% vs 77 cases/100 000 person-years for those without recent weight loss (between-group difference, 63 cases/100 000 person-years [95% CI, 31-96 cases/100 000 person-years]). For lung cancer, there were 177 cases/100 000 person-years for those with weight loss of greater than 10.0% vs 72 cases/100 000 person-years for those without recent weight loss (between-group difference, 105 cases/100 000 person-years [95% CI, 69-141 cases/100 000 person-years]) (eTable 4 in Supplement 1). For these cancer types, higher incidence rates were identified as the magnitude of weight loss increased (eFigure 3 in Supplement 1). In contrast, no statistically significant associations were identified between recent weight loss and cancer of the breast, genital system, urinary system, brain, or melanoma (Figure 2 and eTable 4 in Supplement 1).
Figure 2. One-Year Relative Risk of Individual and Total Cancer Among Participants Who Experienced a Recent Weight Loss of Greater Than 10.0% of Body Weight.
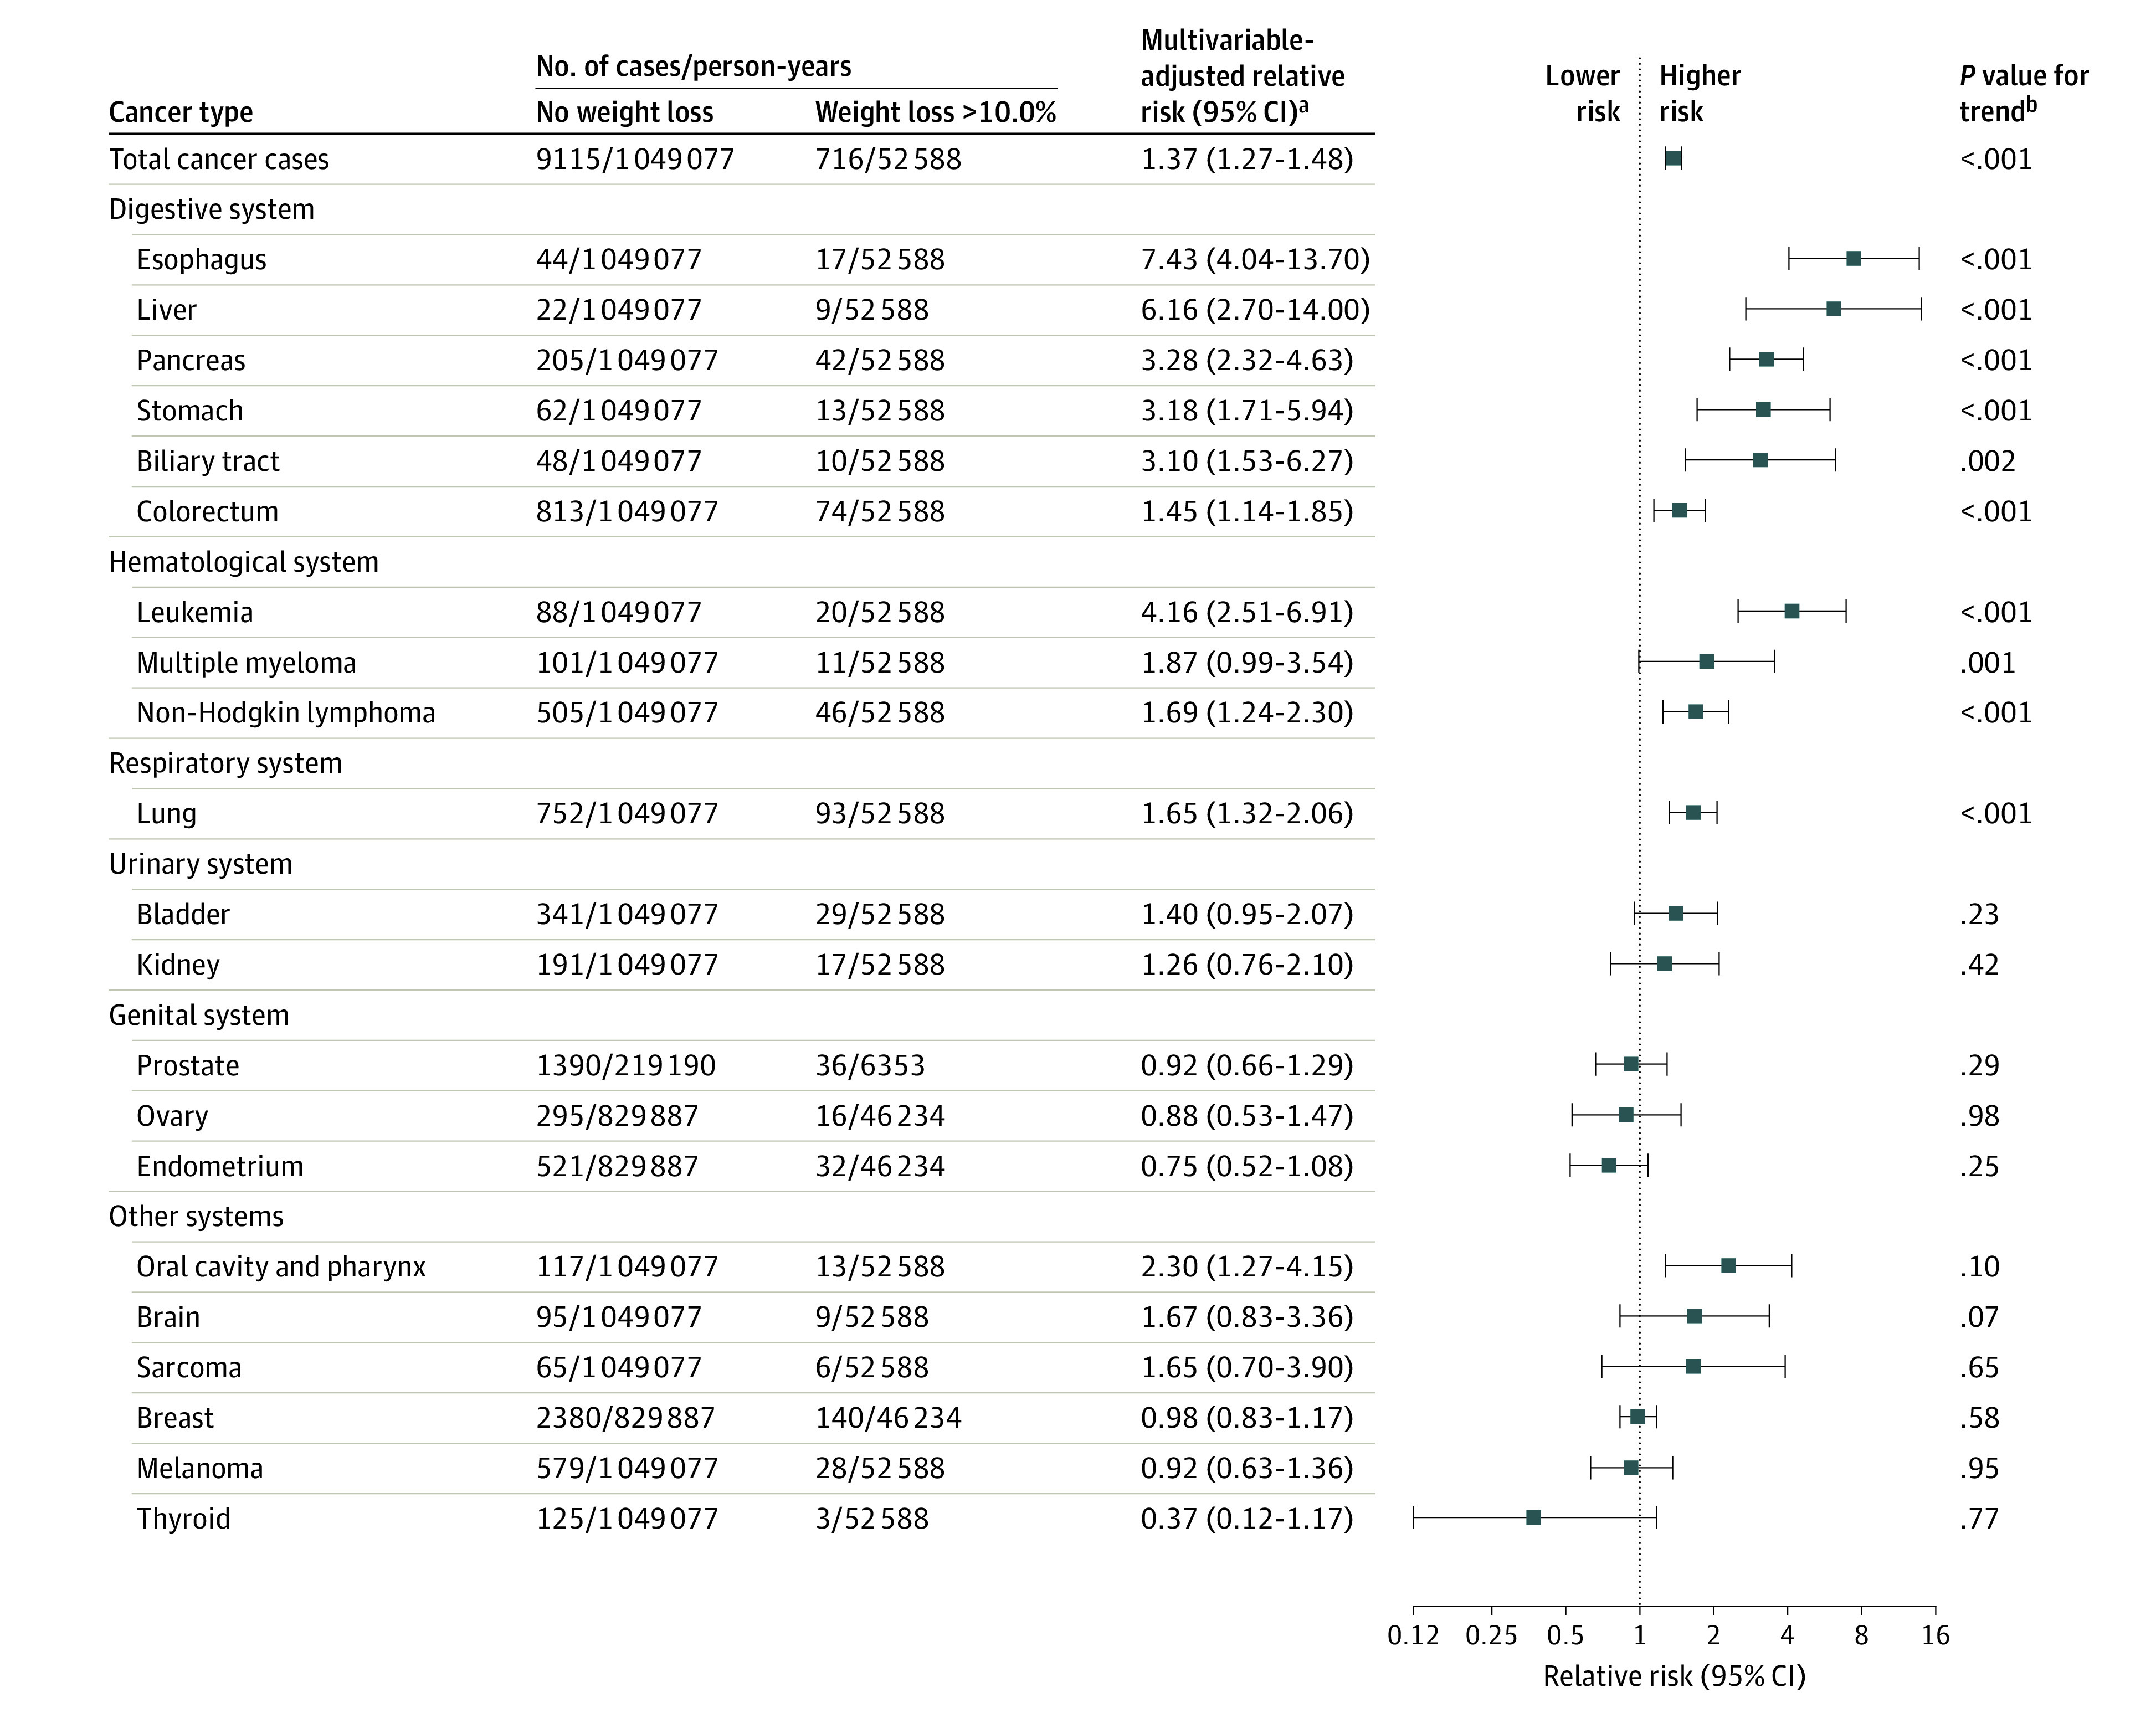
Individual cancer types within each system are ranked in descending order based on the multivariable-adjusted relative risk comparing recent weight loss of greater than 10.0% vs no weight loss.
aIncluded age (in months), calendar year of the survey cycle, sex and cohort, race (White or non-White), family history of cancer (yes or no), smoking (never and <5, 5-19, 20-39, or ≥40 pack-years), duration since smoking cessation (current, <2.0 years, 2.0-3.9 years, 4.0-5.9 years, and never or quit ≥6.0 years ago), alcohol consumption (0 g/d, 0.1-4.9 g/d, 5.0-14.9 g/d, 15.0-29.9 g/d, or ≥30.0 g/d), multivitamin use (yes or no), physical activity in metabolic equivalent task hours per week (quintiles by sex), Alternative Healthy Eating Index 2010 score (excludes alcohol consumption and uses quintiles by sex), previous body mass index (calculated as weight in kilograms divided by height in meters squared; continuous variable), menopausal status and hormone therapy use in females (premenopausal, postmenopausal and never user, postmenopausal and past user, or postmenopausal and current user).
bCalculated using medians of weight change from each category (no weight loss, 0.1%-5.0% weight loss, 5.1%-10.0% weight loss, and >10.0% weight loss) in the regression model and the Wald test.
Compared with participants without recent weight loss, recent and greater total weight loss was significantly associated with higher 1-year relative risk of total cancer, upper gastrointestinal tract cancer, hematological cancer, colorectal cancer, and lung cancer (P < .001 for all comparisons; Figure 3). Associations between weight loss and total and individual cancer risk were similar when the analyses were stratified by sex and cohort (eTable 5 in Supplement 1). After excluding participants with major comorbidities diagnosed during the period of weight loss, the results were largely unchanged (eTable 6 in Supplement 1). The overall proportion of upper gastrointestinal tract, hematological, colorectal, and lung cancer cases was 48% among participants diagnosed with cancer who reported recent weight loss of greater than 10.0% compared with 31% among those diagnosed with cancer who had not experienced recent weight loss (between-group difference, 17% [95% CI, 12%-22%]; eFigure 4 in Supplement 1).
Figure 3. Percentage of Recent Weight Change and Relative Risk of Cancer During the Subsequent Year (1-12 Months) and Second Year (13-24 Months) After Reported Weight Change.
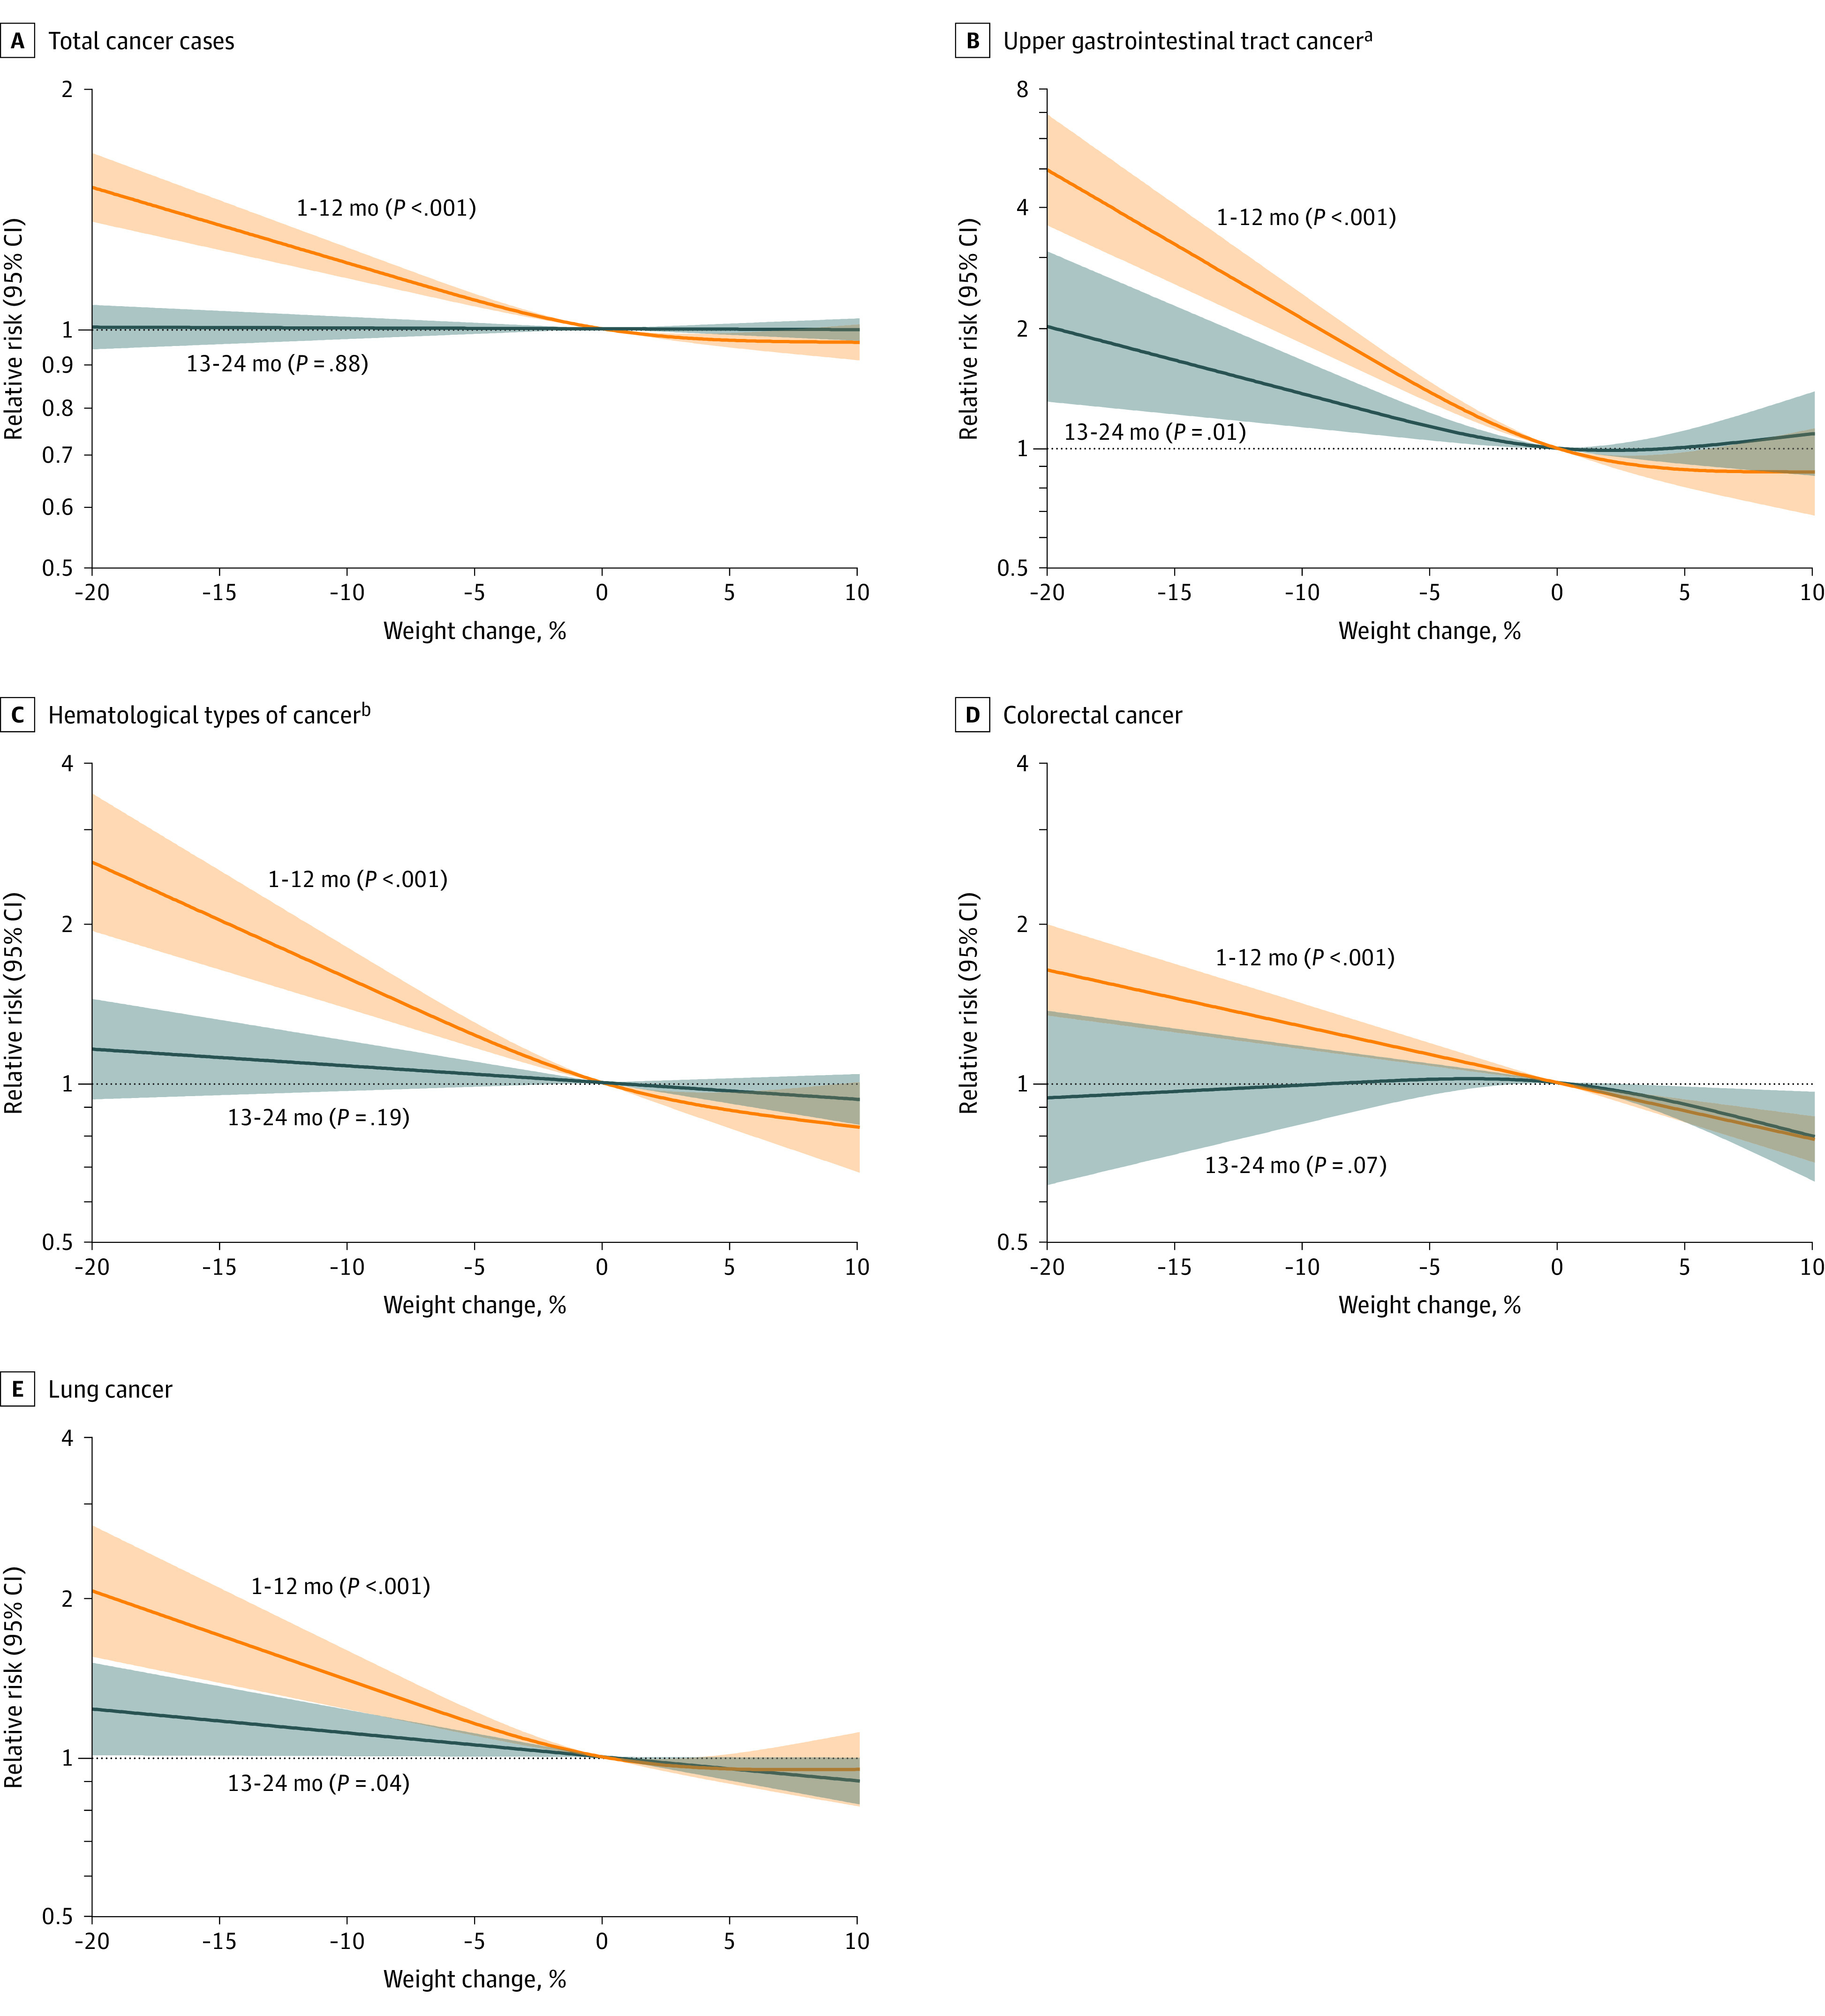
The shading indicates the 95% CIs. The P values indicate the significance of the overall relationship and were calculated using the likelihood ratio test.
aIncluded esophageal, stomach, liver, biliary tract, and pancreatic cancer.
bIncluded non-Hodgkin lymphoma, multiple myeloma, and leukemia.
Risk of Cancer by Proximity to Weight Loss
Risk of cancer diagnosis (total cancer, upper gastrointestinal tract cancer, hematological cancer, colorectal cancer, or lung cancer) was higher during the first 12 months compared with during the 13 to 24 months after reporting weight loss (Figure 3).
Combinations of recent weight loss magnitude and periods after report of weight loss were also evaluated. Although total cancer risk was highest within the first 6 months after report of greater than 10.0% weight loss, cancer risk was also higher among participants with 5.1% to 10.0% weight loss compared with those without recent weight loss (eFigure 5A and eTable 7 in Supplement 1). Higher cancer risk was also identified within the next 7 to 12 months after report of greater than 10.0% weight loss compared with those without recent weight loss (eFigure 5A and eTable 7 in Supplement 1). To further characterize the timing of weight loss prior to cancer diagnosis, 20-year BMI trends were constructed for individuals who developed cancer and age- and sex-matched controls who did not develop cancer (eFigure 5B in Supplement 1).
Recent Weight Change and Risk of Cancer Diagnosis by Cancer Stage
The percentages of patients who had cancer and greater than 5.0% weight loss among those diagnosed with localized cancer were similar to the percentages among those with advanced or metastatic diseases (eTable 8 in Supplement 1). For example, 21.5% of patients with localized disease vs 25.8% with advanced or metastatic disease presented with greater than 5.0% weight loss prior to diagnosis of an upper gastrointestinal tract cancer. Furthermore, the P value for heterogeneity was greater than .05 upon multivariable-adjusted competing risk regression, suggesting that weight loss prior to cancer diagnosis was not associated with a more advanced cancer stage at presentation (eTable 8 in Supplement 1).
Absolute Cancer Risk Estimates by Recent Weight Loss and Other Participant Characteristics
Absolute cancer risk was computed among participants aged 60 years or older (eTable 9 in Supplement 1) because this age cutoff has been suggested when deciding who should undergo cancer-directed investigations due to weight loss.5,10 In stratified analyses, cancer incidence rates by weight loss percentage were modified by pack-years of smoking and weight loss–promoting behaviors (eFigure 6 and eTable 10 in Supplement 1). Participants who lost weight and smoked had significantly higher cancer rates than those who lost weight but did not smoke (P < .05 for interaction). Compared with participants who lost weight and were in the high category for weight loss–promoting behaviors, those who lost weight but were in the low category for weight loss–promoting behaviors had significantly higher cancer rates (P < .05 for interaction).
The 1-year absolute risk of being diagnosed with cancer was 3.2% (95% CI, 2.4%-4.0%) among participants with weight loss of greater than 10.0% and who were in the low category for weight loss–promoting behaviors vs 1.3% (95% CI, 1.2%-1.3%) among those without recent weight loss (between-group difference, 1.9% [95% CI, 1.1%-2.7%]; P < .001) (Figure 4). Among all participants during the follow-up period, 1.6% met or exceeded the predefined 1-year absolute risk threshold of 3.0% for cancer (eFigure 7 in Supplement 1; the participant characteristics within these high-risk groups appear in eTable 11 in Supplement 1).
Figure 4. One-Year Absolute Risk of Cancer Among Individuals Aged 60 Years or Older by Recent Weight Change During the Past 2 Years.

aWeight loss–promoting behaviors (intentionality of weight loss) were categorized as (1) high if both physical activity (in metabolic equivalent task hours per week) and diet quality (based on Alternative Healthy Eating Index 2010 score) increased during consecutive questionnaires, (2) medium if only 1 of these increased (physical activity or diet quality score), and (3) low if neither increased. Intentionality of weight loss was assessed starting in 1988.
bAge of 70 years or older, male sex, or low category of weight loss–promoting behaviors.
Discussion
In 2 prospectively assessed populations including 157 474 participants who were followed up through 2016, recent weight loss was associated with an increased rate of cancer diagnosis during the subsequent 12 months compared with those without recent weight loss. Cancer diagnoses were more common among participants whose weight loss was classified as unintentional based on assessments of recent changes in physical activity and diet.
Although cancer risk was higher in participants with recent weight loss, many individual cancer types, including breast, genital, urinary, brain, and melanoma, were not associated with recent weight loss. Compared with participants without recent weight loss, weight loss of greater than 10.0% was associated with significantly increased risk for upper gastrointestinal tract, hematological, colorectal, and lung cancers. Most of the excess risk for these cancers occurred within 1 year after weight loss was identified, although a significantly higher risk was identified 1 to 2 years after weight loss, particularly for upper gastrointestinal tract cancers.
The amount of weight loss was similar among people with early-stage cancer compared with those with later stage cancer, suggesting that weight loss is identified during both early and advanced cancer stages. When considering the intentionality of weight loss (weight loss–promoting behaviors), individuals with recent weight loss had a higher risk of subsequent cancer diagnosis when the intentionality to lose weight was low, which was determined by the absence of increases in physical activity and diet quality. For individuals aged 60 years or older, recent weight loss of greater than 10.0% with low weight loss intentionality was associated with a 3.2% probability of being diagnosed with cancer during the subsequent 12 months.
Although weight loss is common, the evaluation of weight loss is complex and heterogeneous.10,26,27 Many conditions, in addition to cancer, can cause weight loss.26,27 Prior studies have led to the recommendation that individuals aged 60 years or older with unexplained weight loss should undergo evaluation for cancer.5,10 However, prior studies primarily used clinician-entered diagnosis codes for unexplained weight loss. Diagnosis codes do not allow evaluation of weight changes over time, depend on coding patterns in the medical record, and include a selected population of patients with access to timely medical evaluation.
Nicholson et al8 considered data on body weight collected from 43 302 outpatients who were followed up for a mean of 6.7 years. Although weight assessment frequency varied according to when patients sought clinical care and the intentionality of the weight loss was not measured, statistically significant associations were identified for weight loss of greater than 5.0% of body weight and multiple myeloma, pancreatic, gastroesophageal, and colorectal cancer.8 The rapidity of weight loss also appeared to be important in assessing cancer risk, with more rapid weight loss associated with higher cancer risks.8 A previous study4 reported that cancer diagnosis after weight loss typically occurred within 3 to 6 months after a diagnosis code for unexplained weight loss was used in the medical record. In the current study, an increased risk of cancer was detected during the 12 months after identification of recent weight loss by serial participant-reported assessments.
Limitations
This study has several limitations. First, all body weights were self-reported and not verified with objective measurement.
Second, the weights were reported biennially. More frequent weight measurements might have yielded a different outcome. Third, rapidity of weight loss could not be determined. Fourth, although the weight loss intentionality index has been used previously,15 it has not undergone formal validation.
Fifth, cancer-related symptoms and laboratory abnormalities that might occur concurrently with weight loss were not available. Sixth, participants were identified from 2 longitudinal populations in the US followed up on average for nearly 30 years. The results may not be generalizable to different regions of the world.
Seventh, participants were health professionals who may have been better educated about the symptoms of cancer or have better access to health care than the general population. Eighth, the data in these analyses were collected from 1978 to 2016 and may be less applicable to current practice.
Conclusion
Health professionals with weight loss within the prior 2 years had a significantly higher risk of cancer during the subsequent 12 months compared with those without recent weight loss. Cancer of the upper gastrointestinal tract was particularly common among participants with recent weight loss compared with those without recent weight loss.
Educational Objective: To identify the key insights or developments described in this article.
-
This work analyzed data from the Nurses’ Health Study and the Health Professionals Follow-Up Study to ascertain whether unintentional weight loss was associated with diagnosis of cancer within the following year. How was weight loss classified?
Any loss of greater than 10 kg of total body weight was considered unintentional weight loss.
Because weight gain is more typical with aging, any reduction in body weight between any pair of biennial questionnaires was considered weight loss.
Recent weight change was categorized into 4 groups based on percentage of body weight lost: no weight loss, loss of 0.1%-5.0%, loss of 5.1%-10.0%, and loss of greater than 10.0%.
-
With which cancer types was recent weight loss most associated?
Recent loss of weight in any amount was associated with increased incidence of breast and skin cancer during the subsequent year.
Recent weight loss of greater than 10% was most associated with higher rates of upper gastrointestinal tract, hematological, colorectal, and lung cancer.
Recent weight loss was associated with all cancer diagnoses regardless of type.
-
For participants without recent weight loss, the probability of being diagnosed with cancer during the following year was 1.3%. What was the probability of a diagnosis of cancer for those with the highest level of unintentional weight loss?
Among participants with the highest level of unintentional weight loss, 3.2% were diagnosed with cancer during the subsequent year.
Participants with the highest level of weight loss were also much more likely to engage in physical activity and dieting, making the weight loss intentional and leaving too few remaining participants to calculate a meaningful follow-up cancer risk for those with unintentional weight loss.
There was no difference in cancer diagnosis between participants who experienced unintentional weight loss and those who maintained steady weights.
eMethods
References
eFigure 1. Longitudinal design to assess recent weight change and cancer risk
eFigure 2. Cumulative number of total cancer cases diagnosed in each month within 1 year of recent weight change
eFigure 3. Age-adjusted relative risk (bar chart) and age-standardized incidence rate (line chart) of selected cancers within 1 year of recent weight change
eFigure 4. Cancer incidence spectrum by recent weight change
eFigure 5. Recent weight change and cancer risk by timeframe and trajectories of weight change
eFigure 6. Recent weight change and incidence rates for total and selected cancers among participants aged ≥60 years stratified by participant characteristics
eFigure 7. One-year absolute risk of total cancers among individuals aged ≥60 years by recent weight change and other participant characteristics
eTable 1. Age-specific incidence rates of total and individual cancers in the Nurses’ Health Study and the Health Professionals Follow-Up Study, compared to incidence rates in the US Surveillance, Epidemiology, and End Results Program
eTable 2. Age-adjusted characteristics of study participants according to the recent weight change
eTable 3. Recent weight change and 1-year risk of total cancers overall and by weight loss promoting behaviors
eTable 4. Recent weight change and 1-year risk of individual cancers and selected grouped cancers
eTable 5. Recent weight change and 1-year risk of total and individual cancers stratified by sex/cohort
eTable 6. Recent weight change and 1-year risk of total and individual cancers, excluding participants with recently diagnosed major comorbidities
eTable 7. Risk of total and selected cancers in the subsequent 1-6, 7-12, 13-24, or 25-36 months after recent weight change
eTable 8. Recent weight change and 1-year relative risk of selected cancers by cancer stage at diagnosis
eTable 9. Recent weight change and 1-year risk of total and selected cancers among participants aged ≥60 years
eTable 10. Recent weight change and incidence rates (95% CIs) for total and selected cancers among participants aged ≥60 years stratified by participant characteristics
eTable 11. High-risk individuals aged ≥60 years: 1-year absolute risk of total cancers >3.0% and number needed to evaluate to identify 1 cancer, by considering recent weight change and participant characteristics
Data sharing statement
References
- 1.Siegel RL, Miller KD, Wagle NS, Jemal A. Cancer statistics, 2023. CA Cancer J Clin. 2023;73(1):17-48. doi: 10.3322/caac.21763 [DOI] [PubMed] [Google Scholar]
- 2.Sung H, Ferlay J, Siegel RL, et al. Global Cancer Statistics 2020: GLOBOCAN estimates of incidence and mortality worldwide for 36 cancers in 185 countries. CA Cancer J Clin. 2021;71(3):209-249. doi: 10.3322/caac.21660 [DOI] [PubMed] [Google Scholar]
- 3.Koo MM, Swann R, McPhail S, et al. Presenting symptoms of cancer and stage at diagnosis: evidence from a cross-sectional, population-based study. Lancet Oncol. 2020;21(1):73-79. doi: 10.1016/S1470-2045(19)30595-9 [DOI] [PMC free article] [PubMed] [Google Scholar]
- 4.Nicholson BD, Hamilton W, Koshiaris C, Oke JL, Hobbs FDR, Aveyard P. The association between unexpected weight loss and cancer diagnosis in primary care: a matched cohort analysis of 65,000 presentations. Br J Cancer. 2020;122(12):1848-1856. doi: 10.1038/s41416-020-0829-3 [DOI] [PMC free article] [PubMed] [Google Scholar]
- 5.Nicholson BD, Hamilton W, O’Sullivan J, Aveyard P, Hobbs FR. Weight loss as a predictor of cancer in primary care: a systematic review and meta-analysis. Br J Gen Pract. 2018;68(670):e311-e322. doi: 10.3399/bjgp18X695801 [DOI] [PMC free article] [PubMed] [Google Scholar]
- 6.Lai SW, Lin CL, Liao KF. Weight loss might be an early clinical manifestation of undiagnosed cancer: a nation-based cohort study. Biomedicine (Taipei). 2018;8(4):25. doi: 10.1051/bmdcn/2018080425 [DOI] [PMC free article] [PubMed] [Google Scholar]
- 7.Hue JJ, Sugumar K, Kyasaram RK, et al. Weight loss as an untapped early detection marker in pancreatic and periampullary cancer. Ann Surg Oncol. 2021;28(11):6283-6292. doi: 10.1245/s10434-021-09861-8 [DOI] [PubMed] [Google Scholar]
- 8.Nicholson BD, Thompson MJ, Hobbs FDR, et al. Measured weight loss as a precursor to cancer diagnosis: retrospective cohort analysis of 43 302 primary care patients. J Cachexia Sarcopenia Muscle. 2022;13(5):2492-2503. doi: 10.1002/jcsm.13051 [DOI] [PMC free article] [PubMed] [Google Scholar]
- 9.Shephard EA, Neal RD, Rose PW, Walter FM, Hamilton W. Symptoms of adult chronic and acute leukaemia before diagnosis: large primary care case-control studies using electronic records. Br J Gen Pract. 2016;66(644):e182-e188. doi: 10.3399/bjgp16X683989 [DOI] [PMC free article] [PubMed] [Google Scholar]
- 10.Nicholson BD, Aveyard P, Hamilton W, Hobbs FDR. When should unexpected weight loss warrant further investigation to exclude cancer? BMJ. 2019;366:l5271. doi: 10.1136/bmj.l5271 [DOI] [PubMed] [Google Scholar]
- 11.Nicholson BD, Aveyard P, Koshiaris C, et al. Combining simple blood tests to identify primary care patients with unexpected weight loss for cancer investigation: clinical risk score development, internal validation, and net benefit analysis. PLoS Med. 2021;18(8):e1003728. doi: 10.1371/journal.pmed.1003728 [DOI] [PMC free article] [PubMed] [Google Scholar]
- 12.Colditz GA, Manson JE, Hankinson SE. The Nurses’ Health Study: 20-year contribution to the understanding of health among women. J Womens Health. 1997;6(1):49-62. doi: 10.1089/jwh.1997.6.49 [DOI] [PubMed] [Google Scholar]
- 13.Rimm EB, Giovannucci EL, Willett WC, et al. Prospective study of alcohol consumption and risk of coronary disease in men. Lancet. 1991;338(8765):464-468. doi: 10.1016/0140-6736(91)90542-W [DOI] [PubMed] [Google Scholar]
- 14.Rimm EB, Stampfer MJ, Colditz GA, Chute CG, Litin LB, Willett WC. Validity of self-reported waist and hip circumferences in men and women. Epidemiology. 1990;1(6):466-473. doi: 10.1097/00001648-199011000-00009 [DOI] [PubMed] [Google Scholar]
- 15.Yuan C, Babic A, Khalaf N, et al. Diabetes, weight change, and pancreatic cancer risk. JAMA Oncol. 2020;6(10):e202948. doi: 10.1001/jamaoncol.2020.2948 [DOI] [PMC free article] [PubMed] [Google Scholar]
- 16.Yue Y, Yuan C, Wang DD, et al. Reproducibility and validity of diet quality scores derived from food-frequency questionnaires. Am J Clin Nutr. 2022;115(3):843-853. doi: 10.1093/ajcn/nqab368 [DOI] [PMC free article] [PubMed] [Google Scholar]
- 17.Pernar CH, Chomistek AK, Barnett JB, et al. Validity and relative validity of alternative methods of assessing physical activity in epidemiologic studies: findings from the Men’s Lifestyle Validation Study. Am J Epidemiol. 2022;191(7):1307-1322. doi: 10.1093/aje/kwac051 [DOI] [PMC free article] [PubMed] [Google Scholar]
- 18.Ward E, Jemal A, Cokkinides V, et al. Cancer disparities by race/ethnicity and socioeconomic status. CA Cancer J Clin. 2004;54(2):78-93. doi: 10.3322/canjclin.54.2.78 [DOI] [PubMed] [Google Scholar]
- 19.Bilbao-Garay J, Barba R, Losa-García JE, et al. Assessing clinical probability of organic disease in patients with involuntary weight loss: a simple score. Eur J Intern Med. 2002;13(4):240-245. doi: 10.1016/S0953-6205(02)00032-8 [DOI] [PubMed] [Google Scholar]
- 20.Amorim LD, Cai J. Modelling recurrent events: a tutorial for analysis in epidemiology. Int J Epidemiol. 2015;44(1):324-333. doi: 10.1093/ije/dyu222 [DOI] [PMC free article] [PubMed] [Google Scholar]
- 21.Anderson RN, Rosenberg HM. Age standardization of death rates: implementation of the year 2000 standard. Natl Vital Stat Rep. 1998;47(3):1-16, 20. [PubMed] [Google Scholar]
- 22.Durrleman S, Simon R. Flexible regression models with cubic splines. Stat Med. 1989;8(5):551-561. doi: 10.1002/sim.4780080504 [DOI] [PubMed] [Google Scholar]
- 23.Fine JP, Gray RJ. A proportional hazards model for the subdistribution of a competing risk. J Am Stat Assoc. 1999;94(446):496-509. doi: 10.1080/01621459.1999.10474144 [DOI] [Google Scholar]
- 24.National Institute for Health and Care Excellence . Suspected cancer: recognition and referral (NG12). Accessed January 1, 2023. https://www.nice.org.uk/guidance/ng12/resources/suspected-cancer-recognition-and-referral-pdf-1837268071621 [PubMed]
- 25.DerSimonian R, Laird N. Meta-analysis in clinical trials. Control Clin Trials. 1986;7(3):177-188. doi: 10.1016/0197-2456(86)90046-2 [DOI] [PubMed] [Google Scholar]
- 26.Wong CJ. Involuntary weight loss. Med Clin North Am. 2014;98(3):625-643. doi: 10.1016/j.mcna.2014.01.012 [DOI] [PubMed] [Google Scholar]
- 27.McMinn J, Steel C, Bowman A. Investigation and management of unintentional weight loss in older adults. BMJ. 2011;342:d1732. doi: 10.1136/bmj.d1732 [DOI] [PubMed] [Google Scholar]
Associated Data
This section collects any data citations, data availability statements, or supplementary materials included in this article.
Supplementary Materials
eMethods
References
eFigure 1. Longitudinal design to assess recent weight change and cancer risk
eFigure 2. Cumulative number of total cancer cases diagnosed in each month within 1 year of recent weight change
eFigure 3. Age-adjusted relative risk (bar chart) and age-standardized incidence rate (line chart) of selected cancers within 1 year of recent weight change
eFigure 4. Cancer incidence spectrum by recent weight change
eFigure 5. Recent weight change and cancer risk by timeframe and trajectories of weight change
eFigure 6. Recent weight change and incidence rates for total and selected cancers among participants aged ≥60 years stratified by participant characteristics
eFigure 7. One-year absolute risk of total cancers among individuals aged ≥60 years by recent weight change and other participant characteristics
eTable 1. Age-specific incidence rates of total and individual cancers in the Nurses’ Health Study and the Health Professionals Follow-Up Study, compared to incidence rates in the US Surveillance, Epidemiology, and End Results Program
eTable 2. Age-adjusted characteristics of study participants according to the recent weight change
eTable 3. Recent weight change and 1-year risk of total cancers overall and by weight loss promoting behaviors
eTable 4. Recent weight change and 1-year risk of individual cancers and selected grouped cancers
eTable 5. Recent weight change and 1-year risk of total and individual cancers stratified by sex/cohort
eTable 6. Recent weight change and 1-year risk of total and individual cancers, excluding participants with recently diagnosed major comorbidities
eTable 7. Risk of total and selected cancers in the subsequent 1-6, 7-12, 13-24, or 25-36 months after recent weight change
eTable 8. Recent weight change and 1-year relative risk of selected cancers by cancer stage at diagnosis
eTable 9. Recent weight change and 1-year risk of total and selected cancers among participants aged ≥60 years
eTable 10. Recent weight change and incidence rates (95% CIs) for total and selected cancers among participants aged ≥60 years stratified by participant characteristics
eTable 11. High-risk individuals aged ≥60 years: 1-year absolute risk of total cancers >3.0% and number needed to evaluate to identify 1 cancer, by considering recent weight change and participant characteristics
Data sharing statement