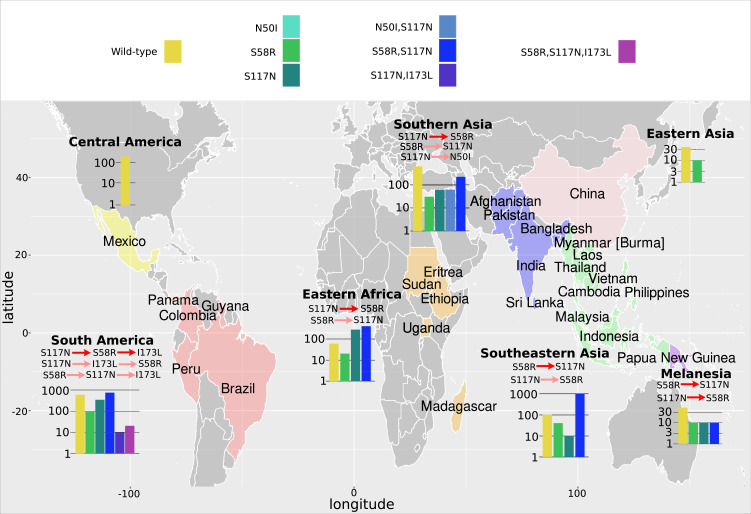
Figure 4. The P. vivax dihydrofolate reductase (PvDHFR) isolate data was grouped into seven geographical areas: Central America, South America, Eastern Africa, Southern Asia, Eastern Asia, Southeastern Asia, and Melanesia.
The bar charts display the frequency (log scale) of the combinations of the four mutations N50I, S58R, S117N, and I173L. The frequency data has been multiplied by a factor of 10 to enable clear identification of those mutations occurring in one isolate only. The most likely evolutionary trajectory inferred from the frequency of combinations are included above the corresponding frequency chart from which the pathways were inferred indicated by mutations separated by dark red arrows. Alternative pathways are indicated by mutations separated by light red arrows. Where only single mutations are present a pathway is not inferred.

