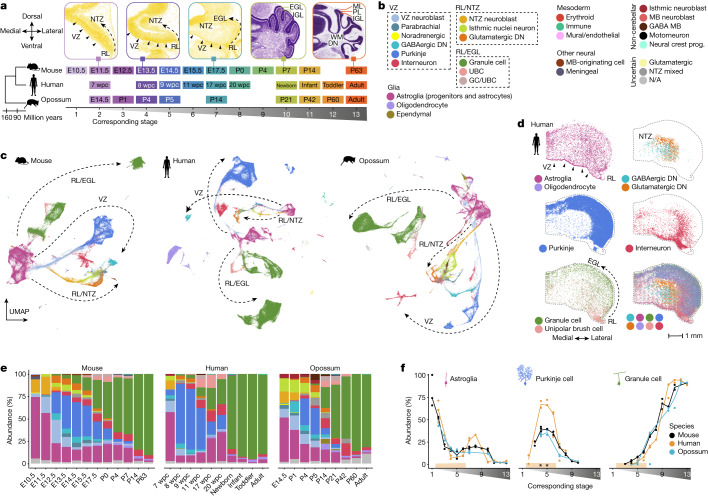
Fig. 1. Atlases of cerebellum development across mammals.
a, Bottom, stages sampled in mouse, human and opossum, aligned across species. Top, coronal sections of the mouse cerebellum15 stained with HP Yellow or Nissl. DN, deep nuclei; EGL, external granule cell layer; IGL, internal granule cell layer; ML, molecular layer; NTZ, nuclear transitory zone; PL, Purkinje cell layer; RL, rhombic lip; WM, white matter. b, The detected cell types, grouped by their developmental origin. MB, midbrain; N/A, not available. c, Uniform manifold approximation and projection (UMAP) of 115,282 mouse, 180,956 human and 99,498 opossum cells coloured by cell type. Arrows indicate the broad neuronal lineages. d, Mapping of the main cerebellar cell types in the 12 wpc human cerebellum by alignment of the multiplexed smFISH data with 11 wpc snRNA-seq data. e,f, Relative cell-type abundances across developmental stages in the whole datasets (e) or among the cerebellar cells (f). For adult human, only data from cerebellar lobes is included. In c–e, colours are as in b. In f, stages are aligned as in a, the line denotes the median of biological replicates, orange shading shows stages with representative sampling in human, and asterisks mark differences in relative abundances compared with mouse and opossum. Panel a is from the Allen Mouse Brain Atlas15.

