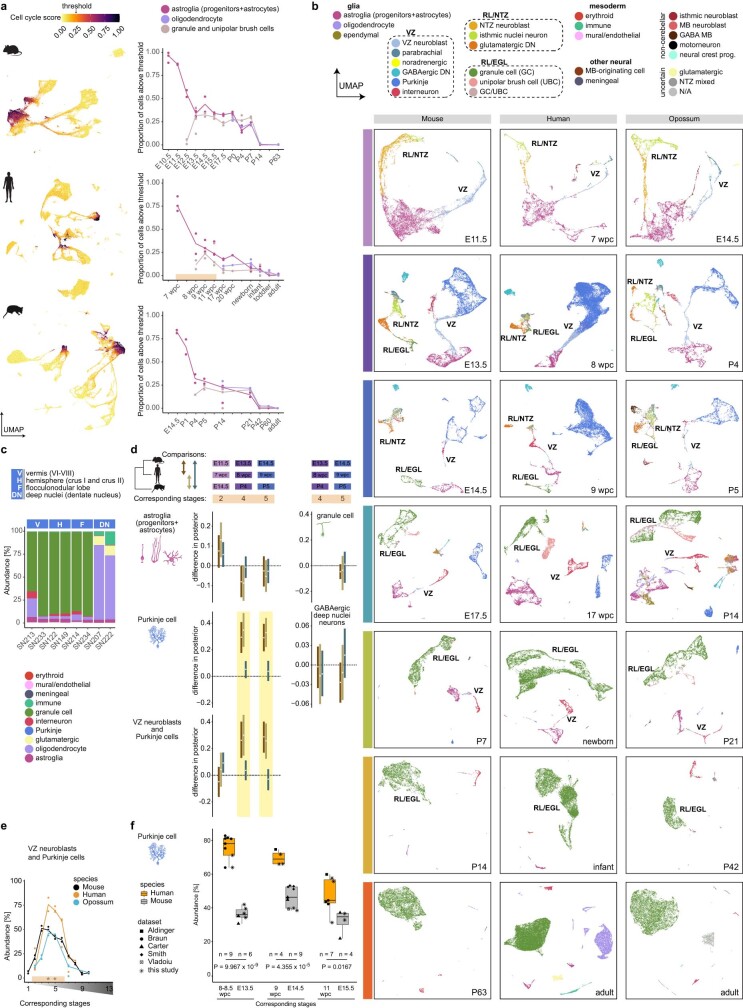
Extended Data Fig. 7. Dynamics of cell type abundances across development.
a, UMAPs of mouse, human and opossum cells coloured by cell cycle score (left) and the proportion of cells (median across biological replicates) above the threshold score value (0.25) among astroglia, oligodendrocytes, and granule and unipolar brush cells (right). The stages are aligned as shown in Fig. 1a. Orange shading marks stages with representative sampling in human. b, Individual developmental stage UMAPs of mouse, human and opossum cells coloured by their cell type. Only the stages with correspondences in all studied species are shown. Labels indicate the broad neuronal lineages. c, Relative cell type abundances in individual adult human samples from different regions of the cerebellum. d, Hierarchical Bayes model analysis of differences in the relative cell type abundances across species at corresponding developmental stages. Difference in posterior (y-axes) shows modelled proportion differences between pairs of species (comparisons); 0 indicates no shift in proportions (dotted line). The modelled differences are summarized as 95% highest density intervals (HDI95; lines) for each cell type at developmental stages (x-axes; depicted on top) where at least 50 cells were present. Only corresponding stages with representative sampling in human were considered. Differences in the relative abundances were called (yellow shading) when HDI95 of at least two comparisons did not overlap 0 (e.g., a human-specific change is assumed when HDI95 of human versus mouse and human versus opossum comparisons does not overlap 0, and HDI95 of mouse versus opossum comparison overlaps 0). e, Relative abundances of cells annotated as Purkinje cells or VZ neuroblasts across developmental stages. VZ neuroblasts and Purkinje cells were analysed together to exclude the effect of possible biases in the annotation between the three species. Stages are aligned as in Fig.1a, the line indicates the median of biological replicates, orange shading marks stages with representative sampling in human, and asterisks indicate differences in the relative abundances in human compared to mouse and opossum. f, Purkinje cell relative abundances in available human and mouse cerebellum datasets10,11,13,21,22. The estimation of abundances is based on the annotations reported in the original studies, except for ref. 22, where cell type annotations were not provided in the original study and were instead transferred from our human dataset (Supplementary Information). P values from Welch tests. DN, deep nuclei; EGL, external granule cell layer; MB, midbrain; NTZ, nuclear transitory zone; RL, rhombic lip; UBC, unipolar brush cells; UMAP, Uniform Manifold Approximation and Projection; VZ, ventricular zone; wpc, weeks post conception.

