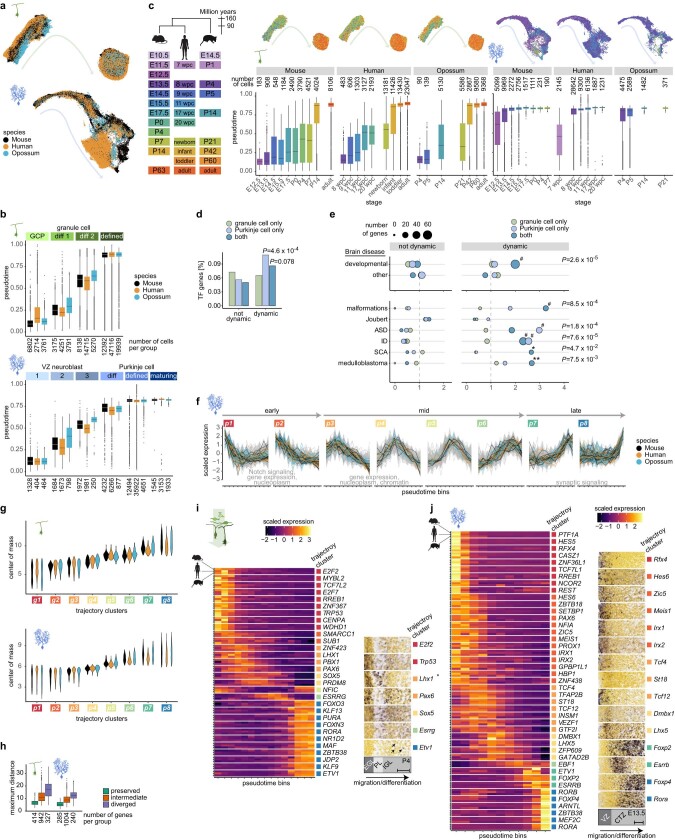
Extended Data Fig. 9. Gene expression trajectories across neuronal differentiation.
a, UMAPs of mouse, human and opossum cells assigned to the granule cell (top) or Purkinje cell (bottom) lineage and integrated across species. Cells are coloured by species. b, Pseudotime values across cell state categories for granule (top) and Purkinje (bottom) cell lineage. Number of cells per group is indicated below the axis. c, Pseudotime values across developmental stages in the mouse, human and opossum datasets for granule (left) and Purkinje (right) cell lineage. Number of cells per group is indicated above the boxplots. Stage correspondences are shown on the left and the integrated UMAPs plotted per species and coloured by stages at the top. d, Percentage of transcription factor genes across gene sets as in Fig. 3e. Adjusted P values, two-sided binomial test. e, Enrichment of disease-associated genes for genes dynamic or non-dynamic across differentiation of granule cells, Purkinje cells, or both neuron types in all species. Top: inherited brain disease genes were split into two groups based on overlap with developmental disease genes41. Bottom: neurodevelopmental and neurodegenerative diseases13, and malignancies42 directly linked to cerebellar function and cell types. Adjusted *P < 0.1, *P < 0.01, #P < 10−4, two-sided binomial test. f, Clusters of gene expression trajectories across Purkinje cell differentiation. Clusters (p1-p8) are ordered from early to late differentiation based on the mean center-of-mass values of the confident cluster members’ trajectories. Strongly preserved trajectories of the orthologues are highlighted with colours. Examples of enriched gene ontology categories for the genes with preserved trajectories are indicated for pairs of clusters. g, Centre-of-mass values of individual trajectories across granule (top) and Purkinje (bottom) cell trajectory clusters. h, Maximum dynamic time warping aligned distance between the orthologues belonging to different trajectory conservation groups. Number of genes per group is indicated below the axis. i, j, Expression of transcription factor genes with strongly preserved trajectories across granule (i) and Purkinje cell (j) differentiation. Scaled expression across pseudotime bins is shown on the left and RNA in situ hybridization data15 on the right. Areas from sagittal sections of P4 cerebellar cortex in lobule III (i) or mouse E13.5 cerebellar primordia (j) counterstained with HP Yellow are shown. Schemes of layers in the respective areas are at the bottom. Arrows in i point to rare positive cells. *Lhx1 is additionally expressed in Purkinje cells. Scale bars: 50 μm. In b, c and h, boxes represent the interquartile range, whiskers extend to extreme values within 1.5 times the interquartile range from the box, and line denotes the median. ASD, autism spectrum disorders; CTZ, cortical transitory zone; diff, differentiating; EGL, external granule cell layer; ID, intellectual disability; IGL, internal granule cell layer; PL, Purkinje cell layer; SCA, spinocerebellar ataxia; VZ, ventricular zone.

