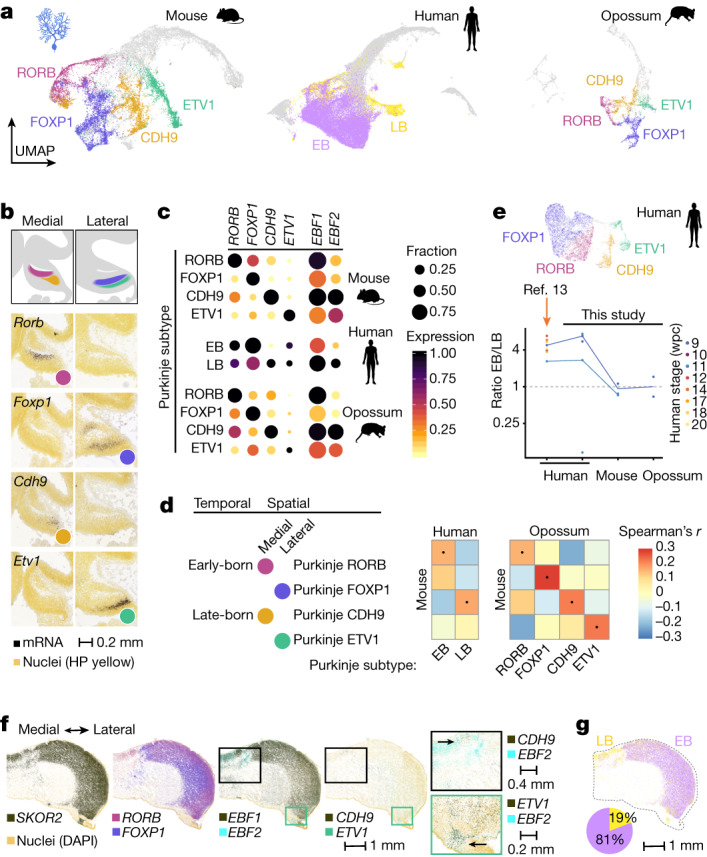
Fig. 2. Spatiotemporally defined Purkinje cell subtypes.

a, UMAPs of 23,255 mouse, 49,399 human and 8,973 opossum cells assigned to the Purkinje cell lineage. Colours highlight the developmental subtypes. EB, early born; LB, late born. b, E13.5 mouse cerebellum RNA in situ hybridization data15 for Purkinje subtype markers. Medial and lateral sagittal sections are shown. c, Expression of key markers in mouse, human and opossum Purkinje subtypes. Dot size indicates the fraction of cells expressing a gene, and colour shows the mean expression level scaled by species and gene. d, Cross-species Spearman’s correlation coefficients between orthologous variable gene (n = 107) expression profiles from Purkinje subtypes. Dots denote the highest correlation for each column. e, Top, UMAP of 14,246 human 9–20 wpc Purkinje cells from a published dataset13 with cells coloured by subtype. Bottom, ratio of early-born to late-born Purkinje cell numbers in fetal samples. Biological replicates are shown with dots, and lines indicate stage median. Corresponding stages (Fig. 1a) are shown for mouse and opossum. f, Detection of Purkinje cell markers in the 12 wpc human cerebellum by smFISH. Close-up views are indicated with rectangles; arrows point to double-positive regions. g, Mapping of the early- and late-born Purkinje cells in the 12 wpc human cerebellum by alignment of the smFISH data with 11 wpc snRNA-seq data. The pie chart indicates the percentage of cells by group.
