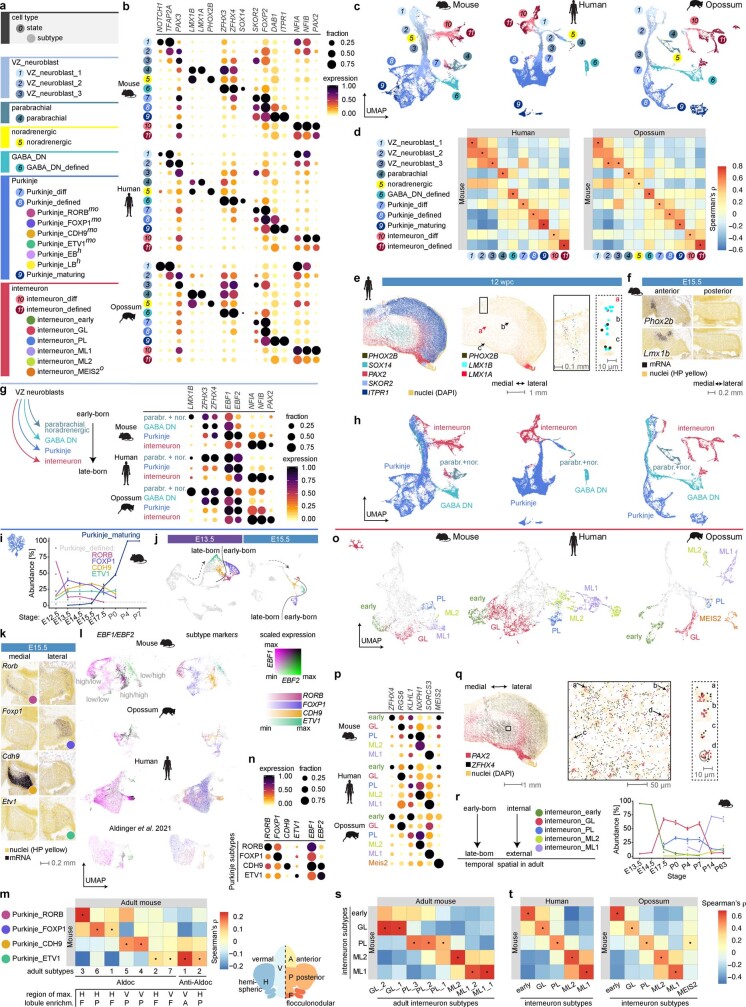
Extended Data Fig. 3. Atlas of the VZ cell types.
a, Cell types, states and subtypes of neurons born at the ventricular zone. For the categories not detected in all species, superscript text specifies the dataset(s) where a category is present: h, human; m, mouse; o, opossum. b, Expression of key marker genes in the VZ-associated cell states in mouse, human and opossum. c, Uniform Manifold Approximation and Projection (UMAP) of 37,391 mouse, 61,585 human and 22,674 opossum VZ-derived cells coloured by their state. Colours and numbers as in a. d, Spearman’s correlation coefficients between orthologous variable gene (n = 208) expression profiles from mouse, human and opossum VZ-associated cell states. e, Human 12 wpc cerebellum smFISH data for markers of the VZ cell types. Expression of marker genes of GABAergic deep nuclei neurons (SOX14), Purkinje cells (SKOR2, ITPR1) and interneurons (PAX2) is detected in expected domains (left). Only a few cells outside the rhombic lip and a region with artifactual signals (solid line box) are co-labelled by the markers of the parabrachial (LMX1A, LMX1B; red arrow) and noradrenergic (PHOX2B, LMX1B; black arrows) cell types in this section (right), which originates from the posterior cerebellum. This is in line with the expression of the parabrachial and noradrenergic cell markers in the anterior cerebellum in mouse, as shown in f. f, Spatial distribution of parabrachial and noradrenergic cell types in mouse E15.5 cerebellar primordium based on RNA in situ hybridization data15 for marker genes. Anterior and posterior coronal sections are shown. g, Expression of key marker genes in the VZ neuroblasts split into lineages as in h in mouse, human and opossum. h, UMAPs as in c coloured by cell type lineages. VZ neuroblasts were split into lineages giving rise to the different mature cell types based on the information about their developmental stage and marker gene expression. i, Relative abundances of cells in the defined and maturing Purkinje cell categories (median of biological replicates) across developmental stages in mouse. The dashed line marks 5%. j, UMAPs of all mouse E13.5 and E15.5 cells, Purkinje subtypes are highlighted with colours. The dashed arrow directs from less mature cells (VZ neuroblasts) to more mature cells (defined Purkinje cells). The line separates early- and late-born Purkinje subtypes. k, Spatial distribution of Purkinje subtypes in E15.5 mouse cerebellar primordium based on RNA in situ hybridization data15 for subtype marker genes. Medial and lateral sagittal sections are shown. l, UMAPs showing expression of key marker genes in the subtype-assigned Purkinje cells in our mouse, opossum, and human datasets, and in the reanalysed ref. 13 dataset. Scaled expression of EBF1 and EBF2 is shown at the left to highlight the combinatorial patterns; scaled expression of subtype markers RORB, FOXP1, CDH9 and ETV1 is shown at the right with each cell coloured according to the gene that has the highest scaled expression level. For visualization purposes, the scales were capped at 95th quantile for RORB, FOXP1, CDH9, EBF1 and EBF2, and 99th quantile for ETV1. m, Spearman’s correlation coefficients between shared variable gene (n = 337) expression profiles from mouse Purkinje subtypes from this study and adult subtypes described in ref. 7. For each adult subtype the position of the lobule showing the highest enrichment7 along the mediolateral and anteroposterior axes is indicated. n, Dot plot showing expression of key marker genes in the Purkinje subtypes in the reanalysed ref. 13 dataset. o, UMAPs of 6,422 mouse, 7,640 human and 5,815 opossum GABAergic interneurons coloured by their subtype. Subtype colours as in a; neuroblasts and differentiating interneurons are in grey. p, Expression of key marker genes in the interneuron subtypes in mouse, human and opossum. q, Human 12 wpc cerebellum smFISH data for markers of the interneuron “early” subtype. Cells co-expressing PAX2 and ZFHX4 are detected in the region of the nuclear transitory zone. r, Interneuron subtype relative abundances (median of biological replicates) across developmental stages in mouse. The temporal order of interneuron subtype emergence gives rise to the spatial order in the adult cerebellum. s, Spearman’s correlation coefficients between shared variable gene (n = 329) expression profiles from mouse interneuron subtypes from this study and adult subtypes described in ref. 7. t, Spearman’s correlation coefficients between orthologous variable gene (n = 198) expression profiles from mouse, human and opossum interneuron subtypes. In b,g,n and p, dot size and colour indicate the fraction of cells expressing each gene and the mean expression level scaled per species and gene, respectively. In d,m,s and t, dots indicate the highest correlation for each column. diff, differentiating; EB, early-born; GABA DN, GABAergic deep nuclei neurons; GL, granule cell layer; LB, late-born; ML, molecular layer; parabr.+nor., parabrachial and noradrenergic cells; PL, Purkinje cell layer.

