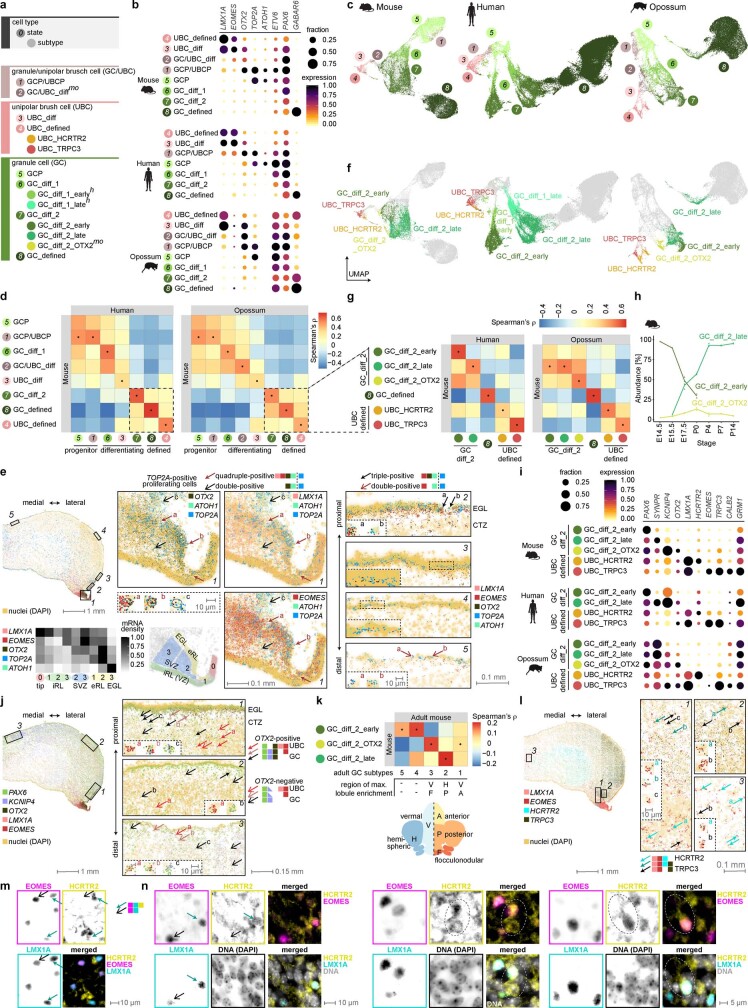
Extended Data Fig. 5. Atlas of the RL/EGL cell types.
a, Cell types, states and subtypes of neurons born at the late rhombic lip associated with the external granule cell layer. For the categories not detected in all species, superscript text specifies the dataset(s) where a category is present: h, human; m, mouse; o, opossum. b,i, Expression of key marker genes in the granule and unipolar brush cell states (b) and subtypes (i) in mouse, human and opossum. Dot size and colour indicate the fraction of cells expressing each gene and the mean expression level scaled per species and gene, respectively. c,f, Uniform Manifold Approximation and Projection (UMAP) of 32,767 mouse, 73,492 human and 36,585 opossum RL/EGL cells coloured by their state (c) or subtype (f). Colours and numbers as in a. d,g, Spearman’s correlation coefficients between orthologous variable gene expression profiles from mouse, human and opossum cell states (e; n = 110 genes) or subtypes (f; n = 101 genes) in the RL/EGL broad lineage. Dots indicate the highest correlation for each column. e,j,l, Human 12 wpc cerebellum smFISH data for markers of GC and UBC states (e), GC subtypes (j), and UBC subtypes (l). The locations of the regions expanded at right are shown with rectangles (solid line) on the whole section at left. Arrows indicate cells with specific expression patterns as described in the legends. Insets (dashed line) show close-ups of individual cells. In e, the heatmap shows the scaled density of mRNA spots in different rhombic lip compartments, as proposed in mice104 and in humans9. One multiplexed smFISH experiment was performed. h, Relative abundances (median of biological replicates) of differentiating granule cell subtypes across developmental stages in mouse. k, Spearman’s correlation coefficients between shared variable gene (n = 98) expression profiles from mouse differentiating granule cell subtypes from this study and adult subtypes described in ref. 7. For each adult subtype the position of the lobule showing the highest enrichment7 along the mediolateral and anteroposterior axes is shown. Dots indicate the highest correlation for each column. m,n, Detection of HCRTR2 in unipolar brush cells by immunohistochemistry. The HCRTR2, EOMES and LMX1A were detected by indirect immunofluorescence (m) or Immuno-SABER (n). The HCRTR2 antibodies used for immunohistochemistry were MAB52461 (m) and AOR-002 (n). Arrows point to HCRTR2-positive and -negative UBCs, as specified in the legend. Dotted circles highlight HCRTR2-positive cells with brush morphology. The fields shown are from the lobule X granule cell layer of P7 mouse. CTZ, cortical transitory zone; diff, differentiating; EGL, external granule cell layer; eRL, external rhombic lip; GC, granule cell; GCP, granule cell progenitor; iRL, internal rhombic lip; SVZ, subventricular zone; UBC, unipolar brush cell; UBCP, unipolar brush cell progenitor; VZ, ventricular zone.

