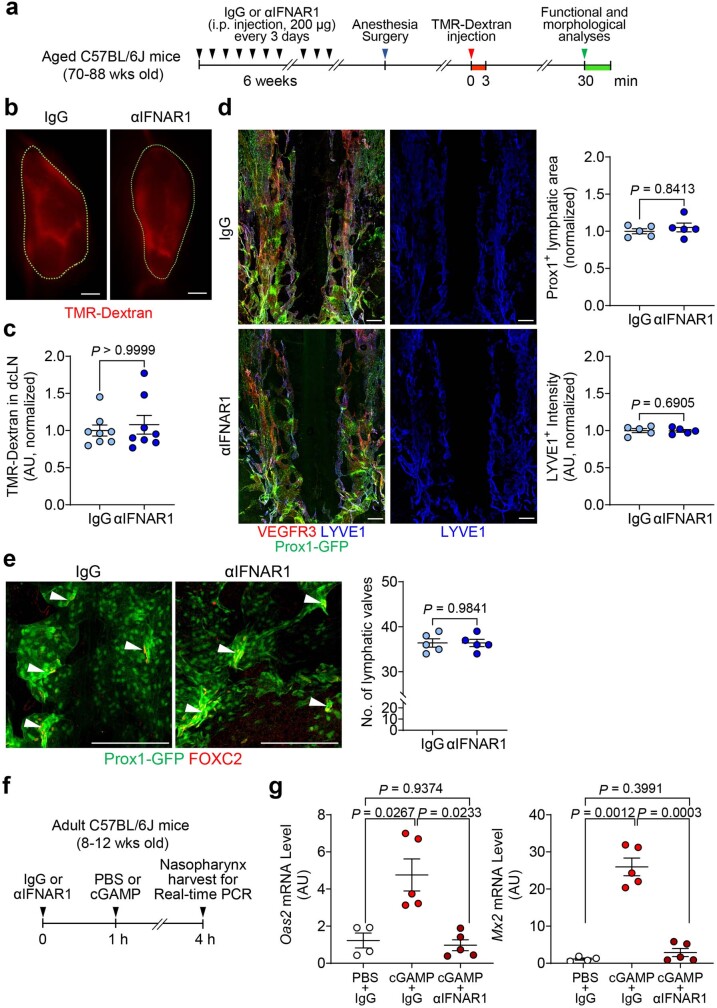
Extended Data Fig. 15. Lack of reversal of ageing-related regression of nasopharyngeal lymphatic plexus (NPLP) and reduced CSF drainage by inhibition of interferon type I signalling for 6 weeks.
a, Diagram of the experimental sequence for intraperitoneal (i.p.) injection of 200 μg of IgG or αIFNAR1 into aged (70-88 weeks old) C57BL/6J or Prox1-GFP mice every 72 hr for 6 weeks followed by intracisternal (i.c.) infusion of TMR-Dextran at 1.0 μl/min for 3 min and measurement of TMR-Dextran fluorescence in deep cervical lymph nodes (dcLN) 30 min later. b,c, Fluorescence microscopic images comparing amount of TMR-Dextran fluorescence in dcLNs (outlined by green dashed lines) after IgG or αIFNAR1. Scale bars, 200 μm. Each dot is the value for one mouse; n = 8 mice/group in two independent experiments. Error bars indicate mean ± s.e.m. AU, arbitrary unit. AU (arbitrary unit) normalized to mean IgG value. P values were calculated by two-tailed Mann-Whitney test. d,e, Immunofluorescence images of nasopharyngeal plexus whole mounts stained for Prox1-GFP, VEGFR3, and LYVE1 after IgG or αIFNAR1 administered to aged mice for 6 weeks. Scale bars, 200 μm. No differences between the groups are evident in lymphatic area, LYVE1 intensity, or lymphatic valves. Each dot is the value for one mouse; n = 5 mice/group from two independent experiments. Bars indicate mean ± s.e.m. AU, arbitrary unit. AU (arbitrary unit) normalized to mean control value = 1.0. P values were calculated by two-tailed Mann-Whitney test. f,g, Diagram of the experimental sequence for validating inhibition of interferon type I signalling by i.p. injection of 200 μg of αIFNAR1 antibody into adult (8-12 weeks old) C57BL/6J mice. One hour after injection of IgG or αIFNAR1 antibody, 300 μg of cGAMP was injected i.p. to stimulate type I interferon signalling. At 4 hr, nasopharyngeal tissue was removed for real-time PCR analysis of interferon-stimulating genes, Oas2 and Mx2. The blocking antibody reduced Oas2 and Mx2 expression to the PBS baseline. Each dot is the value for one mouse; Oas2 mRNA level and Mx2 mRNA level (PBS+IgG, n = 4; cGAMP+IgG, n = 5; cGAMP+ αIFNAR1, n = 5) in two independent experiments. Error bars indicate mean ± s.e.m. AU, arbitrary unit. P values were calculated by Brown-Forsythe ANOVA and two-tailed Dunnett’s T3 multiple comparison test.

