Key Points
-
•
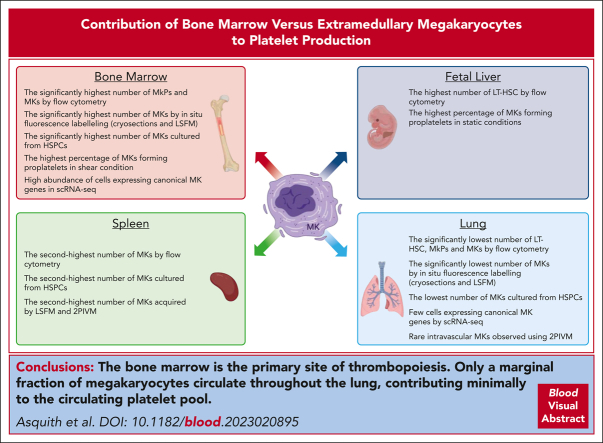
In vitro, in vivo, and in silico data suggest that a small fraction of MKs reside in the lung and contribute minimally to the platelet pool.
Visual Abstract
Abstract
Megakaryocytes (MKs) generate thousands of platelets over their lifespan. The roles of platelets in infection and inflammation has guided an interest to the study of extramedullary thrombopoiesis and therefore MKs have been increasingly reported within the spleen and lung. However, the relative abundance of MKs in these organs compared to the bone marrow and the scale of their contribution to the platelet pool in a steady state remain controversial. We investigated the relative abundance of MKs in the adult murine bone marrow, spleen, and lung using whole-mount light-sheet and quantitative histological imaging, flow cytometry, intravital imaging, and an assessment of single-cell RNA sequencing (scRNA-seq) repositories. Flow cytometry revealed significantly higher numbers of hematopoietic stem and progenitor cells and MKs in the murine bone marrow than in spleens or perfused lungs. Two-photon intravital and light-sheet microscopy, as well as quantitative histological imaging, confirmed these findings. Moreover, ex vivo cultured MKs from the bone marrow subjected to static or microfluidic platelet production assays had a higher capacity for proplatelet formation than MKs from other organs. Analysis of previously published murine and human scRNA-seq data sets revealed that only a marginal fraction of MK-like cells can be found within the lung and most likely only marginally contribute to platelet production in the steady state.
Recent reports of megakaryocytes within the spleen and lung have generated controversy as to the relative contribution of extramedullary megakaryopoiesis in circulating platelet mass. Asquith et al used a series of elegant studies to establish that there are far more megakaryocytes in the bone marrow than in extramedullary sites and that they have a greater proplatelet-formation capacity, confirming the bone marrow as the major contributor to steady state platelet production.
Introduction
Megakaryocytes (MKs) generate thousands of platelets, initially described as cells involved in hemostasis; however, researchers have identified a remarkable repertoire of functions of both cells in health and disease since these early reports. Platelets have elaborate roles in cancer metastasis, inflammation, and immunity,1,2 whereas MKs have been reported in several different organs, with roles beyond thrombopoiesis, such as the adaptive and innate immune responses.3
With their newfound attention, MKs have also become the subject of considerable controversy. Recent studies have reported that MKs in the lung contribute to 50% of platelet production in mice.4 Conversely, human studies (albeit in patients with cardiac abnormalities) estimated that intravascular MKs in the lung contributed 7% to 17% of all platelets.5 Lung MKs have been reported to be low ploidy and demonstrate immune-like transcriptional profiles.6,7 A similar subpopulation of bone marrow–resident LSP1+/CD53+ MKs has been associated with pathogen recognition and clearance.8 Splenic MKs are a significant source of platelet production during inflammatory challenges such as sepsis.9 With increasing, contradicting reports of extramedullary MKs and their contribution to physiological platelet production, there is a pressing need for a consensus on their definition, role, and relative abundance in healthy tissues, and are the reports of MKs in these tissues confounded by what we define as a MK.
Study design
For full details of methods, please refer to supplemental Material, available on the Blood website.
Organs
Bones (femurs, tibias, and iliac crests), spleens, and lungs were harvested from C57BL/6J mice. Mouse fetal livers were harvested from Crl:CD1 (ICR) mice.
Flow cytometry
Single-cell suspensions were analyzed by flow cytometry; total numbers of long-term hematopoietic stem cells (LT-HSCs), MK progenitors (MKPs), and MKs were quantified for all organs.
In situ quantification of MK numbers
Immunofluorescence microscopy was performed on cryosections labeled with MK markers. The MK number per mm2 was calculated for all organs.
LSFM
Organs from C57BL/6JRj mice were perfusion-fixed, chemically cleared using benzoic acid/benzyl benzoate (BABB), and imaged by light-sheet fluorescence microscopy (LSFM) as described previously.10 MK number per mm3 was calculated.
Two-photon intravital microscopy
Intravital videos of each organ within C57BL/6JR (von Willebrand factor [VWF]-eGFP) mice were obtained, and MKs (enhanced green fluorescent protein [eGFP+]) and vessels (Evans blue) were visualized using a 960 nm laser line. MK number per mm3 was calculated.
Ex vivo quantification of MK numbers
Hematopoietic stem and progenitor cells (HSPCs) were expanded and supplemented with thrombopoietin. MKs were enriched by a density gradient and imaged. The total number of MKs per culture was calculated.
In vitro proplatelet formation assay
MKs from ex vivo cultured HSPCs were imaged for 24 hours. Pixel-based machine learning distinguished MKs from proplatelets, and proplatelet-making capacity was quantified.
Shear-driven proplatelet formation assay
MKs cultured from HSPCs were infused into a microfluidic device and formed proplatelets in the flow direction; widefield phase images of proplatelet formation were acquired. Percentage proplatelet formation was calculated for each organ.
Bioinformatic analysis
Single-cell RNA sequencing (scRNA-seq) and cellular indexing of transcriptomes and epitopes (CITE-seq) data sets were analyzed using R, RStudio, and Seurat. scRNA-seq count matrices from murine bone marrow and lung were obtained from the online repository Gene Expression Omnibus (accession number GSE152574) and processed using the parameters set by the authors. Principal component analysis was performed, and the top 20 principal components were used to compute the unsupervised uniform manifold approximation and projection and the clusters. Seurat objects for human lung and bone marrow single-cell atlases were obtained from the following repositories: Lung, BoneMarrow. Data were imported to R and visualized using Seurat and ggplot2. MKs were identified using the metadata provided on the objects.
Results and discussion
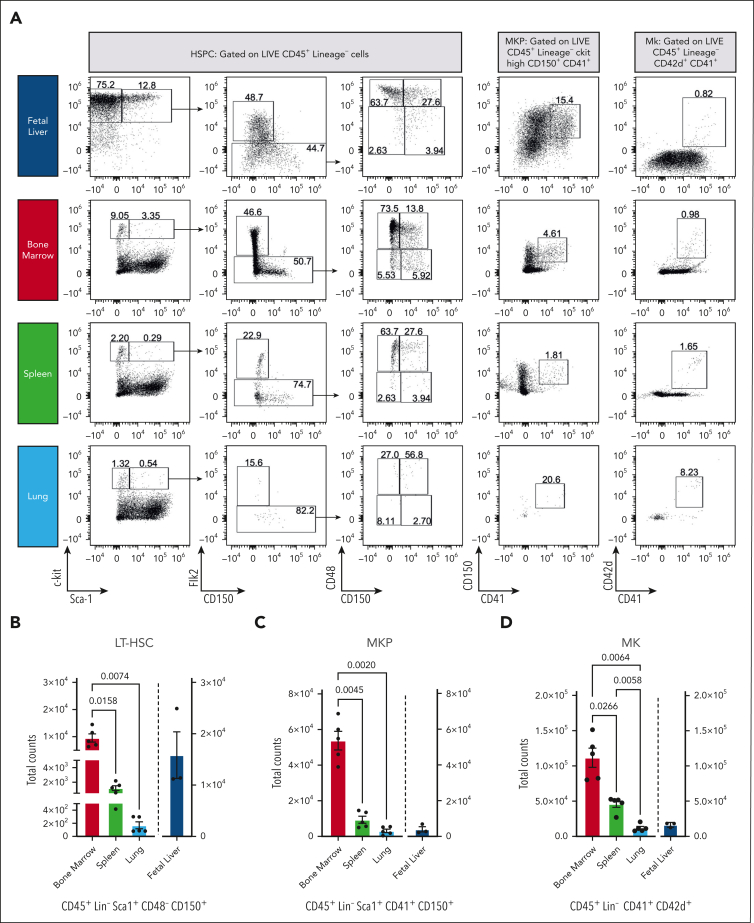
We quantified the total number of HSPC and MKs in freshly isolated murine fetal livers (n = 3), adult spleens, lungs, and bone marrow (n = 5; Figure 1A). To indicate whether MKs were tissue-resident or derived from alternative sources, the number of LT-HSCs (CD45+Lin−Sca1+CD48−CD150+) was quantified for each tissue. In adult tissues, LT-HSCs were most abundant in bone marrow, with 11.8-fold (±7.3) and 75.4-fold (±43.9) more cells than in the spleen and lung (Figure 1B). Most LT-HSCs were found in the mouse fetal liver (0.7-fold higher than in bone marrow). MKPs (CD45+Lin−Sca1+CD41+CD150+) were primarily found in the bone marrow, with a 7.1-fold and 45.7-fold increase in cells compared with those in the spleen and lung (Figure 1C), whereas murine fetal livers displayed a 19.2-fold decrease compared with the bone marrow.
Figure 1.
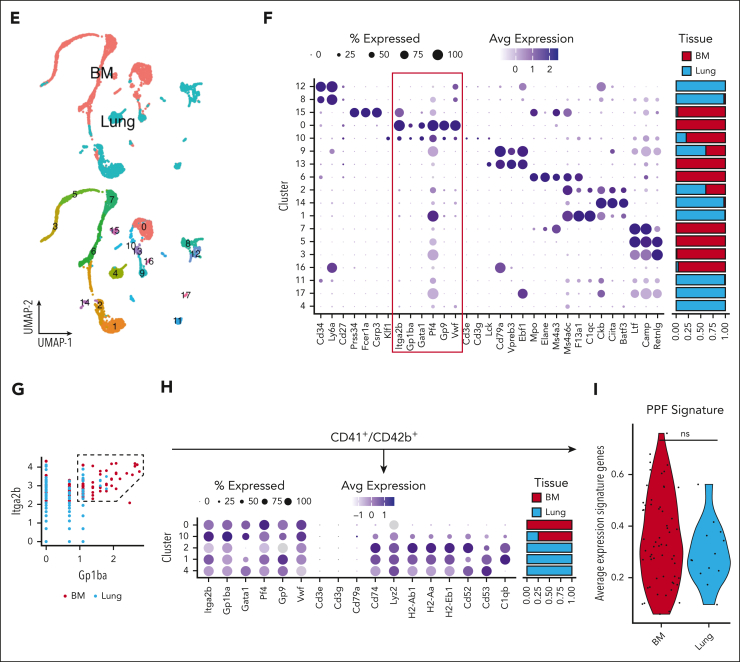
Ex vivo profiling of MKs by flow cytometry and scRNA-seq demonstrates that the bone marrow is the leading site of megakaryopoiesis in mice. (A) Representative dot plots of HSPCs, MKPs, and MKs. (B) Absolute LT-HSC cell counts across tissues. (C) Absolute counts of MKPs across tissues. (D) Absolute counts of MKs across tissues. Blue, fetal liver; red, bone marrow; green, spleen; and light blue, lung. Bone marrow, spleen, and lung (n = 5 animals) and fetal liver (n = 3 animals). Data are shown as mean ± standard error of the mean. Statistics were performed with 1-way analysis of variance with Tukey multiple comparisons test at 95% confidence interval (CI). (E) Uniform manifold approximation and projection (UMAP) projection of scRNA-seq data sets of murine lung and bone marrow CD41+ cells (Yeung et al6). Plots are colored based on the sampling tissue (top) or cluster identity (bottom). (F) Bubble plot showing expression of common murine hematopoiesis markers across clusters. The red box highlights canonical MK markers. (G) Scatterplot showing gating strategy used to select CD41+CD42+ cells based on RNA expression. (H) Bubble plot showing MK and immune-related markers expression on CD41+CD42+ cells across clusters. (I) Average expression of genes from a proplatelet formation (PPF) signature on CD41+CD42+ cells.
Similarly, the total number of mature MKs (CD45+Lin−CD41+CD42d+) was highest within the bone marrow, significantly lower in the spleen (−2.6-fold ± 1.1) and lung (−11.2-fold ± 6.2) and comparatively lower in the fetal liver (−8.5-fold ± 3.2; Figure 1D). The negligible number of LT-HSC and MKPs in the lung suggests that this tissue is not a significant site for megakaryopoiesis and implies that MKs previously identified in this tissue have an extrapulmonary source.
We investigated murine scRNA-seq data sets on CD41hi+ cells isolated from bone marrow or lung to categorize MKs or MK-like cells from these tissues transcriptionally.6 CD41 is widely used as a MK marker (alone or in conjunction with CD42); however, our data revealed that only a subset of CD41+ cells were positive for canonical MK genes (Itga2b, Gp1ba, Gata1, Pf4, Gp9, and Vwf), with the remaining cells expressing progenitor- and immune cell–like (Eo/Baso/Mast) genes (Figure 1E-F). We subsetted the MKs based on Cd41 (Itga2b) and Cd42b (Gp1ba) expression (Figure 1G) and found 42 of 2040, ∼2% cells from the lung to classify as megakaryocytic, whereas the most bone marrow–derived cells did classify (626 of 668; ∼94%). In line with previous studies,6 we found a fraction of pulmonary CD41+CD42b+ cells to express immune genes (Figure 1H-I), and no niche MKs were detected in the lung (supplemental Figure 1). We then assessed previously published scRNA-seq atlases of the human lung,11 which identified only a marginal number of the cells as MKs (11 of 60 993 [∼0.02%]; supplemental Figure 2). However, an analysis of RNA expression showed that none of these cells (or any of the other cell types identified in the human lung) expressed canonical MK markers. Our previous data suggest that CD41 might be insufficient for identifying a pure MK subset. Using CITE-seq atlas (scRNA + antibody-based cell surface protein expression),12 we found CD41 highly expressed on MKs and other myeloid cells (supplemental Figure 2C-D). These data point to a need for a consensus concerning the isolation, identification, and characterization of MKs.
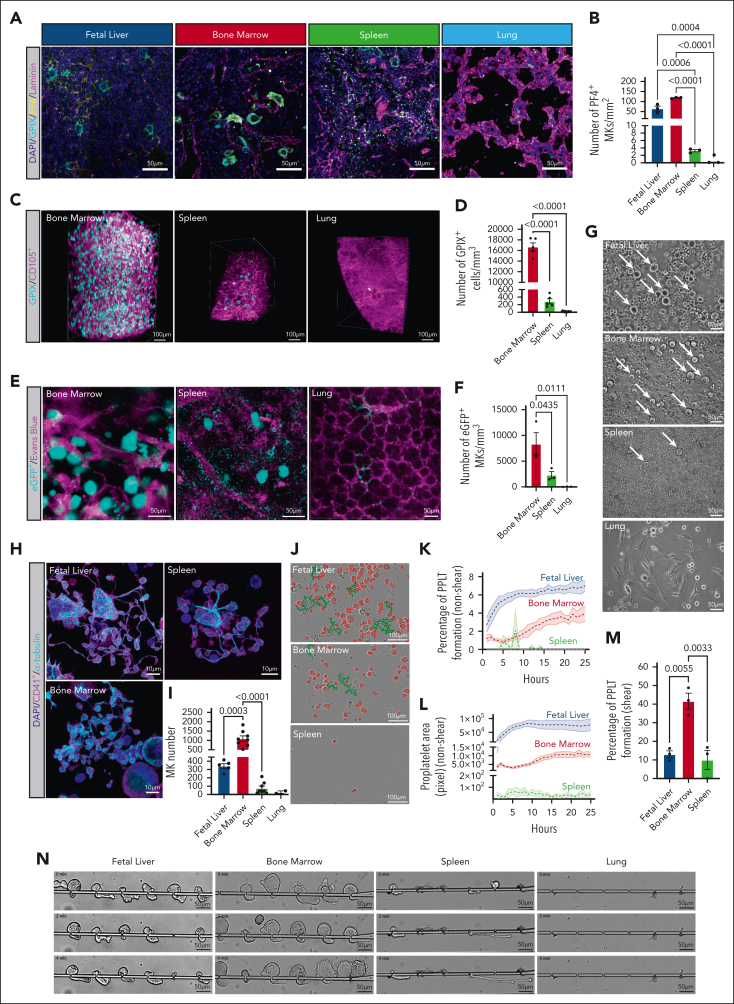
We next performed in situ fluorescence labeling of cryosections with antibodies against canonical MK markers CD41 (supplemental Figure 3), glycoprotein IX (GPIX), and platelet factor 4 (PF4) (Figure 2A; supplemental Figure 3). Quantitative analysis of MK numbers (Figure 2B; supplemental Figure 3) revealed that the fetal liver and bone marrow displayed the highest number of MKs. Few MKs were observed in the spleen, consistent with previous data reporting that splenic thrombopoiesis is inflammation-driven.9
Figure 2.
In situ fluorescence labeling, light sheet fluoresence microscopy (LSFM), 2-photon intravital microscopy (2PIVM), and ex vivo proplatelet assays demonstrate that the bone marrow is the primary site of megakaryopoiesis in adult mice. (A) Micrographs of cryosections obtained from mouse fetal liver, bone marrow, spleen, and lung, respectively. Blue, 4′,6-diamidino-2-phenylindole (DAPI); cyan, glycoprotein IX (GPIX); yellow, platelet factor 4 (PF4); and magenta, laminin. Scale bars represent 50 μm. (B) Quantitative analysis of MK count within whole organ cryosections (PF4) MK/mm2; blue, fetal liver; red, bone marrow; green, spleen; and light blue, lung. (C) Reconstruction of LSFM data of femoral bone marrow, spleen, and lung tissues. MKs are depicted in cyan (anti-GPIX) and vessels in magenta (anti-CD105); scale bars represent 100 μm. (D) Quantification of MK (GPIX+ > 16 μm) numbers per mm³ in the adult mouse bone marrow, spleen, and lung; bar graphs represent mean ± standard deviation. Red, bone marrow; green, spleen; and light blue, lung. (E) Representative images of 2PIVM data of adult mouse bone marrow, spleen, and lung tissues. MKs (eGFP+ > 16 μm) are depicted in cyan and vessels in magenta (Evans blue; scale bars represent 50 μm). (F) Quantification of 2PIVM data shows an average number of MKs per mouse. Red, bone marrow; green, spleen; and light blue, lung. (G) Representative brightfield images of day 4 mouse fetal liver, bone marrow, spleen, and lung cultures pregradient. White arrows indicate MKs. Scale bars represent 50 μm. (H) Representative micrographs of proplatelet-forming MKs differentiated ex vivo from mouse fetal liver, bone marrow, and spleen progenitors. Blue, DAPI; magenta, CD41+; cyan, α-tubulin. Scale bars represent 10 μm. (I) Quantitative analysis of MK counts on day 4 MKs differentiated ex vivo; blue, fetal liver; red, bone marrow; green, spleen; and light blue, lung. (J) Representative phase contrast images of proplatelet-forming MKs from multiple tissues at 24 hours time points. Red, MKs; green, proplatelet extensions. Scale bars represent 100 μm. (K) Quantitative analysis of the percentage of MKs forming proplatelets; blue, fetal liver; red, bone marrow; and green, spleen. (L) Total proplatelet area of MKs forming proplatelets; blue, fetal liver; red, bone marrow; and green, spleen. (M) Percentage of MKs forming proplatelets in shear conditions. Blue, fetal liver; red, bone marrow; and green, spleen. (N) Representative panels of shear-driven proplatelet formation and extension in a microfluidic device over time for ex vivo differentiated MKs from multiple tissues. The time scale is T = 0 minute → 4 minutes. Scale bars represent 50 μm. Unless otherwise stated, all data sets are shown as mean ± standard error of the mean; graphs represent data from a minimum of 3 independent mice. Statistics were performed with 1-way analysis of variance with Tukey multiple comparisons test at 95% CI.
In contrast to recent studies, we only observed a marginal number of MKs in cryosections derived from perfused lungs. To support our in situ labeling data, we also performed LSFM, quantifying events positive for GPIX and >16 μm in diameter (Figure 2C-D). Additionally, using VWF-eGFP reporter mice, we also performed intravital imaging to quantify MK number (Figure 2E-F). Using both methods, we observed that MK numbers were significantly higher in the bone marrow than in the spleen or lung. Although we very rarely observed intravascular MKs passing through the lung vasculature, no extravascular MKs were observed (supplemental Figure 4). These findings strongly support our ex vivo data and highlight that the bone marrow is the primary site of megakaryopoiesis and thrombopoiesis.
Due to the difficulty of isolating native MKs for proplatelet formation assays, we cultured and expanded progenitors from each organ, differentiated them into MKs using thrombopoietin, and isolated the resulting MKs by size exclusion enrichment (Figure 2G). When quantifying the total number of MKs (CD41+ and >20 μm), all tissues except the lung exhibited proplatelet-forming MKs (Figure 2H-I). The number of cells was highest in the fetal liver and bone marrow, followed by the spleen and lung. We hypothesize that low numbers of LT-HSCs and MKPs in the lung (as supported by our flow cytometry data) make it challenging to differentiate HSPCs to MKs from this organ in vitro.
Shear forces have been reported to be critical for proplatelet formation.13 We assessed the proplatelet formation of MKs cultured ex vivo from HSPCs under nonshear (Figure 2J-L) and shear conditions (Figure 2M-N). Due to the negligible amount of HSPCs in the lung, it was impossible to culture, expand, and differentiate cells ex vivo, and therefore quantify the capacity for proplatelet formation in lung-derived cells. Quantification of fetal liver– and bone marrow–derived MKs revealed that shear increased proplatelet formation from cultured fetal liver-derived MKs by 90%, consistent with our previous findings.13 In comparison, shear increased proplatelet formation from cultured bone marrow–derived MKs by ∼1000%, highlighting the importance of sinusoidal shear for proplatelet formation.
Our data revealed higher LT-HSC, MKP, and MK numbers in the bone marrow than in the spleen or lung by flow cytometry, which was supported by in situ fluorescence, LSFM, and intravital imaging, thus demonstrating that the spleen and lung are not critical sites of megakaryopoiesis in adult mice upon steady state. Thus, assuming the spleen and lung marginally contribute to the overall platelet pool is reasonable. Analysis of published murine and human scRNA-seq data sets supports the observation that only a marginal fraction of MKs is found within the lung. Intriguingly, this analysis also revealed that only a subset of CD41+ cells are classified as MKs in the lung based on their expression of canonical MK genes. The variety of recent work highlighting the nonconventional roles of MKs makes it necessary to find clear criteria for defining MKs based on their transcriptional profile, surface marker expression, and morphology. To our knowledge, our work is a first step toward finding a more precise definition of which MKs contribute to platelet production.
Conflict-of-interest disclosure: J.E.I. has financial interest in and is a founder of StellularBio, a biotechnology company focused on making donor-independent platelet-like cells at scale; these interests are managed by Boston Children’s Hospital. The remaining authors declare no competing financial interests.
Acknowledgments
The authors thank Emma Nikols, Clementine Payne, and Karen Guo for excellent technical support; Calixto Saenz and the Harvard Microfluidic Core for fabricating the microfluidic devices used in this study; Maximilian Voll (née Gorelashvili) for help with the LSFM image acquisition and the Core Unit Fluorescence Imaging of the Rudolf Virchow Center for help with LSFM data acquisition and analysis; Pierre Cunin and Peter Nigrovic (Boston Children’s Hospital) for assistance with two-photon intravital microscopy; and Carla Asquith for her intellectual discussions and critical manuscript review. The authors thank Kristin Johnson of the vascular biology program graphics core for assistance with figure preparation.
N.L.A., E.C., D.F., and J.E.I. are supported by National Institutes of Health (NIH), National Heart, Lung, and Blood Institute (NHLBI) (grants R01HL68130 and R35HL161175). A.R.-R. is supported by the Medical Research Council, United Kingdom (grant H4R02651). V.C. is supported by NIH, National Research Service Award Fellowship (grant 5T32HL007917-22). D.S. is supported by the German Research Foundation (#374031971-CRC1525). I.C.B. is supported by a Walter Benjamin Fellowship of the German Research Foundation (grant BE 7766/2-1). K.R.M. is supported by NIH, National Institute of Diabetes and Digestive and Kidney Diseases (grant R03DK124746) and NIH, NHLBI (grant R01HL151494). A.O.K. is a Sir Henry Wellcome Fellow supported by the Wellcome Trust (grant 218649/A/19/Z).
Authorship
Contribution: N.L.A. conducted experiments, analyzed and interpreted the data, and wrote the manuscript; E.C., V.C., D.S., A.A.-R., D.F., and I.C.B. designed and performed experiments and analyzed and interpreted the data; I.C.B. and K.R.M. critically reviewed the manuscript; and A.O.K. and J.E.I. conceptualized and designed the research and critically reviewed the manuscript.
Footnotes
∗N.L.A. and E.C. contributed equally to this work.
†A.O.K. and J.E.I. contributed equally to this work.
Data are available on request from the corresponding author, Joseph E. Italiano (joseph.italiano@childrens.harvard.edu).
The online version of this article contains a data supplement.
There is a Blood Commentary on this article in this issue.
The publication costs of this article were defrayed in part by page charge payment. Therefore, and solely to indicate this fact, this article is hereby marked “advertisement” in accordance with 18 USC section 1734.
Supplementary Material
References
- 1.Lucotti S, Muschel RJ. Platelets and metastasis: new implications of an old interplay. Front Oncol. 2020;10:1350. doi: 10.3389/fonc.2020.01350. [DOI] [PMC free article] [PubMed] [Google Scholar]
- 2.Portier I, Campbell RA. Role of platelets in detection and regulation of infection. Arterioscler Thromb Vasc Biol. 2021;41(1):70–78. doi: 10.1161/ATVBAHA.120.314645. [DOI] [PMC free article] [PubMed] [Google Scholar]
- 3.Semple JW, Italiano JE, Freedman J. Platelets and the immune continuum. Nat Rev Immunol. 2011;11(4):264–274. doi: 10.1038/nri2956. [DOI] [PubMed] [Google Scholar]
- 4.Lefrançais E, Ortiz-Muñoz G, Caudrillier A, et al. The lung is a site of platelet biogenesis and a reservoir for haematopoietic progenitors. Nature. 2017;544(7648):105–109. doi: 10.1038/nature21706. [DOI] [PMC free article] [PubMed] [Google Scholar]
- 5.Kaufman RM, Airo R, Pollack S, Crosby WH. Circulating megakaryocytes and platelet release in the lung. Blood. 1965;26(6):720–731. [PubMed] [Google Scholar]
- 6.Yeung AK, Villacorta-Martin C, Hon S, Rock JR, Murphy GJ. Lung megakaryocytes display distinct transcriptional and phenotypic properties. Blood Adv. 2020;4(24):6204–6217. doi: 10.1182/bloodadvances.2020002843. [DOI] [PMC free article] [PubMed] [Google Scholar]
- 7.Pariser DN, Hilt ZT, Ture SK, et al. Lung megakaryocytes are immune modulatory cells. J Clin Invest. 2021;131(1) doi: 10.1172/JCI137377. [DOI] [PMC free article] [PubMed] [Google Scholar]
- 8.Sun S, Jin C, Si J, et al. Single-cell analysis of ploidy and the transcriptome reveals functional and spatial divergency in murine megakaryopoiesis. Blood. 2021;138(14):1211–1224. doi: 10.1182/blood.2021010697. [DOI] [PMC free article] [PubMed] [Google Scholar]
- 9.Valet C, Magnen M, Qiu L, et al. Sepsis promotes splenic production of a protective platelet pool with high CD40 ligand expression. J Clin Invest. 2022;132(7) doi: 10.1172/JCI153920. [DOI] [PMC free article] [PubMed] [Google Scholar]
- 10.Stegner D, vanEeuwijk JMM, Angay O, et al. Thrombopoiesis is spatially regulated by the bone marrow vasculature. Nat Commun. 2017;8(1):127. doi: 10.1038/s41467-017-00201-7. [DOI] [PMC free article] [PubMed] [Google Scholar]
- 11.Travaglini KJ, Nabhan AN, Penland L, et al. A molecular cell atlas of the human lung from single-cell RNA sequencing. Nature. 2020;587(7835):619–625. doi: 10.1038/s41586-020-2922-4. [DOI] [PMC free article] [PubMed] [Google Scholar]
- 12.Triana S, Vonficht D, Jopp-Saile L, et al. Single-cell proteo-genomic reference maps of the hematopoietic system enable the purification and massive profiling of precisely defined cell states. Nat Immunol. 2021;22(12):1577–1589. doi: 10.1038/s41590-021-01059-0. [DOI] [PMC free article] [PubMed] [Google Scholar]
- 13.Thon JN, Mazutis L, Wu S, et al. Platelet bioreactor-on-a-chip. Blood. 2014;124(12):1857–1867. doi: 10.1182/blood-2014-05-574913. [DOI] [PMC free article] [PubMed] [Google Scholar]
Associated Data
This section collects any data citations, data availability statements, or supplementary materials included in this article.


