

Abstract
Adding feedback messages (FB) to self-monitoring (SM) may reinforce behavior change. However, socio-environmental conditions (e.g., limited access to parks or low walkability) may limit one’s ability to respond to FB focused on physical activity (PA). In this analysis, we hypothesized that high neighborhood walkability will positively modify the treatment effect of FB on PA, and residents of high walkability neighborhoods will achieve higher PA levels at 12 months than those in low walkability neighborhoods. The study is a secondary analysis of a 12-month behavioral weight loss trial. Adults with overweight/obesity were randomized to SM+FB (n=251) or SM alone (n=251). SM+FB group received smartphone pop-up messages thrice/week tailored to their PA SM data. Assessment included neighborhood walkability via Walk Score (low [<50] vs. high [≥50]), moderate to vigorous PA (MVPA) and step count via Fitbit Charge 2™, and weight via smart scale. We report adjusted linear regression coefficients (b) with standard errors (SE). The analysis included participants who were primarily white, female, and with obesity. In adjusted models, neighborhood walkability did not moderate the effect of treatment assignment on log-transformed (ln) MVPA or steps count over 12 months. The SM+FB group had greater lnMVPA than SM group, but lnMVPA and steps were similar between walkability groups. There were no significant interactions for group and time or group, time, and walkability. These findings suggest that adding FB to SM had small but significant positive impact on PA over 12 months, but neighborhood walkability did not moderate treatment effect of FB on PA.
Keywords: Neighborhood walkability, behavioral intervention/weight loss, physical activity, mHealth, tailored feedback, self-monitoring, randomized clinical trial (RCT)
Introduction
Studies suggest that adding feedback (FB) messages to self-monitoring can be effective in motivating behavior change and self-monitoring, and may enhance self-efficacy for behavior change and adherence to self-monitoring and/or goal.1,2 However, socio-environmental factors such as neighborhood characteristics may affect the response to certain feedback messages, especially those related to physical activity (PA). For example, individuals residing in neighborhoods with safety concerns and absence of needed infrastructure, such as parks and sidewalks, may face barriers to increasing PA in response to FB messages.3
The SMARTER trial was designed to examine the impact of self-monitoring with tailored FB on weight loss and adherence to nutrition and PA goals compared to self-monitoring alone.4 The PA component of the intervention entailed self-monitoring via wrist-worn Fitbit Charge 2™, instructions to increase PA gradually with a goal of attaining ≥150 minutes of moderate to vigorous PA (MVPA) per week, and feedback messages tailored to the self-monitoring data.4 Because the FB messages encouraged participants to increase PA primarily by walking and creating opportunities for PA in daily routines,4 it is important to gain a better understanding of how the home environment facilitated or limited response to the feedback messages.
The concept of neighborhood walkability was developed to evaluate neighborhood environments that are friendly to pedestrians and cyclists.5 Neighborhoods with high walkability scores provide infrastructure and amenities that support engagement in PA such as sidewalks, bicycle lanes and accessible public transit system.5 Although many indices for quantifying neighborhood walkability have been developed, the Smart Walk Score® is widely used in walkability research,6,7 and has been validated in many geographic locations including metropolitan areas in United States and Canada.7,8
Numerous studies have reported a positive relationship between neighborhood walkability, measured via the Smart Walk Score®, and various health indicators including PA, and weight loss.9,10 However, many of these studies employed a cross-sectional or longitudinal observational design,8–11 which limits the ability to examine how intervention effects vary across high walkability neighborhoods at the completion of a behavioral intervention. In this analysis, we examined the association between neighborhood Smart Walk Score and objectively measured PA at the end of a 12-month behavioral weight loss intervention. High neighborhood walkability will positively modify the treatment effect of FB on PA, and residents of high walkability neighborhoods will achieve higher PA levels at 12 months than those in low walkability neighborhoods regardless of whether FB was assigned.
Methods
Study design
The SMARTER weight loss study was a randomized controlled trial that enrolled 502 adults with overweight/obesity to either self-monitoring alone (SM) or self-monitoring with feedback (SM+FB) group.12 At baseline, each participant had a 1:1 meeting with a study dietician to review key aspects of the standard behavioral therapy (SBT), including goal setting and self-monitoring of weight, diet, and PA. The participants were instructed on how to self-monitor using the Fitbit app (diet), Fitbit Charge 2™ tracker (PA), and a smart scale (weight). Those randomized to the feedback group were further instructed on how to use the SMARTER app, developed by the investigators to deliver tailored feedback messages to the participant’s smartphone.4 In addition to dietary guidance that has been described elsewhere,13 the participants were asked to increase their PA with a goal of attaining ≥150 minutes of MVPA weekly.4 Although all activities contributed to the PA goal, the intervention focused on messages that encouraged walking, making active choices, and shorter bursts of PA to break up sitting time.4
Over 2000 of the unique feedback messages in the SMARTER library focused on diet and the importance of logging foods since individuals were engaged with eating several times a day, while approximately 800 messages focused on PA and were delivered less often since the participants were not expected to engage in PA daily, since current PA guidelines recommend PA on most (or five) days of the week [add citation for PA guidelines]. The PA feedback algorithm randomly selected an appropriate feedback message based on the number of steps taken or the number of active minutes in the previous seven days according to the Fitbit self-monitoring data.4
The PA feedback messages were delivered once every other day (3–4 times per week) over 12 months and focused on encouraging self-monitoring (e.g., “Time to wear your Fitbit! Even if your day has started, it’s not too late to put it on.”) and engagement in PA (e.g., “Take a walk around the block for some quick physical activity time”). The messages were not intentionally designed or tailored to address the participants’ neighborhood environment. To access the feedback messages, the participant needed to click on a message notification that popped up on the SMARTER app.4 The message was only available for viewing if accessed within 60 minutes of sending to ensure that the message content would reflect “near real-time” self-monitoring data.
The eligibility criteria and protocol for the study as well as the primary 12-month outcome have been detailed elsewhere.4,14 The study was approved by the Institutional Review Boards of the University of Pittsburgh and the University of Utah.
Study Measures
Race, age, sex, and education data were collected using a sociodemographic questionnaire administered at baseline. Other study measures were collected at baseline, 6 and 12 months. The key variables relevant to this analysis included:
Smart Walk Scores were computed using the Redfin proprietary algorithm that analyzes each geocoded location’s proximity to recreational, educational, food, convenience stores, retail, and entertainment facilities along street routes.7 The Smart Walk Scores range from 0–100, with higher scores indicating higher neighborhood walkability.15 Addresses within a radius 0.25-miles of the 5 amenities receive a score of 100 (walker’s paradise), while those with no facilities within a one-mile radius get a score of zero (almost all errands require a car).6,16 The scores are categorized as walker’s paradise (90–100), very high walkability (70–89), somewhat high walkability (50–69), low walkability (25–49) and very low walkability (0–25).6,16
PA was measured daily over the entire duration of the study (52 weeks) using a Fitbit Charge 2™ fitness tracker. The first week after randomization was considered the first time point because we did not have any true pre-intervention PA data, while a week before 6- and 12-month assessment dates were considered the second and third time points in the analysis. The average daily steps and weekly minutes of MVPA were computed for individuals with ≥4 days/week of valid wear time (i.e., ≥500 steps/day). The ‘fairly active’ and ‘very active’ minutes provided by Fitbit data were summed to represent moderate- or vigorous-intensity physical activities (MVPA) per week, divided over the number of days with valid data and multiplied by 7 days for each time point. Active Minutes, measured via Fitbit’s proprietary algorithm, have been extensively used to represent MVPA in research studies.17–19 Dichotomous PA variables were created using cut points that correlate with national PA aerobic guidelines20 to describe individuals who met the recommended daily step count (<7500, ≥7500 steps) and weekly MVPA (<150, ≥150 minutes). To minimize the skewness of the residuals and improve the model fit, the MVPA variable was log transformed to lnMVPA.21 The percentage of PA-focused feedback messages received was calculated as the number of feedback messages on PA opened divided by the total number of feedback messages on PA sent over 12 months, multiplied by 100%.
Weight was assessed using a Tanita Scale and Body Fat Analyzer at baseline, with participants wearing light clothing and standing with bare feet on the scale’s footpads. Height was measured with a stadiometer. Body mass index (BMI) was automatically computed by the scale after the weight was measured.
Exercise self-efficacy was measured via the Self-Efficacy and Exercise Habits survey which assesses an individual’s confidence in their ability to engage in PA consistently for at least 6 months when faced with various constrains (e.g., when feeling tired, depressed, or stressed). The survey has 12 items that are scored on a Likert scale ranging from 1 to 5, with higher scores indicating higher exercise self-efficacy.22 The 12 items in the survey are typically collapsed into two subscales focusing on making time for exercise (4 items) and sticking to it (8 items). The mean for each subscale was computed with higher scores denoting higher exercise self-efficacy (range 1–5).
Statistical Analysis
Continuous variables were screened for normality and outliers using Q-Q and box and whisker plots, and categorical variables were inspected for sparsely populated categories using frequency distributions. Descriptive statistics were reported as mean ± SD for normally distributed continuous variables or median [interquartile range] for non-normally distributed variables and frequencies (%) for categorical variables. Continuous variables were analyzed by walkability categories using two-sample t-tests or two-sample Wilcoxon signed-rank tests when normality was violated, and categorical variables were analyzed by walkability categories using the chi-square test of independence.
Sixty-one percent of the participants (n=181) resided in a neighborhood where “almost all errands require a car” or “most errands require a car.” The remaining participants were split between the “somewhat high walkability (n=51), very high walkability (n=44) and walker’s paradise (n=21) categories. We dichotomized the Smart Walk data into low walkability (scores<50) and high walkability (scores≥50) neighborhood categories using the natural break.
Regarding missingness of physical activity data, 32.87% (n=165) demonstrated general missing patterns, and 67.13% (n= 337) of the sample had complete data for MVPA at all three time points. For step counts, 38.65% (n=194) showed monotone missing patterns, and 61.35% (n=308) of the sample had complete data at all three time points. Multiple imputation of data assumed to be missing at random was performed using fully conditional specification (FCS) method, including the predictors of treatment, walkability, age, education, race, BMI and exercise self-efficacy scores and generated 10 imputed datasets. The estimates from linear mixed modeling were later combined using PROC MIANALYZE in SAS. All analyses were performed using SAS software [Copyright (c) 2016 by SAS Institute Inc., Cary, NC, USA.], Version 9.4.
The relationships between neighborhood walkability and MVPA and steps over time were examined fitting separate linear mixed models. The base model included dichotomized Smart Walk Score, treatment assignment, time effects and treatment by time interaction and treatment by dichotomized walkability interaction along with random intercept. The unstructured covariance matrix was selected as this was the best fitting based on the Akaike Information Criteria (AIC) and Bayesian Information Criteria (BIC). We performed natural log-transformation for MVPA minutes due to a non-normal residual distribution. The adjusted model additionally included variables that were different by walkability categories at baseline and those chosen a priori based on the literature: age, gender, race, baseline BMI and exercise self-efficacy scores; all variables were measured prior to randomization.23,24 The three-way interaction effects of treatment, walkability and time was not significant in the models with the original dataset and in the models with the imputed datasets, adding the three-way interaction did not allow convergence of the models. We report adjusted regression coefficients, standard errors (SE) along with 95% confidence intervals.
Results
The sample (N=502) was predominantly white (82.5%), female (79.5%), well-educated (16.4 ± 2.8 years) and on average 45 ± 14.4 years of age (Table 1 Participants from high walkability neighborhoods were older (41.4±14.7 vs. 47.7±13.6 years, P<.0001) with more self-identifying as white 75.3% vs. 87.8%, P==.0003) compared to participants from low walkability neighborhoods. Other baseline characteristics were comparable across walkability categories. Table 1 outlines the baseline characteristics of the participants across the walkability categories.
Table 1.
Baseline Characteristics of SMARTER Trial Participants by Neighborhood Walkability
| Characteristic | High Walkability (50–100) n=215 |
Low Walkability (0–49) n=287 |
p-value | |
|---|---|---|---|---|
|
| ||||
| MVPA minutes for the first week, n (%) | .942 | |||
| <150 mins/week | 72 (33.5%) | 97 (33.8%) | ||
| ≥150 mins/week | 143 (66.5%) | 190 (66.2%) | ||
| Average daily steps for the first week, n (%) | .907 | |||
| <7500 steps/day | 103 (47.9%) | 139 (48.4%) | ||
| ≥7500 steps/day | 112 (52.1%) | 148 (51.6%) | ||
| Race, n (%) | .0003 | |||
| White | 162 (75.3%) | 252 (87.8%) | ||
| Non-White | 53 (24.7%) | 35 (12.2%) | ||
| Gender, n (%) | .674 | |||
| Male | 46 (21.4%) | 57 (19.9%) | ||
| Female | 169 (78.6%) | 230 (80.1%) | ||
| Treatment assignment, n (%) | .417 | |||
| SM | 112 (52.1%) | 139 (48.4%) | ||
| SM+FB | 103 (47.9%) | 148 (51.6%) | ||
| Age (years), mean ± SD | 41.4 ± 14.7 | 47.7 ± 13.6 | <.0001 | |
| BMI (kg/m2), mean ± SD | 33.6 ± 3.9 | 33.8 ± 4 | .507 | |
| Average daily steps, median [interquartile range] | 7719.4 [4145.0] | 7581.3 [3561.6] | .578 | |
| Education (years), mean ± SD | 16.3 ± 3 | 16.5 ± 2.6 | .598 | |
| Self-Efficacy for Exercise, mean ± SD | 3.7 ± 0.8 | 3.7 ± 0.8 | .851 | |
| Walkability score, mean ± SD | 73.9 ± 14.1 | 18.4 ± 14.7 | <.0001 | |
| Moderate- and vigorous-intensity physical activity (minutes), median [interquartile range] | 219.0 [259.0] | 205.0 [231.0] | .808 | |
Note: MVPA= moderate-vigorous physical activity. Continuous measures reported as mean ± SD and median [interquartile range] and analyzed by walkability group with two-sample t-tests and Wilcoxon rank-sum tests. Categorical variables were reported as n (%) and analyzed by walkability group with the chi-square test of independence.
P-value for dichotomized race variable (white vs. non-white). “Non-White” includes participants who self-identified as African American, American Indian, Asian, and Multi-racial.
At baseline, the sample reported higher than average self-efficacy score (mean 3.7±0.80), with a slightly higher confidence about having time for exercise (mean 3.7±0.83) than sticking to the exercise program (mean 3.6±0.80). Over the 12 month study period, the self-efficacy score and its subscales declined progressively in both treatment groups as outlined in Figures 1 and 2. There were no significant differences in exercise self-efficacy by treatment group assignment or neighborhood walkability across the study timepoints. The percentage of PA-focused feedback messages received was low for both high walkability (median=13.8%, IQR 4.7%) and low walkability (median 14.2%, IQR 5.0%) neighborhoods (P =.889).
Figure 1.
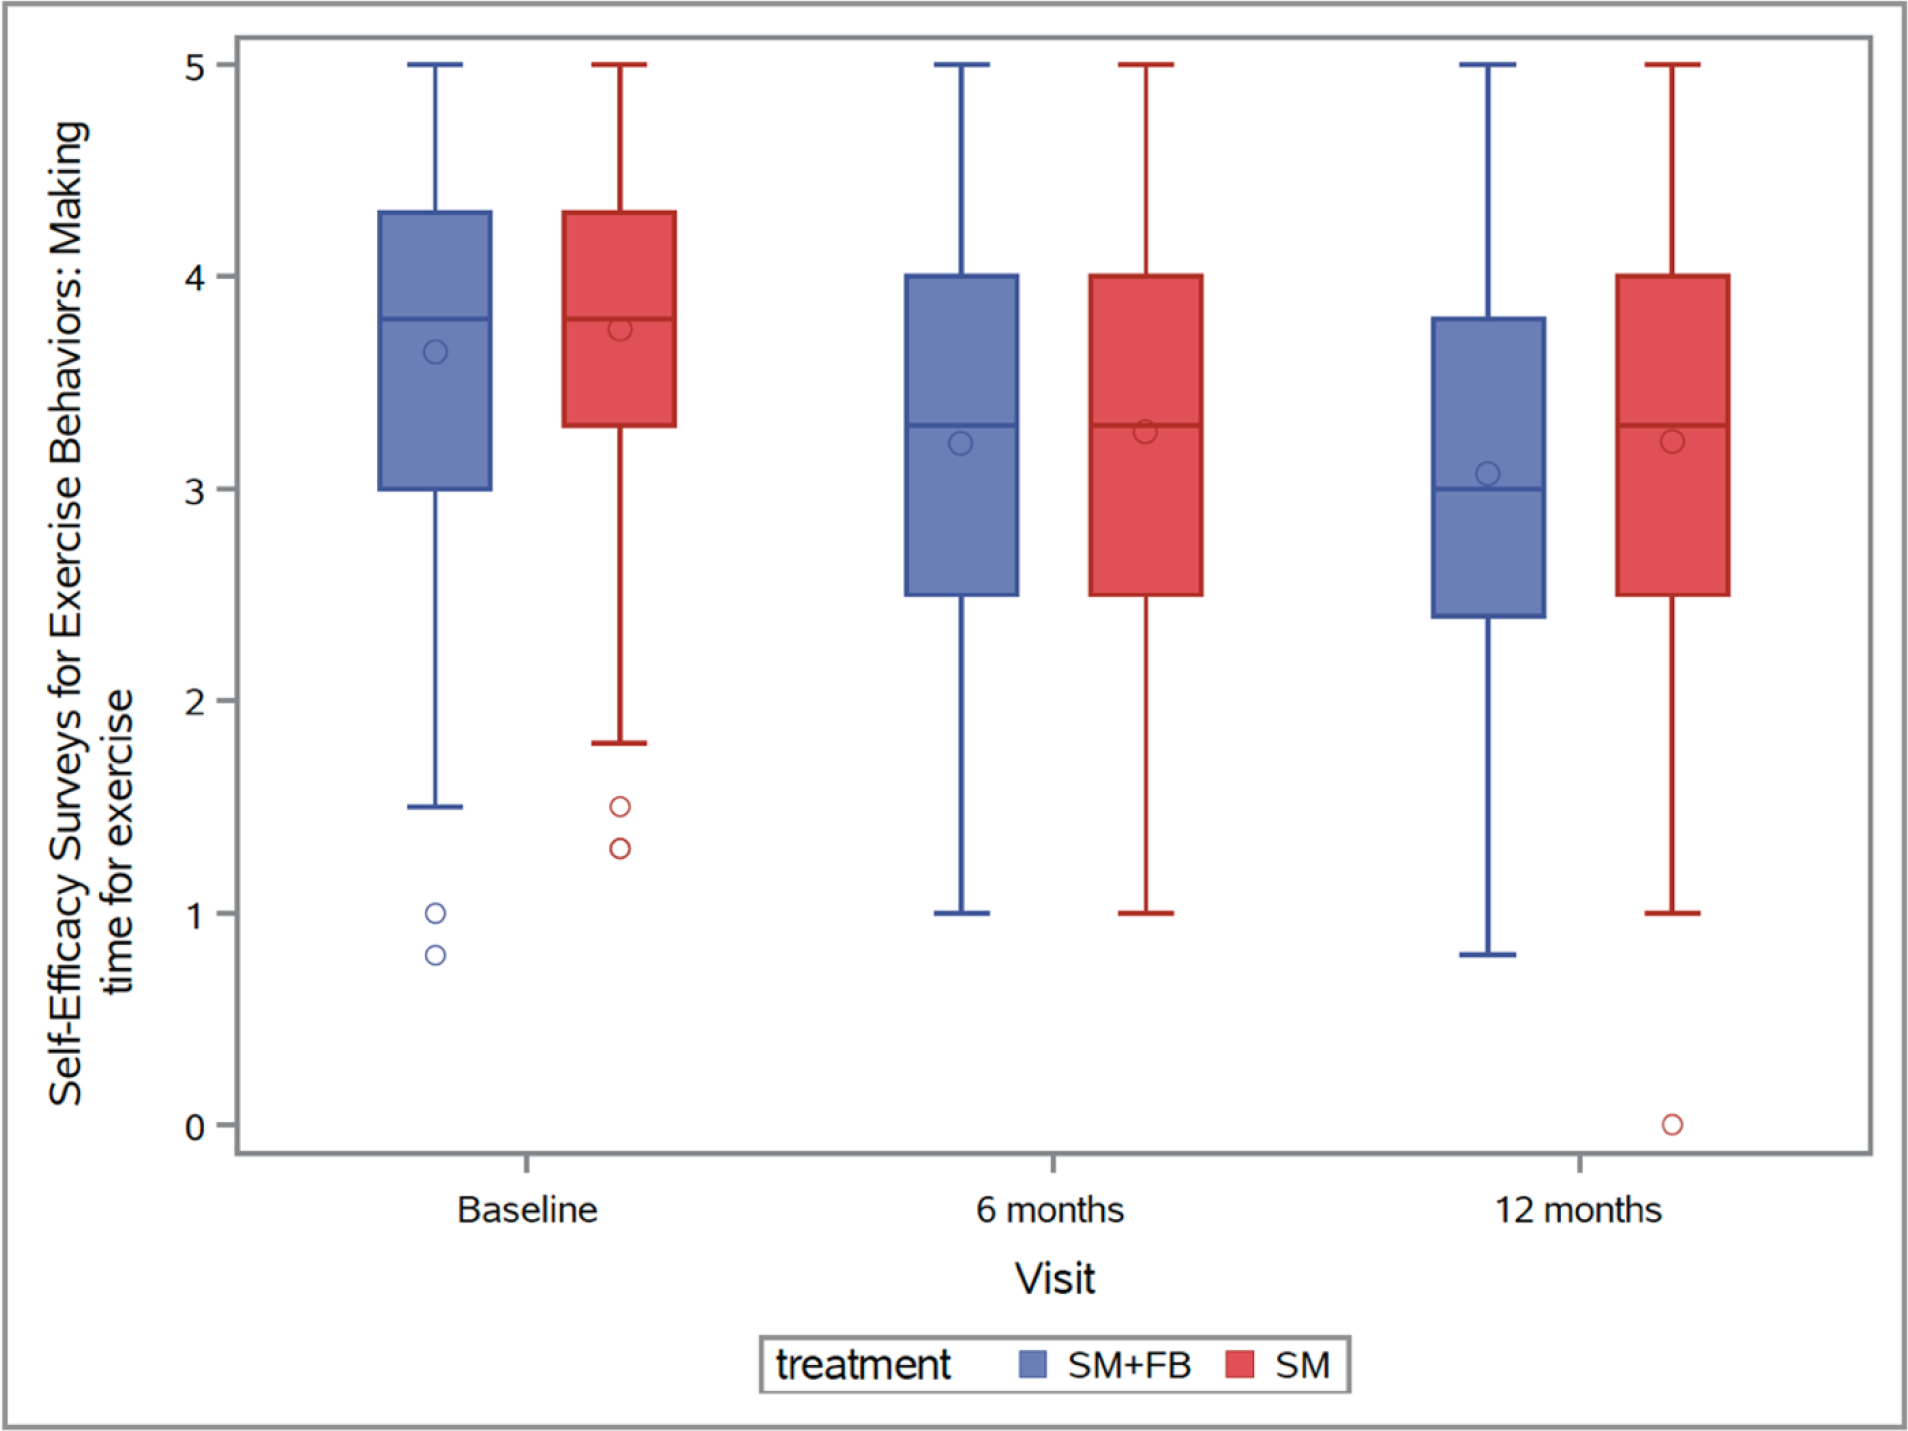
Making time for exercise self-efficacy subscale mean scores over the study period
Figure 2.

Sticking to it exercise self-efficacy subscale mean scores over the study period
In the base regression models (i.e., only including design effects and walkability), there were no significant moderating effects of walkability on the associations between treatment assignment and log-MVPA (b ± SE=−0.22 ± 0.16, P=.125) or step count (b ± SE=−927.26±512.01, P=.07). Log-MVPA (b ± SE= 0.16 ± 0.11, P=.244) and steps (b ± SE= 610.06 ± 361.81, P=.092) were similar by walkability. Both log-MVPA (b6mo ± SE= 0.003± 0.07, P= .968; b12mo ± SE= −0.23± 0.08, P= .009) and steps (b6mo ± SE= −416.18± 195.68, P= .034; b12mo ± SE= −1443.75± 227.49, P<.0001) declined over time. On average, the SM+FB group had greater log-MVPA (b ± SE= 0.23 ± 0.13, P=.07) and steps (b ± SE= 666.09 ± 413.12, P=.107). The interaction of treatment assignment with time was not significant for log-MVPA (b6mo and SM+FB ± SE= −0.10 ± 0.10, P= .290; b12mo and SM+FB ± SE= −0.07± 0.12, P= .524) and steps (b6mo and SM+FB ± SE −227.33 ± 264.89, P= .391; b12mo and SM+FB ± SE= −409.70 ± 282.66, P= .149).
After adjusting for these baseline socio-demographics, baseline body mass index, and exercise self-efficacy (Table 2 and 3), neighborhood walkability did not moderate the effect of treatment assignment on log-MVPA (b ± SE= −0.20 ± 0.15, P=.170) or steps (b ± SE= −816.48 ± 484.83, P=.092) over 12 months. Log-MVPA (b ± SE= 0.12 ± 0.10, P=.244) and steps (b ± SE= 415.05 ± 344.50, P=.228) were similar by walkability. Both log-MVPA (b6mo ± SE= 0.003± 0.07, P= .968; b12mo ± SE= −0.23± 0.08, P= .009) and steps (b6mo ± SE= −416.18± 195.68, P= .034; b12mo ± SE= −1443.75± 227.49, P<.0001) declined over time. On average, the SM+FB group had greater log-MVPA (b ± SE= 0.23 ± 0.12, P=.047) and steps (b ± SE= 674.84 ± 392.91, P=.086). The interaction of treatment assignment with time was not significant for log-MVPA (b6mo and SM+FB ± SE= −0.10 ± 0.10, P= .290; b12mo and SM+FB ± SE= −0.07± 0.12, P= .524) and steps (b6mo and SM+FB ± SE −227.33 ± 264.89, P= .391; b12mo and SM+FB ± SE= −409.70 ± 282.66, P= .149). Age and exercise self-efficacy were positively associated with log-MVPA, while BMI and female gender were inversely associated with log-MVPA (all P<0.05). Higher exercise self-efficacy was associated with greater step counts (b ± SE =619.68±144.11, P<.0001), while higher BMI, female gender and non-white race were inversely associated with step counts (b ± SE=−130.24±30.41, P<.0001; b ± SE=−1314.10±304.22, P<.0001; b ± SE=−684.99 ± 329.75, P=.038, respectively).
Table 2.
Adjusted Linear Mixed Modeling of the Effect of Walkability on Log-transformed MVPA Minutes/week over 12 Months
| Parameters | Level | b | SE | LCL Mean | UCL Mean | t | P |
|---|---|---|---|---|---|---|---|
| intercept | 5.08 | 0.44 | 4.22 | 5.94 | 11.63 | <.0001 | |
| Treatment | SM+FB | 0.23 | 0.12 | 0.00 | 0.46 | 1.99 | 0.047 |
| SM | reference | ||||||
| Visit | 12Mo | −0.23 | 0.08 | −0.40 | −0.06 | −2.72 | 0.009 |
| 6Mo | 0.003 | 0.07 | −0.14 | 0.14 | 0.04 | 0.968 | |
| baseline | reference | ||||||
| Treatment*Visit | SM+FB and 12Mo | −0.07 | 0.12 | −0.31 | 0.16 | −0.64 | 0.524 |
| SM+FB and 6Mo | −0.10 | 0.10 | −0.29 | 0.09 | −1.06 | 0.290 | |
| SM and baseline | reference | ||||||
| Walkability | car dependent (0–49) | 0.12 | 0.10 | −0.08 | 0.32 | 1.17 | 0.244 |
| walkable (50–100) neighborhoods | reference | ||||||
| Treatment*Walkability | SM+FB and car dependent (0–49) | −0.20 | 0.15 | −0.48 | 0.09 | −1.38 | 0.170 |
| SM and walkable (50–100) neighborhoods | reference | ||||||
| Education (years) | 0.02 | 0.01 | −0.01 | 0.04 | 1.33 | 0.185 | |
| Age (years) | 0.01 | 0.003 | 0.00 | 0.01 | 2.66 | 0.009 | |
| Exercise self-efficacy | 0.17 | 0.04 | 0.09 | 0.26 | 4.18 | <.0001 | |
| BMI | −0.02 | 0.01 | −0.04 | 0.00 | −2.35 | 0.019 | |
| Gender | Female | −0.64 | 0.09 | −0.81 | −0.47 | −7.47 | <.0001 |
| Male | reference | ||||||
| Race | African American, American Indian, Asian, Multi-racial | 0.03 | 0.10 | −0.16 | 0.22 | 0.28 | 0.782 |
| White | reference |
Note: P-values were obtained from t-test for fixed-effect parameter estimates; b=beta regression coefficient; SE= standard error
Table 3.
Adjusted Linear Mixed Modeling on the Effect of Walkability on Step Count over 12 Months
| Parameters | Level | b | SE | LCL Mean | UCL Mean | t | P |
|---|---|---|---|---|---|---|---|
| intercept | 9167.14 | 1487.75 | 6251.00 | 12083.27 | 6.16 | <.001 | |
| Treatment | SM+FB | 674.84 | 392.91 | −95.25 | 1444.93 | 1.72 | .086 |
| SM | reference | ||||||
| Visit | 12Mo | −1443.75 | 227.49 | −1898.18 | −989.32 | −6.35 | <.001 |
| 6Mo | −416.18 | 195.68 | −800.94 | −31.41 | −2.13 | .034 | |
| baseline | reference | ||||||
| Treatment*Visit | SM+FB and 12Mo | −409.70 | 282.66 | −966.40 | 146.99 | −1.45 | .149 |
| SM+FB and 6Mo | −227.33 | 264.89 | −746.91 | 292.26 | −0.86 | .391 | |
| SM and baseline | reference | ||||||
| Walkability | car dependent (0–49) | 415.05 | 344.50 | −260.21 | 1090.30 | 1.20 | .228 |
| walkable (50–100) neighborhoods | reference | ||||||
| Treatment*Walkability | SM+FB and car dependent (0–49) | −816.48 | 484.83 | −1766.75 | 133.80 | −1.68 | .092 |
| SM and walkable (50–100) neighborhoods | reference | ||||||
| Education (years) | 64.57 | 42.86 | −19.45 | 148.59 | 1.51 | .132 | |
| Age (years) | 13.62 | 8.93 | −3.89 | 31.13 | 1.53 | .127 | |
| Exercise self-efficacy | 619.68 | 144.11 | 337.22 | 902.14 | 4.30 | <.001 | |
| BMI | −130.24 | 30.41 | −189.84 | −70.63 | −4.28 | <.001 | |
| Gender | Female | −1314.10 | 304.22 | −1910.73 | −717.48 | −4.32 | <.001 |
| Male | reference | ||||||
| Race | African American, American Indian, Asian, Multi-racial | −684.99 | 329.75 | −1331.48 | −38.51 | −2.08 | .038 |
| White | reference |
Note: P-values were obtained from t-test for fixed-effect parameter estimates; b=beta regression coefficient; SE= standard error
Discussion
In this secondary analysis, we hypothesized that residents of neighborhoods with high walkability scores would achieve higher PA levels than those in neighborhoods with low walkability scores in each treatment group. Our results suggest that the SMARTER intervention (SM+FB) was associated with a marginal increase in PA compared to SM alone but residing in a high walkability neighborhood was not associated with higher levels of PA at 12 months.
In SMARTER we purposefully did not send FB messages targeting PA every day because participants were not expected to engage in PA every day; however, this reduced number of FB messages targeting PA may have diminished their impact on PA. Additionally, the FB messages expired if they were not opened within 60 minutes of the notification,4 causing a significant number of participants in the SM+FB arm not to receive regular tailored feedback on PA. Moreover, if the participant was not wearing the Fitbit, there were no SM data for the algorithm to read so the PA-related FB message would focus on the importance of wearing the device. We do not know for sure if it was the 60-minute limit that prevented the messages from being read. It could be that participants had no intention of reading the message and that extending the time limit to more hours would not have significantly increased the percent of messages read.
It is worth noting that participants both SM and SM+FB groups had above average exercise self-efficacy scores at baseline, and high levels of PA in the first week of the study. These attributes probably introduced a ceiling effect in our sample and may have limited the ability of our study participants to appreciate the feedback messages related to PA. In the SMARTER pilot study,25 we did not explore how time limits and high levels of PA in the early weeks of the study would impact the response trajectory from messages access to uptake and utilization of the feedback provided. These findings exemplify the need for detailed examination of all components of behavioral interventions, including widely used modalities such as messaging, during pilot studies to establish their social validity and utility.
Our findings suggest that individuals who attained the recommended step goal tended to receive a higher percentage of PA feedback messages compared to those who did not achieve the step goal at 12 months. However, the percent difference between groups was small (0.9%). Our technology set-up where failure to self-monitor PA led to no talored feeback may have introduced a vicious cycle that blunted the intervention’s ability to improve PA. The lack of SM engagement with the Fitbit tracker, limited access to feedback targeting PA, and a significant amount of missingness in the PA data at follow-up visits may have impacted the efficacy of the intervention. The marginal intervention efficacy may have further limited our ability to examine how neighborhood walkability may have affected the participants’ responses to the feedback.
It is possible that neighborhood walkability could have elicited larger effects if the study sample was sedentary with low exercise self-efficacy scores at baseline. This proposition is based on the premise that these individuals are likely to be more devoted to SM and would appreciate the feedback messages with ideas of activities they can easily do in their highly walkable neighborhoods. Their counterparts in low walkability neighborhoods could also benefit from the feedback messages, especially those focusing on how to integrate PA in daily routines. However, limited access to amenities that facilitate PA could limit the utility of the feedback messages in low walkability neighborhoods. More studies are needed to validate this proposition.
Our study findings do not support our hypothesis but are consistent with previous studies that have reported no significant relationship between neighborhood walkability and PA. For instance, Hajna et al. found no significant association between neighborhood walkability and daily steps in a cross-sectional analysis of the Canadian Health Measures dataset.26 Similarly, Chudyk et al. reported that neighborhood walkability was not associated with transport PA in a cross-sectional study of older adults.27 Although these studies provide important insights on the measurement and relations of neighborhood walkability, the authors acknowledge limitations related to use of cross-sectional study design,26,27 and, in one study, a small sample size that only included individuals who self-reported walking for transportation.27
Other studies have reported a direct relationship between neighborhood walkability and PA levels in adults.11,28–30 For instance, Twardzik et al. reported that in the REasons for Geographic and Racial Differences in Stroke (REGARDS) cohort, residing in very low walkability compared to very high walkability neighborhoods was associated with lower minutes of MVPA.29 Additionally, studies in Europe, including the Swedish Neighborhood and Physical Activity Study (SNAP) and the French Residential Environment and CORonary heart Disease (RECORD) Cohort study, have also demonstrated a positive relationship between neighborhood walkability and PA.11,28 The SNAP and RECORD studies were limited by cross-sectional design and lack of diversity in their sample.11,28 The REGARDS study included a diverse sample from a wide range of neighborhoods and had significant variation in income, urbanity, age, and sex.29 These studies focused on transport PA while our study focused on all PA domains.
Studies focusing on the relationship between change in neighborhood walkability and PA have also reported mixed results. For example, Braun et al. reported that change in neighborhood walkability due to residential relocation was not associated with more walking in the CARDIA study.31 However, data from the Canadian National Population Health Survey indicated that moving from a less to a more high walkability neighborhood increased the odds of utilitarian walking by 59%.16 Similarly, Hirsch et al. reported that a change in Street Smart Walk Score after residential relocation was associated with more utilitarian walking.32 It is noteworthy that both studies only reported significant associations between neighborhood walkability and walking for transport.
Considering the heterogeneity of the available data, Hajna et al. conducted a meta-analysis of the relationship between neighborhood walkability and objectively measured PA. Their meta-analysis revealed significant associations, where residing in high vs. low high walkability neighborhoods was associated with over 760 more steps per day.33 The analysis focused on total daily steps and did not distinguish between leisure and transport PA. It is also important to note that the pooled estimates were based on four studies that employed biosensors to monitor PA.33
Our study adds to the existing body of knowledge and provides more insight on how neighborhood walkability at study entry may impact the effects of behavioral interventions targeting an increase in PA. To the best of our knowledge, our study is among the first to evaluate whether neighborhood walkability has a differential impact on PA outcomes in a randomized clinical trial. Although our analyses did not reveal any significant associations, our findings indicate that many of the study participants resided in neighborhoods with low walkability scores. Since neighborhood walkability data are publicly available for most addresses in North America, the information could be used to tailor PA recommendations to align with neighborhood realities.
Our study results also suggest that exercise self-efficacy was independently associated with higher levels of PA even after controlling for neighborhood walkability, sociodemographic, obesity, time, and treatment effects. This finding is consistent with other studies that have demonstrated a moderate positive association between self-efficacy and PA.34 Strategies that are effective in enhancing self-efficacy have been associated with improved PA outcomes even after controlling for neighborhood characteristics.35 Our study also depicts declining self-efficacy over the study period, highlighting the need to incorporate dynamic strategies to evaluate and address key determinants of exercise self-efficacy in the course of behavioral interventions.
Lastly, our findings indicate that obesity was associated with low levels of PA at the end of the 12-month intervention after controlling for neighborhood walkability, sociodemographics, self-efficacy, time, and treatment effects. These results highlight the need for a more tailored approach in the design and implementation of behavioral interventions targeting improvement in PA. Many well designed behavioral interventions have used multiple approaches to influence individuals who remain sedentary but who would benefit from increasing their PA levels.36 Our data suggest that improving neighborhood walkability may not translate to increased PA among individuals with overweight/obesity. Rather, they may benefit more from programs that are carefully designed to address their multifaceted barriers to PA as detailed in previous studies.37,38
Major strengths of our study include a rigorous design, objective measurement of PA, use of a standard validated metric of neighborhood walkability, and control for sociodemographic and anthropometric factors that are likely to influence PA based on the literature. However, our study had several limitations including lack of significant sample variability in race, education, income, and neighborhood walkability. Additionally, our study did not capture baseline PA data limiting our ability to examine the change from baseline to post-intervention. We mitigated this limitation by examining the PA data collected during the first week of the study when participants were not exposed to any feedback messages on PA. We also encountered significant technological problems where some Fitbits did not sync regularly with our data collection system which affected the feedback that was received by the participants and the PA data available for these analyses. Additionally, the study intervention did not have an impact on the PA outcomes which may have limited our ability to detect any differences between neighborhoods with high walkability vs. low walkability scores at the end of the intervention.
Conclusions
The SMARTER intervention had a marginal impact on PA over 12 months, but our study findings do not support an association between neighborhood walkability and PA. However, previous studies depicted mixed findings. More evidence-based behavioral interventions that succeed in improving PA would facilitate a robust analysis of how neighborhood walkability may impact the efficacy of behavioral interventions focusing on PA. Such studies should include a diverse sample with residential diversity needed to examine any associations between neighborhood walkability and PA. Additional evidence from randomized clinical trials could provide useful insights regarding causality and the directionality of any associations between neighborhood walkability and study outcomes related to PA.
Acknowledgements:
This research was supported by the NIH R01-HL131583 (LE Burke), R01-HL131583S (J Kariuki), and F31-HL156278 & 5T32HL098048-14 (J Cheng) and the University of Pittsburgh Clinical Translational Science Institute (UL1-TR001857 (S Reis).
The content is solely the responsibility of the authors and does not necessarily represent the official views of the NIH and NHLBI.
The authors would also like to acknowledge the participants who enrolled in the study and the time they gave to our research.
Footnotes
Conflicts of interest:
All authors have no conflicts to disclose.
Reference
- 1.Teasdale N, Elhussein A, Butcher F, et al. Systematic review and meta-analysis of remotely delivered interventions using self-monitoring or tailored feedback to change dietary behavior. Am J Clin Nutr. 2018;107(2):247–256. doi: 10.1093/ajcn/nqx048 [DOI] [PMC free article] [PubMed] [Google Scholar]
- 2.Krukowski R, Kim H, Stansbury M, et al. Importance of multiple reinforcing comments and areas for change in optimizing dietary and exercise self-monitoring feedback in behavioral weight loss programs: Factorial design. J Med Internet Res. 2020;22(11):e18104. doi: 10.2196/18104 [DOI] [PMC free article] [PubMed] [Google Scholar]
- 3.CDC. Overcoming Barriers to Physical Activity. Centers for Disease Control and Prevention. Published 2011. Accessed July 1, 2017. https://www.cdc.gov/physicalactivity/basics/adding-pa/barriers.html [Google Scholar]
- 4.Burke LE, Sereika SM, Parmanto B, et al. The SMARTER Trial: Design of a trial testing tailored mHealth feedback to impact self-monitoring of diet, physical activity, and weight. Contemp Clin Trials. 2020;91. doi: 10.1016/j.cct.2020.105958 [DOI] [PMC free article] [PubMed] [Google Scholar]
- 5.Forsyth A What is a walkable place? The walkability debate in urban design. Urban Design International. 2015;20(4):274–292. doi: 10.1057/udi.2015.22 [DOI] [Google Scholar]
- 6.Score Walk. Walk Score Methodology. Published 2012. Accessed April 5, 2018. https://www.walkscore.com/methodology.shtml
- 7.Nykiforuk CIJ, McGetrick JA, Crick K, Johnson JA. Check the score: Field validation of Street Smart Walk Score in Alberta, Canada. Prev Med Rep. 2016;4:532–539. doi: 10.1016/j.pmedr.2016.09.010 [DOI] [PMC free article] [PubMed] [Google Scholar]
- 8.Duncan DT, Aldstadt J, Whalen J, et al. Validation of Walk Score ® for Estimating Neighborhood Walkability: An Analysis of Four US Metropolitan Areas Int J Environ Res Public Health International Journal of Environmental Research and Public Health ISSN. 2011;83390(11):4160–4179. doi: 10.3390/ijerph8114160 [DOI] [PMC free article] [PubMed] [Google Scholar]
- 9.Eriksson U, Arvidsson D, Sundquist K. Availability of exercise facilities and physical activity in 2,037 adults: Cross-sectional results from the Swedish neighborhood and physical activity (SNAP) study. BMC Public Health. 2012;12(1):607. doi: 10.1186/1471-2458-12-607 [DOI] [PMC free article] [PubMed] [Google Scholar]
- 10.Wasfi RA, Dasgupta K, Orpana H, Ross NA. Neighborhood Walkability and Body Mass Index Trajectories: Longitudinal Study of Canadians. Am J Public Health. 2016;106(5):934–940. doi: 10.2105/AJPH.2016.303096 [DOI] [PMC free article] [PubMed] [Google Scholar]
- 11.Méline J, Chaix B, Pannier B, et al. Neighborhood walk score and selected Cardiometabolic factors in the French RECORD cohort study. BMC Public Health. 2017;17(1). doi: 10.1186/s12889-017-4962-8 [DOI] [PMC free article] [PubMed] [Google Scholar]
- 12.Burke LE, Sereika SM, Parmanto B, et al. Effect of tailored, daily feedback with lifestyle self-monitoring on weight loss: The SMARTER randomized clinical trial. Obesity (Silver Spring). 2022;30(1):75–84. doi: 10.1002/OBY.23321 [DOI] [PubMed] [Google Scholar]
- 13.Burke LE, Sereika SM, Bizhanova Z, et al. The Effect of Tailored, Daily, Smartphone Feedback to Lifestyle Self-Monitoring on Weight Loss at 12 Months: the SMARTER Randomized Clinical Trial. J Med Internet Res. 2022;24(7). doi: 10.2196/38243 [DOI] [PMC free article] [PubMed] [Google Scholar]
- 14.Burke LE, Sereika SM, Parmanto B, et al. Effect of tailored, daily feedback with lifestyle self-monitoring on weight loss: The SMARTER randomized clinical trial. Obesity. 2022;30(1):75–84. doi: 10.1002/oby.23321 [DOI] [PubMed] [Google Scholar]
- 15.Ann F What is a Walkable Place? The Walkability Debate in Urban Design. Digital Access to Scholarship at Harvard (DASH). Published online 2018. doi: 10.1057/udi.2015.22 [DOI] [Google Scholar]
- 16.Wasfi RA, Dasgupta K, Eluru N, Ross NA. Exposure to walkable neighbourhoods in urban areas increases utilitarian walking: Longitudinal study of Canadians. J Transp Health. 2016;3(4):440–447. Accessed April 5, 2018. https://ac.els-cdn.com/S2214140515006726/1-s2.0-S2214140515006726-main.pdf?_tid=f8dbfbc0-92e3-47ed-95ce-a0964a28580f&acdnat=1523049290_c6984439f18951e7799c8c30afb596cd [Google Scholar]
- 17.Collins Id JE, Yang HY, Trentadue Id TP, Gong Y, Losina E. Validation of the Fitbit Charge 2 compared to the ActiGraph GT3X+ in older adults with knee osteoarthritis in free-living conditions. Published online 2019. doi: 10.1371/journal.pone.0211231 [DOI] [PMC free article] [PubMed] [Google Scholar]
- 18.Brewer W, Swanson BT, Ortiz A. Validity of Fitbit’s active minutes as compared with a research-grade accelerometer and self-reported measures. doi: 10.1136/bmjsem-2017 [DOI] [PMC free article] [PubMed] [Google Scholar]
- 19.Dominick GM, Winfree KN, Pohlig RT, Papas MA. Physical Activity Assessment Between Consumer- and Research-Grade Accelerometers: A Comparative Study in Free-Living Conditions. JMIR Mhealth Uhealth. 2016;4(3):e110. doi: 10.2196/mhealth.6281 [DOI] [PMC free article] [PubMed] [Google Scholar]
- 20.U.S. Department of Health and Human Services. Physical Activity Guidelines for Americans; 2018. Accessed November 12, 2018. https://health.gov/paguidelines/second-edition/pdf/Physical_Activity_Guidelines_2nd_edition.pdf [Google Scholar]
- 21.Feng C, Wang H, Lu N, et al. Log-transformation and its implications for data analysis. Shanghai Arch Psychiatry. 2014;26(2):105. doi: 10.3969/J.ISSN.1002-0829.2014.02.009 [DOI] [PMC free article] [PubMed] [Google Scholar]
- 22.Sallis JF, Pinski RB, Grossman RM, Patterson TL, Nader PR. The development of self-efficacy scales for healthrelated diet and exercise behaviors. Health Educ Res. 1988;3(3):283–292. doi: 10.1093/her/3.3.283 [DOI] [Google Scholar]
- 23.Howell NA, Tu J v., Moineddin R, Chu A, Booth GL. Association Between Neighborhood Walkability and Predicted 10-Year Cardiovascular Disease Risk: The CANHEART (Cardiovascular Health in Ambulatory Care Research Team) Cohort. J Am Heart Assoc. 2019;8(21). doi: 10.1161/JAHA.119.013146 [DOI] [PMC free article] [PubMed] [Google Scholar]
- 24.Creatore MI, Glazier RH, Moineddin R, et al. Association of neighborhood walkability with change in overweight, obesity, and diabetes. JAMA - Journal of the American Medical Association. 2016;315(20):2211–2220. doi: 10.1001/jama.2016.5898 [DOI] [PubMed] [Google Scholar]
- 25.Burke LE, Zheng Y, Ma Q, et al. The SMARTER pilot study: Testing feasibility of real-time feedback for dietary self-monitoring. Published online 2017. doi: 10.1016/j.pmedr.2017.03.017 [DOI] [PMC free article] [PubMed] [Google Scholar]
- 26.Hajna S, Ross NA, Joseph L, Harper S, Dasgupta K. Neighbourhood walkability, daily steps and utilitarian walking in Canadian adults. BMJ Open. 2015;5(11):e008964. doi: 10.1136/bmjopen-2015-008964 [DOI] [PMC free article] [PubMed] [Google Scholar]
- 27.Chudyk AM, McKay HA, Winters M, Sims-Gould J, Ashe MC. Neighborhood walkability, physical activity, and walking for transportation: A cross-sectional study of older adults living on low income. BMC Geriatr. 2017;17(1). doi: 10.1186/s12877-017-0469-5 [DOI] [PMC free article] [PubMed] [Google Scholar]
- 28.Arvidsson D, Eriksson U, Lönn SL, Sundquist K. Neighborhood walkability, income, and hour-by-hour physical activity patterns. Med Sci Sports Exerc. 2013;45(4):698–705. doi: 10.1249/MSS.0b013e31827a1d05 [DOI] [PubMed] [Google Scholar]
- 29.Twardzik E, Judd S, Bennett A, et al. Walk Score and objectively measured physical activity within a national cohort. J Epidemiol Community Health (1978). 2019;73(6):549–556. doi: 10.1136/jech-2017-210245 [DOI] [PMC free article] [PubMed] [Google Scholar]
- 30.Sallis JF, Saelens BE, Frank LD, et al. Neighborhood built environment and income: Examining multiple health outcomes. Soc Sci Med. 2009;68(7):1285–1293. doi: 10.1016/j.socscimed.2009.01.017 [DOI] [PMC free article] [PubMed] [Google Scholar]
- 31.Braun LM, Rodriguez DA, Song Y, et al. Changes in walking, body mass index, and cardiometabolic risk factors following residential relocation: Longitudinal results from the CARDIA study HHS Public Access. J Transp Health. 2016;3(4):426–439. doi: 10.1016/j.jth.2016.08.006 [DOI] [PMC free article] [PubMed] [Google Scholar]
- 32.Hirsch JA, Diez Roux A v, Moore KA, Evenson KR, Rodriguez DA . Change in walking and body mass index following residential relocation: the multi-ethnic study of atherosclerosis. Am J Public Health. 2014;104(3):e49–56. doi: 10.2105/AJPH.2013.301773 [DOI] [PMC free article] [PubMed] [Google Scholar]
- 33.Hajna S, Ross NA, Brazeau AS, Bélisle P, Joseph L, Dasgupta K. Associations between neighbourhood walkability and daily steps in adults: a systematic review and meta-analysis. BMC Public Health 2015 15:1. 2015;15(1):1–8. doi: 10.1186/S12889-015-2082-X [DOI] [PMC free article] [PubMed] [Google Scholar]
- 34.Spence J, Burgess J, Cutumisu N, et al. Self-efficacy and physical activity: a quantitative review. J Sport Exerc Psychol. 2006;28(S172):S172–S173. [Google Scholar]
- 35.Kariuki JK, Gibbs BB, Rockette-Wagner B, et al. Vicarious Experience in Multi-Ethnic Study of Atherosclerosis (MESA) Is Associated with Greater Odds of Attaining the Recommended Leisure-Time Physical Activity Levels. Int J Behav Med. 2021;28(5):575–582. doi: 10.1007/s12529-020-09947-9 [DOI] [PubMed] [Google Scholar]
- 36.Joseph RP, Durant NH, Benitez TJ, Pekmezi DW. Internet-Based Physical Activity Interventions. Am J Lifestyle Med. 2014;8(1):42–67. doi: 10.1177/1559827613498059 [DOI] [PMC free article] [PubMed] [Google Scholar]
- 37.Bombak AE. Obese persons’ physical activity experiences and motivations across weight changes: a qualitative exploratory study. BMC Public Health. 2015;15(1):1129. doi: 10.1186/s12889-015-2456-0 [DOI] [PMC free article] [PubMed] [Google Scholar]
- 38.Mcintosh T, Hunter DJ, Royce S. Barriers to physical activity in obese adults: A rapid evidence assessment. UK Journal of Research in Nursing. 2016;21(4):271–287. doi: 10.1177/1744987116647762 [DOI] [Google Scholar]