

Abstract

Ab initio calculations were performed to determine the sensing behavior of g-C3N4 and Li metal-doped g-C3N4 (Li/g-C3N4) quantum dots toward toxic compounds acetamide (AA), benzamide (BA), and their thio-analogues, namely, thioacetamide (TAA) and thiobenzamide (TAA). For optimization and interaction energies, the ωB97XD/6-31G(d,p) level of theory was used. Interaction energies (Eint) illustrate the high thermodynamic stabilities of the designed complexes due to the presence of the noncovalent interactions. The presence of electrostatic forces in some complexes is also observed. The observed trend of Eint in g-C3N4 complexes was BA > TAA > AA > TBA, while in Li/g-C3N4, the trend was BA > AA > TBA > TAA. The electronic properties were studied by frontier molecular orbital (FMO) and natural bond orbital analyses. According to FMO, lithium metal doping greatly enhanced the conductivity of the complexes by generating new HOMOs near the Fermi level. A significant amount of charge transfer was also observed in complexes, reflecting the increase in charge conductivity. NCI and QTAIM analyses evidenced the presence of significant noncovalent dispersion and electrostatic forces in Li/g-C3N4 and respective complexes. Charge decomposition analysis gave an idea of the transfer of charge density between quantum dots and analytes. Finally, TD-DFT explained the optical behavior of the reported complexes. The findings of this study suggested that both bare g-C3N4 and Li/g-C3N4 can effectively be used as atmospheric sensors having excellent adsorbing properties toward toxic analytes.
1. Introduction
Nowadays, environmental and energy deadlock crises have been seriously provoked.1 The rapid consumption of industrial fuels and the increasing concentration of toxic molecules in the atmosphere are adding their contribution to the melancholy of living beings.2 The World Health Organization (WHO) has reported that over 25% of the global load of disease is associated with atmospheric factors, including exposure to hazardous chemicals.3,4 Over the past decade, global warming because of industrialization and modern civilization has disrupted the cycles of the natural environment affecting many countries.5 Meanwhile, the gradual release of hazardous molecules from different chemical industries also opened the door of lethality for both humans and other creatures in the ecosystem.6 Hence, the existence of harmful gases even at a very low level can greatly affect the surroundings.7 To mediate health risks against environmental pollution, along with medical diagnosis, gas sensing, detection, and monitoring have become imperative for healthy and safe life.8 Reviewing the literature, numerous gas sensing materials have been used for sensing such as metal oxide,9 semiconductors,10,11 boron nitride nanotubes (BNNTs),12 carbon nanotubes (CNTs),13,14 graphene,15 graphene-like compounds,16 various nanocages and nanoclusters,17,18etc. Recently, two-dimensional nanomaterials have been leading in gas sensing applications19 because of their huge accessible volume and associated charge densities.20
Graphitic carbon nitride (g-C3N4) among 2D nanomaterials has been incredibly used to sense and remove harmful gases and materials.21−24 In comparison to graphene, the g-C3N4 structure shows a strong affinity for absorbing molecules, probably due to the semiconducting nature with a calculated band gap of 2.73 eV (see Figure 1).25 Nguyen et al. investigated the sensing behavior of pristine g-C3N4 for NO2 molecules and concluded that g-C3N4 is the best sensor material to detect NO2 in the atmosphere.26 For dopamine detection, an ultrasensitive chemical sensor was made by Zou et al. using 2D g-C3N4/CuO nanocomposites. The authors proposed the 2D g-C3N4/CuO as a novel sensor to detect dopamine in real biological samples.27 Recently, Asif et al. used C4N nanoflakes for the detection of pesticides and concluded that C4N can efficiently be used to detect pesticides in the atmosphere.28,29 Zhou et al. investigated the adsorption behavior of pristine and tungsten (W), chromium (Cr), and molybdenum (Mo) metal-doped g-C3N4 complexes toward CO2 via DFT simulations and observed that the conductivity of g-C3N4 was incredibly increased after doping of respective metals.30,31 Cao et al.32 studied SnO2@g-C3N4 composites for efficient sensing of ethanol. The authors concluded that th eSnO2@g-C3N4 composite has remarkable electronic behavior in favor of the elevated gas sensing of ethanol.32 Similarly, Basharnavaz et al. reported the adsorption mechanism of NH3 molecules on pristine and Fe-, Ru-, and Os-doped g-C3N4. The authors concluded that the interaction of NH3 with the Os-embedded g-C3N4 is much higher than g-C3N4 systems, with relatively high adsorption energy (−2.73 eV). This research proposed that the Os-doped g-C3N4 is an excellent candidate for adsorption and removal of NOx from the environment.33 Exploring the literature, it is found that very little work has been proposed on heptazine g-C3N4 as a harmful-molecule sensor.
Figure 1.

Structures of (a) graphene and (b) C3N4, (c) band gap of graphene, and (d) band gap of C3N4.
Heptazine g-C3N4 is one of the most stable carbon nitride analogue, formed by three s-triazine units, which is called tri-s-triazine.34,35 Tri-s-triazine is commonly known as heptazine, which consists of three s-triazine units, connected covalently by a central nitrogen atom.36 Because of the extra number of N atoms present in the heptazine structure as compared to the triazine unit, the heptazine g-C3N4 exhibits unique properties including mechanical strength, strong alkalinity, chemical sensing, and semiconducting nature.37−39 In addition, heptazine g-C3N4 is a thermodynamically and chemically stable analogue of g-C3N4 with low price and a nontoxic nature, which makes it appropriate for applications in biosensing and environmental gas sensing.40 Literature survey reveals that only a few studies are presented in explaining the geometric, energetic, and electronic properties of heptazine g-C3N4 quantum dots.41,42 The band gap of the 2D-g-C3N4 nanosheets is 2.97 eV compared to the band gap (2.77 eV) of infinite bulk g-C3N4 and shows a blueshift in the fluorescence emission spectra. Furthermore, the lifetime of charge carriers in the nanosheets is higher than that of bulk g-C3N4. However, the 2D nanomaterials are still limited by their low efficiency of light absorption, slow rate of charge transfer, and high recombination probability of the photogenerated electron–hole pairs. Compared to 2D nanosheets, 1D ribbon-like g-C3N4 nanostructures have intriguing optical and electrical features, including a substantial blueshift in their absorption spectra corresponding to a rise in the band gap from 2.7 to 3.0 eV.43 The nanoribbons are converted to zero-dimensional g-C3N4 quantum dots through a hydrothermal process. These quantum dots exhibit excellent photoinduced charge transfer, good upconversion photoluminescence, and electron reservoir properties.38 Additionally, the ultrasmall size, edge effects, high band gap, and strong quantum confinement render g-C3N4 excellent optical properties like carbon dots.44 Due to these properties, the heptazine g-C3N4 quantum dot is selected in the current study. We also studied the doping of heptazine g-C3N4 quantum dots with Li metal, which further enhances the properties of g-C3N4 quantum dots. Scientists believe that the geometric and electronic properties of any nanomaterials can be enhanced by metal doping, which can be used for further applications.45 Wang et al. illustrated that the photocatalytic activity of the g-C3N4 quantum dot is increased by decorating the surface of quantum dots with Pt during their work on hydrogen evolution. They concluded that the g-C3N4 quantum dot shows no intrinsic activity but plays a crucial role in accelerating photocatalytic reactions.44 The main objective of this work is to study and compare the adsorption behavior/sensing of pure g-C3N4 and Li metal-doped g-C3N4 (Li/g-C3N4) quantum dots (Figure 2) toward harmful molecules.
Figure 2.
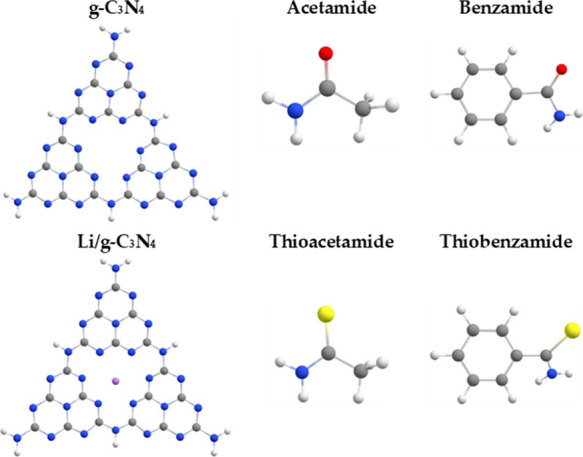
Structural representation of g-C3N4 quantum dots and selected toxic organic volatile analytes.
Reviewing the literature, Ruan et al. used lithium-doped triazine-based g-C3N4 sheets effectively for hydrogen (H2) storage.46 Opoku and Govender studied the behavior of harmful gases H2S, CO, and CO2 binding on g-C3N4 by anchoring with Si using a first-principles study. The authors concluded that it is a potential sensor with the features of short recovery time, excellent charge transfer, high electrical conductivity, and remarkable adsorption affinity.47 However, a detailed study of harmful molecules such as acetamide (AA), thioacetamide (TAA), benzamide (BA), and thiobenzamide (TBA) (for structures, see Figure 2) for adsorption and electronic behavior on pristine g-C3N4 and doped Li/g-C3N4 is still lacking. Acetamide, benzamide, and their thio-analogues are hazardous molecules and are environmental contaminants.48 They are usually assembled from petroleum and industry refineries, vehicle exhaust emissions, and coal gasification. The International Agency for Research on Cancer (IARC) has classified acetamide (AA), with the formula CH3CONH2, as a possible human carcinogen.49,50 It is also produced as a byproduct during ammonization technology for feed production resulting in acetamide being present as a feed contaminant.51 Initially, thioacetamide (TAA) was used to control the decomposition of oranges and also as a fungicide.52,53
TAA is a strong hepato toxicant, which needs metabolic activation by oxidation to its S-oxide and then further to reactive S,S-dioxide and ultimately attacks lipids and proteins in humans.54,55 Benzamide (BA) and thiobenzamide (TBA) are basically amide derivatives of benzoic acid, and they are effectively used as pesticides but also have pharmaceutical value as they are used to control fungal growth or parasites.56,57 Prolonged exposure to benzamide and thiobenzamide can severely cause irritation to eyes, harmful effects to the nose and throat, nausea, vomiting, and in some cases abdominal pain.58,59 According to literature survey, the detection of acetamide, benzamide, and their thio-analogues on pure and doped g-C3N4 quantum dots is not studied yet. To overcome this deficiency in the literature, we proposed this study within the DFT framework. The results are based on the exploration of geometric as well as electronic properties of pure and Li-decorated g-C3N4 quantum dots before and after interaction with the selected toxic analytes. Li-decorated g-C3N4 is selected because of its excellent performance in adsorption of molecules.60 We are hopeful that the findings of this manuscript will be favorable for the experimentalists to design rational carbon nitride-based sensors for harmful molecules.
2. Results and Discussion
2.1. Geometric and Energetic Analysis of Pure g-C3N4 and Li/g-C3N4 Quantum Dots
To demonstrate the most stable binding sites of Li on g-C3N4, we had placed the Li metal at different possible positions, including the open hollow site, the center of triazine rings, the top of atoms, and the bond between atoms. By comparing the binding energies, it was found that the binding of the Li metal atom through the open hollow site is energetically the most favorable configuration (Figure 1, top right); this study is similar to the work of Zhu et al.60 and Zhang et al.61,62 Based on the literature report and our obtained results, the top hollow site is only considered for metal decoration in this study. The bond length of the C–N bond in aromatic rings is 1.32 Å, and the bond length of the C–N bond between the aromatic rings is 1.38 Å. The bond angle between N–C–N in g-C3N4 of the central ring is 120.78°. The dihedral angle between C–N–C–N of the central ring is 168.54°. After Li doping on the g-C3N4, increases in the bond lengths and dihedral angles of the g-C3N4 are seen due to interaction of nitrogen atoms of the g-C3N4 with the Li metal. In addition, the overall structural integrity of the g-C3N4 is sustained after doping of Li metal. The average bond length of Li from the central nitrogen atoms of the g-C3N4 is 2.37 Å; the bond distance represents physisorption of Li. The bond length of the C–N bond in aromatic rings is 1.34 Å, and the bond length of the C–N bond between the aromatic rings is 1.39 Å. The bond angle between N–C–N in g-C3N4 of the central ring is 119.60°. The dihedral angle between C–N–C–N of the central ring is 175.59°. The geometric properties of pure g-C3N4 are changed after Li metal doping, which reflects the strong interaction between g-C3N4 and the Li atom. The reason is the lone pair of electrons on nitrogen atoms of g-C3N4, which attract the Li atom toward the g-C3N4. The charge on the Li atom is 0.34 e, and the average charge on the nitrogen atom is −0.56 e. The Li acts as an electropositive metal for further interactions with hazardous molecules. The Eint of Li/g-C3N4 is −77.63 kcal/mol, which shows high thermodynamic stability of the complexation between Li metal and g-C3N4.
The change in geometric properties causes a change in electronic properties, the EHOMO and ELUMO of g-C3N4 are −7.48 and −1.41 eV, respectively, and the respective H–L Egap is 6.07 eV. After Li doping, the EHOMO and ELUMO are −3.87 and −1.65 eV, respectively, and their respective energy gap is 2.21 eV. The reduction in the H–L Egap after doping of Li metal is evidence of the strong interaction between Li metal and the surface. The source of interaction is the shifting of electronic density from Li metal toward g-C3N4 under the electron-withdrawing effect of the electron-rich nitrogen atoms of the g-C3N4. This electronic charge transfer is responsible for the semiconducting behavior of the Li/g-C3N4, which can be used as a potential sensor for the adsorption of the selected hazardous molecules. To search for the favorable and energetically stable complexes of pure g-C3N4 and Li metal-doped g-C3N4 quantum dots, the selected toxic analytes, namely, acetamide (AA), thioacetamide (TAA), benzamide (BA), and thiobenzamide (TBA) (Figure 2), are adsorbed at different sites of g-C3N4 and Li/g-C3N4. All the complexes with their relative energies and possible geometries are given in the Supporting Information (Figure S1), while the most stable complexes are shown in Figure 3. The number of possible interaction configurations in Figure S1 is based on the opposite charge interactions between adsorbents and adsorbates. For example, the electrophilic sites of adsorbates are placed closer to the nucleophilic end of adsorbents, based on the molecular electrostatic potential surface (MEPS). The interaction sites, distances (dint), and energies (Eint) of analytes@g-C3N4 and analytes@Li/g-C3N4 complexes are mentioned in Table 1.
Figure 3.

Optimized geometries of pure g-C3N4 and Li/g-C3N4 complexes with the interaction distance (dint) (gray, C; white, H; blue, N; purple, Li; yellow, S; red, O); (A1) AA@g-C3N4, (A2) TAA@g-C3N4, (A3) BA@g-C3N4, (A4) TBA@g-C3N4, (B1) AA@Li/g-C3N4, (B2) TAA@Li/g-C3N4, (B3) BA@Li/g-C3N4, and (B4) TBA@Li/g-C3N4.
Table 1. Interacting Atoms (Aint), Interaction Distances (dint) in Å, and Interaction Energies (Eint) in kcal/mol of Analytes@g-C3N4 and Analytes@Li/g-C3N4 Complexesa.
|
Eint |
|||||||
|---|---|---|---|---|---|---|---|
| Aint | dint | ωB97XD/6-31G(d,p) | ωB97XD/6-31+G(d,p) | M05-2X/6-31G(d,p) | B3LYP-D3/6-31G(d,p) | ||
| g-C3N4 | A1 | N22–H62 | 2.06 | –25.70 | –25.03 | –27.13 | –28.36 |
| N39–H63 | 2.33 | ||||||
| A2 | N36–H62 | 2.03 | –27.29 | –27.25 | –28.44 | –29.80 | |
| N25–H63 | 2.20 | ||||||
| A3 | N22–H70 | 2.11 | –29.72 | –30.06 | –29.55 | –32.35 | |
| N39–H69 | 2.19 | ||||||
| A4 | N30-H70 | 1.97 | –17.20 | –16.66 | –17.08 | –19.62 | |
| H53–S55 | 2.42 | ||||||
| Li/g-C3N4 | B1 | Li55–O56 | 1.96 | –25.14 | –24.77 | –26.71 | –27.37 |
| N39–H65 | 1.99 | ||||||
| B2 | N36–H63 | 1.96 | –20.98 | –23.17 | –23.16 | –24.80 | |
| Li55–S56 | 2.66 | ||||||
| B3 | Li55–O56 | 1.93 | –30.98 | –31.27 | –32.80 | –35.70 | |
| N22–H71 | 2.08 | ||||||
| B4 | N22–H71 | 2.05 | –23.77 | –25.14 | –24.21 | –25.93 | |
| Li55–H71 | 2.36 | ||||||
(A1) AA@g-C3N4, (A2) TAA@g-C3N4, (A3) BA@g-C3N4, (A4) TBA@g-C3N4, (B1) AA@Li/g-C3N4, (B2) TAA@Li/g-C3N4, (B3) BA@Li/g-C3N4, and (B4) TBA@Li/g-C3N4.
2.1.1. Interaction of Selected Molecules with Pure g-C3N4
The selected analytes AA, TAA, BA, and TBA are absorbed at different sites on pure g-C3N4 quantum dots resulting in complexes named as AA@g-C3N4 (A1), TAA@g-C3N4 (A2), BA@g-C3N4 (A3), and TBA@g-C3N4 (A4), respectively. Among all the reported complexes of g-C3N4, the highest interaction energy (Eint) is observed for the A3 complex, which is −29.71 kcal/mol with an interaction distance (dint) of 2.11 Å. The high value of Eint is due to the presence two hydrogen bonds between the H70 and H69 of benzamide (BA) with the N39 and N22 of g-C3N462; thus, electrostatic forces dominate in stabilizing the A3 complex. The stability of the A3 complex is followed by A2 and A1 complexes with the Eint of −27.29 and −25.70 kcal/mol, respectively, due to the reduction in dispersion forces and absence of π stacking. However, the A4 complex is reported to have the least value of Eint, which might be due to the different modes of interaction (only two side interactions) in which only two atoms are interacting with the g-C3N4. The overall interaction stabilities have the following trend: BA@g-C3N4 (A3) > TAA@g-C3N4 (A2) > AA@g-C3N4 (A1) > TBA@g-C3N4 (A4).
2.1.2. Interaction of Selected Molecules with Li/g-C3N4
The lithium metal is doped in pure g-C3N4 to analyze the adsorption behavior of Li/g-C3N4 toward selected toxic analytes. The selected toxic analytes, namely, AA, TAA, BA, and TBA, are allowed to adsorb at different sites of Li/g-C3N4 quantum dots resulting in complexes named AA@Li/g-C3N4 (B1), TAA@Li/g-C3N4 (B2), BA@Li/g-C3N4 (B3), and TBA@Li/g-C3N4 (B4) complexes. Among these complexes, B3 shows the highest Eint due to the presence of strong dispersion forces and π stacking (vide supra). However, in B3, the dint decreased to 1.93 Å as compared to A3 (2.11 Å). The stability of the B3 complex is followed by B1, B4, and B5 with the Eint of −25.14, −23.77, and −25.14 kcal/mol, respectively. The overall stabilities followed the trend as follows: BA@Li/g-C3N4 (B3) > AA@Li/g-C3N4 (B1) > TBA@Li/g-C3N4 (B4) > TAA@Li/g-C3N4 (B5).
The interaction energies are further calculated on other DFT functionals (Table 1) including B3LYP-D3 and M05-2X in order to investigate the contribution of Hartree–Fock exchange (ϵHF) on noncovalent interactions. For instance, B3LYP and M06-2X contain 25 and 27% of ϵHF, which are higher than that of ωB97XD (22%).63,64 It is found that the negative interaction energy increases with increasing ϵHF, e.g., the interaction energies of analytes with g-C3N4 and Li/g-C3N4 are respectively increased to −32.35 and −35.70 at B3LYP-D3 DFT, which are even higher than that at M05-2X due to the inclusion of an extra Grimme dispersion factor and excellent performances of B3LPY in modeling organic molecules.65−69 Moreover, the diffuse function at the ωB97XD/6-31+G(d,p) level of theory does not show prominent variation in the energetic stability of complexes, and the results are quite comparable.
From the overall results of geometric analysis, we can conclude that Li doping improves the adsorption of toxic molecules that can be justified with the increased interaction energy and close binding.69 The trend in interaction energy is graphically represented in Figure 4.
Figure 4.

Interaction energies (Eint) and zero-point vibrational corrected energies (Eint-ZPVE) of AA@g-C3N4 (A1), TAA@g-C3N4 (A2), BA@g-C3N4 (A3), TBA@g-C3N4 (A4), AA@Li/g-C3N4 (B1), TAA@Li/g-C3N4 (B2), BA@Li/g-C3N4 (B3), and TBA@Li/g-C3N4 (B4) complexes.
After discussing the energetic stability of designed complexes, one may wonder whether the electronic energies provide an accurate trend in the interaction stability. In this regard, ZPVEs have been computed for all the complexes within the vibrational or harmonic approximation at the ωB97XD/6-31G(d,p) level. The comparison of interaction energies (Eint) obtained by considering the ground-state electronic energies and the interaction energies at ZPVE corrections (Eint-ZPVE) is displayed in Figure 4, which reveals the inclusion of ZPVE corrections trending well with the electronic Eint.
2.2. Reduced Density Gradient Analysis (RDG)
RDG analysis is a visual approach to elaborate the noncovalent interactions and is also known as noncovalent interaction (NCI) analysis.70 It differentiates the types of interactions based on their strengths by three colors of spikes, i.e., reddish, bluish, and greenish. These spikes represent the existence of steric repulsions, hydrogen bonding or halogen bonding, and van der Waals (dispersion) forces, respectively. NCI results include 3D isosurfaces and 2D RDG scatter graphs. In RDG scatter spectra, the sign(λ2)ρ(r) ranges between −0.05 and 0.05 au.71,72 The 2D scatter graphs and 3D isosurfaces of pure g-C3N4, Li/g-C3N4 complexes with molecules are shown in the Supporting Information in Figure S2.
In the case of AA@g-C3N4 and TAA@g-C3N4, the NCI isosurface illustrates that the flaky greenish and bluish patches appear, which is attributed to the presence of dispersion and electrostatic forces, respectively. Meanwhile, in AA@Li/g-C3N4 and TAA@Li/g-C3N4 complexes, the density of green patches reduces, and blue patches increase, which can be seen from the 2D RDG map (B1 and B2 in Figure S2). These greenish spikes in AA@g-C3N4 and TAA@g-C3N4 range between 0.015 to −0.01 au, while these spikes range between 0.015 and −0.09 au in Li-doped complexes of AA and TAA. The reduction of dispersion forces in Li-doped complexes of AA and TAA tends to decrease the interaction stability as compared to corresponding g-C3N4 complexes.
In BA@g-C3N4 and BA@Li/g-C3N4 complexes, the deep greenish flaky patches indicate that the dispersion forces dominate along with a small contribution of electrostatic forces, which is evidenced by a few blue patches between BA and g-C3N4. Moreover, the presence of dispersion forces can also be seen in the RDG map where greenish spikes appeared between −0.015 to 0.015 au and −0.02 to 0.01 au in BA@g-C3N4 and BA@Li/g-C3N4 complexes, respectively. This indicates that the high stability of BA molecules is due to the presence of dispersion forces, which arise due to the π stacking of benzyl rings of BA and the triazine ring of g-C3N4.
Finally, in the TBA@g-C3N4 complex, the blue patch in the 3D isosurface and the blue peak at −0.03 au of the 2D RDG map indicate the presence of strong hydrogen bonding, which arises because of Coloumbic interactions between the electronegative nitrogen atom of g-C3N4 and the electropositive hydrogen atom of TBA. However, in the case of TBA@Li/g-C3N4, a deep green flaky isosurface and a dense green peak in the RDG map at −0.01 to 0.01 au show the dominant dispersion forces (van der Waals forces) in the TBA@Li/g-C3N4 complex. These green spikes in the TBA@Li/g-C3N4 complex clearly explain high stability as compared to the TBA@g-C3N4 complex. Finally, the results generated from NCI analysis are in accord with the interaction thermodynamic analysis.
2.3. QTAIM Analysis
Bader’s quantum theory of atoms in molecules (QTAIM) is a topological analysis. It elaborates the nature of interactions, which cannot be predicted via structural analysis.73,74 The QTAIM parameters including electron density (ρ), Laplacian of the charge density (∇2ρ), total energy density (H), kinetic energy density (G), and potential energy density (V) are important parameters to evaluate the noncovalent interactions at a bond critical point (BCP). The total energy density can be calculated as the integral sum of electron potential energy and kinetic energy terms, as shown in the equation below.
The strength of interactions depends on the electron density term (ρ). For noncovalent interactions, the magnitude of ρ should be less than 0.1 au with the positive values of ∇2ρ and H and vice versa.75,76 The isosurfaces of all complexes are also given in Figure 5. In QTAIM analysis, the observed values of ρ less than 0.1 au with the positive value of ∇2ρ illustrate the presence of noncovalent interactions and vice versa. In our reported analytes@g-C3N4 complexes, the values of ρ and ∇2ρ are in the range of 0.004 to 0.033 and 0.015 to 0.084 au, respectively, which show the existence of noncovalent interactions in AA@g-C3N4, TAA@g-C3N4, BA@g-C3N4, and TBA@g-C3N4 complexes. The highest number of BCPs, i.e., 9 BCPs, is observed in BA@g-C3N4, which predicts the highest stability among all reported complexes of g-C3N4. The numbers of BCPs in AA and TAA are 7, whereas only 2 BCPs are observed in TBA complexes with the negative H values, indicating the presence of electrostatic interactions.
Figure 5.

Topological isosurfaces of analytes@g-C3N4 and analytes@Li/g-C3N4 complexes resulted from QTAIM analysis. (A1) AA@g-C3N4, (A2) TAA@g-C3N4, (A3) BA@g-C3N4, (A4) TBA@g-C3N4, (B1) AA@Li/g-C3N4, (B2) TAA@Li/g-C3N4, (B3) BA@Li/g-C3N4, and (B4) TBA@Li/g-C3N4.
Similarly, in the case of lithium metal-doped g-C3N4 (Li/g-C3N4) complexes, the highest number of BCPs is observed for the BA@Li/g-C3N4 complex, which indicates the highest number of interactions and high stability of BA with the surface. The number of BCPs decreased in AA@Li/g-C3N4 and TAA@Li/g-C3N4 complexes from 7 to 6, which also shows a decrease in the interaction energies. However, the number of BCPs increases in the TBA complex as compared to TBA@g-C3N4 with the increase in topological parameters, which is consistent with the interaction energies (vide supra). The values of topological parameters of analytes@Li/g-C3N4 complexes, namely, ρ and ∇2ρ, are in the range of 0.004 to 0.029 and 0.014 to 0.193 au, respectively. Espinosa et al.77,78 reported a method of estimating noncovalent interaction energies (E = V/2). The noncovalent interaction energies for all the complexes are not very high and are found between −0.0081 and −0.0010, which falls under the category of weak van der Waals forces.79,80 The overall result of topological parameters suggests the existence of dispersion forces with some electrostatic interactions at some bond critical points (see Table S1), whereas BA@g-C3N4 and BA@Li/g-C3N4 complexes are the most stable among all studied complexes. The results of QTAIM are very well-consistent with the energetic and NCI analyses.
2.4. Electronic Properties
FMO (frontier molecular orbitals) analysis is performed to study the electrochemical sensitivity of g-C3N4, which is analyzed by measuring the energy gap between the highest occupied molecular orbitals (HOMO) and the lowest unoccupied molecular orbitals (LUMO).79 The variation in the HOMO and LUMO gaps of bare, complexed, and Li-doped g-C3N4 along with their complexes is displayed in Table 2. The Egap values between the HOMO and LUMO of bare g-C3N4 and Li/g-C3N4 quantum dots are calculated before and after the complexation with toxic analytes. The energies of the HOMO and LUMO of g-C3N4 are −8.08 and −0.51 eV, respectively, while the energies of the HOMO and LUMO of lithium metal-doped g-C3N4 are −8.18 and −4.62 eV, respectively. The direct band gap of 7.58 eV can be observed in g-C3N4, which reduces to 3.56 eV in lithium metal-doped g-C3N4 due to doping. The literature reveals that Egap can effectively be reduced with the suitable dopant, which ultimately increases the conductivity.80,81 The Egap values of analytes@g-C3N4 are 7.49 (AA@g-C3N4), 6.22 (TAA@g-C3N4), 7.50 (BA@g-C3N4), and 7.27 eV (TBA@g-C3N4). These gaps are higher than the reported gaps obtained by Tulu et al. during their explosive adsorption on the g-C3N4,23 which justifies the electronic stability of the complexes. Similarly, the Egap values of analytes@Li/g-C3N4 are 3.47, 3.46, 3.49, and 3.27 eV in AA@Li/g-C3N4, TAA@Li/g-C3N4, BA@Li/g-C3N4, and TBA@Li/g-C3N4 complexes, respectively. The decrease in Egap after complexation indicates the increase in sensitivity and conductivity of the complexes.82 Apparently, in reported complexes, a small decrease in Egap is observed after complexation with the quantum dots, which indicates the generation of new molecular orbitals away from the Fermi level upon interaction.83 This result also suggests that Li/g-C3N4 complexes are more conductive as compared to g-C3N4 complexes. The values of Egap of lithium metal-doped complexes lie in the range of 3, whereas the values of the other complexes lie in the range of 7. The variation in the HOMO and LUMO can be seen in Figure 6, where the HOMO and LUMO are dispersed on the whole surface of g-C3N4 and Li/g-C3N4 quantum dots before complexation. After complexation, the HOMO tends to move between the analytes and the surface whereas the LUMO resides on the side of the surface away from the analytes in analytes@g-C3N4 complexes. In the case of Li/g-C3N4 complexes, an opposite behavior can be seen where the HOMO resides on the surface and the LUMO prefers to move between the analytes and the surface. The variation in Egap and shifting of orbitals cause the charge transfer between the interacting species.84 Therefore, NBO charge analysis is performed to evaluate the charge transfer.85 The values of NBO charges are given in Table 2. The negative sign with the NBO charges indicates that the charge is being transferred from the surface to the analytes and vice versa. Ibarra-Rodríguez and Sánchez also observed the shifting of charges from g-C3N4 toward the analyte,86 which justifies our results. The appreciable amount of charge transfer is observed in all reported complexes. In analytes@g-C3N4 complexes, the highest charge transfer is observed in TAA@g-C3N4, which is probably due to the lowest Egap (6.22 eV). Meanwhile, the amounts of charge transfers in AA@g-C3N4, BA@g-C3N4, and TBA@g-C3N4 complexes are −0.023, −0.029, and −0.008 eV, respectively. In the case of Li-doped complexes, −0.002, 0.008, −0.017, and −0.014 eV of charge transfer are observed in AA@Li/g-C3N4, TAA@Li/g-C3N4, BA@Li/g-C3N4, and TBA@Li/g-C3N4 complexes, respectively. Unexpectedly, a positive charge transfer is observed in the TAA@Li/g-C3N4 complex, which might be due to the lone pairs of the sulfur atom, which tends to transfer charges toward the nitrogen atom of the surface. Overall, the transfer of charge after complexation is due to the rearrangement of electrons of g-C3N4 and Li/g-C3N4 quantum dots, which is vital to producing electric signals in sensor applications.
Table 2. Parameters Including the HOMO–LUMO Energies, Energy Gap, NBO Charge Transfer, Wavelength (λmax) in eV and nm along with the Oscillating Frequency (f), and Variable Excitation Energies (ΔE in eV) of Analytes@g-C3N4 and Li/g-C3N4 Complexesa.
| complex | HOMO (eV) | LUMO (eV) | Eg(eV) | NBO (e–) | λmax(eV) | λmax(nm) | f | ΔE(eV) |
|---|---|---|---|---|---|---|---|---|
| A | –8.08 | –0.51 | 7.58 | 4.96 | 250 | 0.290 | 4.96 | |
| A1 | –8.07 | –0.58 | 7.49 | –0.023 | 4.35 | 285 | 0.024 | 4.35 |
| A2 | –6.91 | –0.70 | 6.22 | –0.035 | 4.37 | 284 | 0.021 | 4.90 |
| A3 | –8.07 | –0.56 | 7.50 | –0.029 | 4.90 | 253 | 0.089 | 4.38 |
| A4 | –7.88 | –0.61 | 7.27 | –0.008 | 4.81 | 258 | 0.120 | 4.80 |
| B | –8.18 | –4.62 | 3.56 | 1.78 | 695 | 0.221 | 1.78 | |
| B1 | –7.97 | –4.50 | 3.47 | –0.002 | 1.65 | 749 | 0.106 | 1.29 |
| B2 | –8.08 | –4.61 | 3.46 | 0.008 | 1.99 | 623 | 0.171 | 1.92 |
| B3 | –8.02 | –4.53 | 3.49 | –0.017 | 1.92 | 645 | 0.187 | 1.99 |
| B4 | –8.00 | –4.72 | 3.27 | –0.014 | 1.18 | 1049 | 0.165 | 1.18 |
(A) g-C3N4, (A1) AA@g-C3N4, (A2) TAA@g-C3N4, (A3) BA@g-C3N4, (A4) TBA@g-C3N4, (B) Li/g-C3N4, (B1) AA@Li/g-C3N4, (B2) TAA@Li/g-C3N4, (B3) BA@Li/g-C3N4, and (B4) TBA@Li/g-C3N4.
Figure 6.

Graphical representation of changes in HOMO–LUMO gaps. (A) g-C3N4, (A1) AA@g-C3N4, (A2) TAA@g-C3N4, (A3) BA@g-C3N4, (A4) TBA@g-C3N4, (B) Li/g-C3N4, (B1) AA@Li/g-C3N4, (B2) TAA@Li/g-C3N4, (B3) BA@Li/g-C3N4, and (B4) TBA@Li/g-C3N4.
2.5. Charge Decomposition Analysis (CDA)
Charge decomposition analysis (CDA) is a technique used to study the donor–acceptor interactions in terms of charge donation and backdonation. This technique was first developed by Frenking et al.87 In this approach, the molecular orbitals, either Kohn–Sham or Hartree–Fock, of donor–acceptor molecules are transformed to the nonorthogonal basis provided by the superposition of orbitals of the donor and acceptor units. Practically, the orbitals of the donor, acceptor, and their combined form are obtained in the same basis set of contracted Gaussian-type functions; thus, it is possible to account for the total density in the new basis set in terms of the overlap matrix between donor and acceptor units. Consequently, the CDA technique has proven to be effective for estimating the relative strength of charge fluctuation, e.g., donation and backdonation between the donor–acceptor molecules. Herein, CDA analysis is executed to analyze the relative strength of interactions between analytes and g-C3N4 in terms of charge density.87 The results of CDA for analytes@g-C3N4 and Li/g-C3N4 complexes are summarized in Table 3.
Table 3. CDA Results of Bare g-C3N4 and Li/g-C3N4 Including Donation (d), Backdonation (b), Residual (d – b), and Repulsion (r) of Analytes@h-g-C3N4 Complexesa.
| complex | donation (d) | backdonation (b) | residual (d – b) | repulsion (r) |
|---|---|---|---|---|
| A1 | 0.036 | 0.035 | 0.001 | –0.065 |
| A2 | 0.022 | 0.026 | –0.004 | –0.059 |
| A3 | 0.047 | 0.027 | 0.019 | –0.119 |
| A4 | 0.019 | 0.057 | –0.037 | –0.029 |
| B1 | 0.005 | 0.061 | –0.055 | –0.015 |
| B2 | 0.011 | 0.034 | –0.023 | –0.031 |
| B3 | 0.012 | 0.069 | –0.057 | –0.036 |
| B4 | 0.006 | 0.034 | –0.027 | –0.043 |
Note: (A1) AA@g-C3N4, (A2) TAA@g-C3N4, (A3) BA@g-C3N4, (A4) TBA@g-C3N4, (B1) AA@Li/g-C3N4, (B2) TAA@Li/g-C3N4, (B3) BA@Li/g-C3N4, and (B4) TBA@Li/g-C3N4.
According to the CDA results listed in Table 3, the donations of charges from the surface to analytes in AA@g-C3N4, TAA@g-C3N4, BA@g-C3N4, and TBA@g-C3N4 are 0.036, 0.022, 0.047, and 0.019 e–, while the backdonations are 0.035, 0.026, 0.027, and 0.057 e–, respectively. By analyzing these results, we observed that the high amount of charge donation is seen in AA@g-C3N4 (0.036 e–) and BA@g-C3N4 (0.047 e–) complexes. The reason is the transfer of charge density from the p orbital of the nitrogen atom of the quantum dot toward the interacting s orbitals of the hydrogen atoms of analytes. However, the higher amount of backdonation is seen in TAA@g-C3N4 (0.035 e–) and TBA@g-C3N4 (0.057 e–) complexes because the electron-rich sulfur atoms of these analytes have the ability to donate more electronic density as compared to nitrogen atoms. Thus, backdonation is more pronounced than donation. These results are similar to the results obtained by Iqbal and co-workers for delivery of carboplatin through g-C3N4 where charge transfer is supported by CDA analysis.88 In the case of Li/g-C3N4 quantum dots, backdonation is more prominent in all the reported complexes. The values of backdonation are 0.061, 0.034, 0.069, and 0.034 e– in AA@Li-g/C3N4, TAA@Li-g/C3N4, BA@Li-g/C3N4, and TBA@Li-g/C3N4 complexes, whereas values of donation are 0.005, 0.011, 0.012, and 0.006 e–, respectively. The negative values of residual charge are also defining dominant backdonations.29 The positive values of repulsion explain the accumulation of charge density within the interaction regions and vice versa. However, in our reported complexes of g-C3N4 and Li/g-C3N4, the negative values of repulsion explain the accumulation of charges density away from the interacting region.28 The charge transfer between the surface and harmful molecules confirmed the sensitivity of the respected surface for the detection of selected harmful molecules, as observed by Tulu et al. during explosive detection of g-C3N4.23 The charge transfer between the surface and analytes results in stronger interactions, which is justified from the interaction energies of all complexes (as discussed vide supra).
2.6. UV–Visible Analysis
The electronic excitation properties play an important role in understanding the sensitivity of considered analytes toward the quantum dots.89Table 2 presents the UV–vis results of g-C3N4 and Li/g-C3N4 quantum dots along with their complexes. Meanwhile, the graphical representation of shifting of the wavelength is displayed in Figure 7. According to the observed results, the wavelength (λmax) value of bare g-C3N4 is 250 nm along with an excitation energy (Eex) of 4.96 eV. For all the reported complexes of g-C3N4, an increase in the wavelength (λmax) (redshift) and a decrease in excitation energy (Eexc) can be seen, which indicates the increase in π to π* electronic transitions.90 The value of λmax in AA@g-C3N4, TAA@g-C3N4, BA@g-C3N4, and TBA@g-C3N4 complexes increases from 250 to 285, 284, 253, and 258 nm, respectively. Strange behavior is observed for Li-doped quantum dots with analytes. In our previous work on detection of heptazine on pure g-C3N4 quantum dots (λmax = 249 nm), we noticed a redshift after heptazine adsorption (λmax up to 286 nm), and similar results are obtained in the current study. The value of the wavelength (λmax) for Li/g-C3N4 is 695 nm, which changes to 749 and 1049 in AA@Li/g-C3N4 and TBA@Li/g-C3N4 complexes resulting in the redshift. Surprisingly, TAA@Li/g-C3N4 and BA@Li/g-C3N4 show a blueshift with the λmax of 623 and 645 nm, respectively. This blueshift might be due to the increase in the transition energies from 1.78 to 1.99 and 1.92, which makes it difficult to move electrons from the ground state to the excited state. The λmax has an inverse relationship with the excitation energy, i.e., the smaller excitation energy of a complex results in the longer λmax of this complex. On the other side, the higher excitation energy results in the shorter λmax. The excitation energy is directly linked with the HOMO and LUMO gap; with a smaller gap between the HOMO and LUMO, a lower excitation energy is required for electronic excitation and vice versa, which affects the λmax. The pure g-C3N4 has the highest gap of 7.58 eV, and it has the lowest λmax of 250 nm (see Figure 8). All doped complexes of g-C3N4 follow the same trend of an increase in λmax with a decrease of the HOMO–LUMO gap except TAA@Li/g-C3N4 and BA@Li/g-C3N4. Comparatively, TBA@Li/g-C3N4 has the lowest gap of 3.27, and it has the highest λmax of 1049 nm among all complexes. Xia et al. also observed the λmax between 430 and 800 nm when g-C3N4 quantum dots interact with BiOBr,91 which justifies our results.
Figure 7.

UV–vis analysis of g-C3N4 and Li/g-C3N4 with their complexes.
Figure 8.

Inverse relationship between the λmax and energy gaps of g-C3N4 (A) and TBA@Li/g-C3N4 (B4).
The reduction in energy gaps results in a decrease of the excitation energies, and ultimately, high absorption maxima are obtained (as discussed vide supra). In the A (1–4) series complexes, the excitation energy is higher, so the wavelength is shorter. In the case of B (1–4) complexes, the excitation energy is lower, and the wavelength is high, which is reflected in their values (Table 2). The only thing that we can see here is that the excitation energy of Li@complexes B (1–4) is much lower, which is responsible for the longer wavelength (shifts in UV–vis spectra). From the overall results of UV–vis analysis, we can conclude that Li/g-C3N4 can act as a good optical sensor for hazardous molecules as they show λmax in the visible region of the electromagnetic spectrum.
3. Conclusions
Herein, we demonstrated the sensing of hazardous molecules including acetamide (AA), benzamide (BA), and their thio-analogues (thioacetamide (TAA) and thiobenzamide (TBA)) by using heptazine-based graphitic (g-C3N4) and Li metal-doped g-C3N4 quantum dots. All the calculations were carried out at the ωB97XD/6-31G
(d,p) level of theory. The interaction energies (Eint) are observed in the range of −17.20 to −29.72 kcal/mol for analyte g-C3N4 complexes and −20.98 to −30.98 kcal/mol for analyte Li metal-doped g-C3N4 complexes. In both cases with or without Li metal doping, the highest interaction energy is observed for the benzamide (BA) analyte. The interaction energy of benzamide and thiobenzamide is improved in Li/g-C3N4 quantum dots, whereas g-C3N4 gave better response for acetamide (AA) and thioacetamide (TAA). NCI and QTAIM analyses also evidenced the presence of significant noncovalent dispersion and electrostatic forces in g-C3N4 and Li/g-C3N4. Subsequently, the electronic properties reveal that doping of g-C3N4 with lithium metal appreciably increases the conductivity of the quantum dot. Charge decomposition analysis (CDA) shows the prominent donation of electrons from g-C3N4 to acetamide and benzamide, whereas backdonation is more prominent in their thio-analogues. Meanhwile, in Li/g-C3N4, backdonation is more efficient in all the reported complexes. Finally, UV–visible analysis shows the redshift for all the reported complexes of g-C3N4. Meanwhile, in Li/g-C3N4, a high redshift is observed in AA@Li/g-C3N4 and TBA@Li/g-C3N4 complexes, while a blueshift is observed in TAA@Li/g-C3N4 and BA@Li/g-C3N4 complexes. Overall results conclude that Li/g-C3N4 can be an effective electrochemical sensor for selected analytes, whereas UV results suggest that g-C3N4 can be an efficient optical gas sensor for selected toxic molecules due to the prominent redshift. Li/g-C3N4 can only be used as an optical gas sensor for acetamide and thiobenzamide toxic molecules. If we talk about only benzamide, which is the most stable toxic molecule out of all reported molecules, we can conclude that Li/g-C3N4 gave better interaction energy and can be a good electrochemical sensor for benzamide toxic molecules. Moreover, when compared, Li/h-g-C3N4 quantum dots can be a potential candidate for electrochemical applications, whereas g-C3N4 can be a potential candidate for optical applications.
4. Computational Methodologies
The structural optimization and result visualizations were carried out using Gaussian 0992 and GaussView 5.093 software packages, respectively. ωB97XD/6-31G(d,p)94 was employed for the geometry optimization and interaction energy calculations of pure g-C3N4 and Li/g-C3N4 quantum dots. Cui and Yang developed the ωB97XD density functional and found it to be the most reliable and accurate for the calculations of noncovalent interactions. It is a long-range corrected hybrid density functional95,96 and has already been employed on g-C3N4 sensing for neurotoxins97,98 and other chemical warfare agents.98,99 Moreover, the adsorption of pesticides29,98 on a similar surface (C4N) was also studied on the ωB97XD/6-31G(d,p) level of theory. Based on these studies, the implementation of the above-mentioned level of DFT is justified in such types of analyses. Therefore, we employed the calculations on the ωB97XD/6-31G(d,p) method. Among all possible orientations (Figure S1), the lowest-energy structures on the potential energy surface were chosen for further analysis, which are displayed in Figure 3. The convergence criteria for optimization were a maximum force less than 4.5 × 10⁻⁴ hartree/bohr with a root-mean-square force less than 3.0 × 10⁻⁴ hartree/bohr and a maximum displacement less than 1.8 × 10⁻³ hartree/bohr with a root-mean-square displacement less than 1.2 × 10⁻³ hartree/bohr. All these quantitative parameters ensure the accuracy of the results.
The interaction energies of g-C3N4 and Li/g-C3N4 with toxic analytes were performed by using the equations given below:
| 1 |
| 2 |
where Eanalytes@g-C3N4, Eanalytes@Li/g-C3N4,Eg-C3N4,ELi/g-C3N4, and Etoxic analytes represent the energy of pure g-C3N4 and the Li/g-C3N4 complex, surfaces of g-C3N4 and Li/g-C3N4, and toxic analytes, respectively. The harmonic vibrational frequency calculations were carried out at the ωB97XD/6-31G(d,p) level of theory in order to obtain the zero-point vibrational corrections to interaction energies as well as to check the true minima of reported complexes with no imaginary frequency. The strength and nature of interactions were further studied by noncovalent interaction (NCI) and quantum theory of atoms in molecules (QTAIM) analyses.99 NCI analysis is a visual approach to elaborate the noncovalent interaction and a helpful tool for understanding the nature of interactions. In NCI analysis, the RDG graph follows the equation shown below.
| 3 |
where ρ represents the electronic density and Δρ represents the gradient of electronic density, whereas sign(λ2)ρ(r) differentiates attractive (when λ2 < 0) and repulsive (λ2 > 0) interactions. Both properties are observed by utilizing Multiwfn 3.8 software.97 We used the aforementioned level of theory for the observations of other electronic properties, including energies of the HOMO and LUMO, HOMO–LUMO energy gaps, and natural bond orbital (NBO) analysis. NBO 7.0 software was used to calculate the NBO charges.100 Moreover, the charge decomposition (CDA) analysis was carried out to study and visualize the charge separation between surfaces and selected analytes.101 The UV–vis calculations were performed to observe the electronic transitions upon the interaction of g-C3N4 and Li/g-C3N4 surfaces with the toxic analytes. The TD-DFT calculations for UV–vis absorption spectra were simulated with a total of 40 states; half of them were singlet states, and the other half were triplet states.
Acknowledgments
This work was supported by the Deanship of Scientific Research, Vice Presidency for Graduate Studies and Scientific Research, King Faisal University, Saudi Arabia [Grant No. 4137]. M.I. expresses appreciation to the Deanship of Scientific Research at King Khalid University Saudi Arabia through the research group program under Grant Number R.G.P. 2/569/44. The authors also acknowledge the Universiti Brunei Darussalam (UBD/RSCH/1.4/FICBF(b)/2022/049).
Supporting Information Available
The Supporting Information is available free of charge at https://pubs.acs.org/doi/10.1021/acsomega.3c07350.
Geometry optimization of A (1–4) and B (1–4) complexes, NCI isosurfaces (isovalue = 0.5 au) with 2D RDG spectra of A (1–4) and B (1–4), and Cartesian coordinates of pure g-C3N4, Li/g-C3N4, and A (1–4) and B (1–4) complexes (PDF)
The authors declare no competing financial interest.
Supplementary Material
References
- Lotfabadi P. Analyzing Passive Solar Strategies in the Case of High-Rise Building. Renew. Sustain. Energy Rev. 2015, 52, 1340–1353. 10.1016/j.rser.2015.07.189. [DOI] [Google Scholar]
- Frumkin H.; Frank L.; Frank L. D.; Jackson R. J.. Urban Sprawl and Public Health: Designing, Planning, and Building for Healthy Communities; Island Press, 2004. [Google Scholar]
- Havelaar A. H.; Kirk M. D.; Torgerson P. R.; Gibb H. J.; Hald T.; Lake R. J.; Praet N.; Bellinger D. C.; de Silva N. R.; Gargouri N.; Speybroeck N.; Cawthorne A.; Mathers C.; Stein C.; Angulo F. J.; Devleesschauwer B.; von Seidlein L. World Health Organization Global Estimates and Regional Comparisons of the Burden of Foodborne Disease in 2010. PLoS Med. 2015, 12 (12), e1001923 10.1371/journal.pmed.1001923. [DOI] [PMC free article] [PubMed] [Google Scholar]
- W. H. O. Global Status Report on Alcohol and Health 2018; World Health Organization, 2019.
- Mall R. K.; Gupta A.; Singh R.; Singh R. S.; Rathore L. S. Water Resources and Climate Change: An Indian Perspective. Curr. Sci. 2006, 1610–1626. [Google Scholar]
- Ramos V.; Vasconcelos V. Palytoxin and Analogs: Biological and Ecological Effects. Mar. Drugs 2010, 8 (7), 2021–2037. 10.3390/md8072021. [DOI] [PMC free article] [PubMed] [Google Scholar]
- Omer A. M. Energy, Environment and Sustainable Development. Renew. Sustain. energy Rev. 2008, 12 (9), 2265–2300. 10.1016/j.rser.2007.05.001. [DOI] [Google Scholar]
- Dincer C.; Bruch R.; Costa-Rama E.; Fernández-Abedul M. T.; Merkoçi A.; Manz A.; Urban G. A.; Güder F. Disposable Sensors in Diagnostics, Food, and Environmental Monitoring. Adv. Mater. 2019, 31 (30), 1806739 10.1002/adma.201806739. [DOI] [PubMed] [Google Scholar]
- Meixner H.; Lampe U. Metal Oxide Sensors. Sensors Actuators B Chem. 1996, 33 (1–3), 198–202. 10.1016/0925-4005(96)80098-0. [DOI] [Google Scholar]
- Liao C.; Yan F. Organic Semiconductors in Organic Thin-Film Transistor-Based Chemical and Biological Sensors. Polym. Rev. 2013, 53 (3), 352–406. 10.1080/15583724.2013.808665. [DOI] [Google Scholar]
- Kim H.-J.; Lee J.-H. Highly Sensitive and Selective Gas Sensors Using P-Type Oxide Semiconductors: Overview. Sensors Actuators B Chem. 2014, 192, 607–627. 10.1016/j.snb.2013.11.005. [DOI] [Google Scholar]
- Chopra N. G.; Luyken R. J.; Cherrey K.; Crespi V. H.; Cohen M. L.; Louie S. G.; Zettl A. Boron Nitride Nanotubes. Science (80-.). 1995, 269 (5226), 966–967. 10.1126/science.269.5226.966. [DOI] [PubMed] [Google Scholar]
- Zaporotskova I. V.; Boroznina N. P.; Parkhomenko Y. N.; Kozhitov L. V. Carbon Nanotubes: Sensor Properties. A Review. Mod. Electron. Mater. 2016, 2 (4), 95–105. 10.1016/j.moem.2017.02.002. [DOI] [Google Scholar]
- Zhao Q.; Gan Z.; Zhuang Q. Electrochemical Sensors Based on Carbon Nanotubes. Electroanal. An Int. J. Devoted to Fundam. Pract. Asp. Electroanal. 2002, 14 (23), 1609–1613. 10.1002/elan.200290000. [DOI] [Google Scholar]
- Parey V.; Abraham B. M.; Gaur N. K.; Thapa R. First-Principles Study of Two-Dimensional B-Doped Carbon Nanostructures for Toxic Phosgene Gas Detection. ACS Appl. Nano Mater. 2022, 5 (9), 12737–12745. 10.1021/acsanm.2c02623. [DOI] [Google Scholar]
- Das V. K.; Shifrina Z. B.; Bronstein L. M. Graphene and Graphene-like Materials in Biomass Conversion: Paving the Way to the Future. J. Mater. Chem. A 2017, 5 (48), 25131–25143. 10.1039/C7TA09418C. [DOI] [Google Scholar]
- Hussain S.; Chatha S. A. S.; Hussain A. I.; Hussain R.; Mehboob M. Y.; Muhammad S.; Ahmad Z.; Ayub K. Zinc-Doped Boron Phosphide Nanocluster as Efficient Sensor for SO2. J. Chem. 2020, 2020, 2629596 10.1155/2020/2629596. [DOI] [Google Scholar]
- Hussain S.; Hussain R.; Mehboob M. Y.; Chatha S. A. S.; Hussain A. I.; Umar A.; Khan M. U.; Ahmed M.; Adnan M.; Ayub K. Adsorption of Phosgene Gas on Pristine and Copper-Decorated B12N12 Nanocages: A Comparative DFT Study. ACS omega 2020, 5 (13), 7641–7650. 10.1021/acsomega.0c00507. [DOI] [PMC free article] [PubMed] [Google Scholar]
- Meng Z.; Stolz R. M.; Mendecki L.; Mirica K. A. Electrically-Transduced Chemical Sensors Based on Two-Dimensional Nanomaterials. Chem. Rev. 2019, 119 (1), 478–598. 10.1021/acs.chemrev.8b00311. [DOI] [PubMed] [Google Scholar]
- Yang W.; Gan L.; Li H.; Zhai T. Two-Dimensional Layered Nanomaterials for Gas-Sensing Applications. Inorg. Chem. Front. 2016, 3 (4), 433–451. 10.1039/C5QI00251F. [DOI] [Google Scholar]
- Ilager D.; Shetti N. P.; Reddy K. R.; Tuwar S. M.; Aminabhavi T. M. Nanostructured Graphitic Carbon Nitride (g-C3N4)-CTAB Modified Electrode for the Highly Sensitive Detection of Amino-Triazole and Linuron Herbicides. Environ. Res. 2022, 204, 111856 10.1016/j.envres.2021.111856. [DOI] [PubMed] [Google Scholar]
- Fronczak M.; Demby K.; Strachowski P.; Strawski M.; Bystrzejewski M. Graphitic Carbon Nitride Doped with the S-Block Metals: Adsorbent for the Removal of Methyl Blue and Copper (II) Ions. Langmuir 2018, 34 (25), 7272–7283. 10.1021/acs.langmuir.8b01041. [DOI] [PubMed] [Google Scholar]
- Tulu A.; Ibrahim W.; Shadloo M. S. Effects of Second-Order Slip Flow and Variable Viscosity on Natural Convection Flow of CNTs – Fe 3 O 4 /Water Hybrid Nanofluids due to Stretching Surface. J. Phys. Chem. Solids 2021, 149, 109777 10.1155/2021/8407194. [DOI] [Google Scholar]
- Bhati V. S.; Takhar V.; Raliya R.; Kumar M.; Banerjee R. Recent Advances in G-C 3 N 4 Based Gas Sensors for the Detection of Toxic and Flammable Gases: A Review. Nano Express 2022, 3 (1), 014003 10.1088/2632-959X/ac477b. [DOI] [Google Scholar]
- Du A.; Sanvito S.; Li Z.; Wang D.; Jiao Y.; Liao T.; Sun Q.; Ng Y. H.; Zhu Z.; Amal R.; Smith S. C. Hybrid Graphene and Graphitic Carbon Nitride Nanocomposite: Gap Opening, Electron–Hole Puddle, Interfacial Charge Transfer, and Enhanced Visible Light Response. J. Am. Chem. Soc. 2012, 134 (9), 4393–4397. 10.1021/ja211637p. [DOI] [PubMed] [Google Scholar]
- Dang V. T.; Nguyen T. T. O.; Truong T. H.; Le A. T.; Nguyen T. D. Facile Synthesis of Different ZnO Nanostructures for Detecting Sub-Ppm NO2 Gas. Mater. Today Commun. 2020, 22, 100826 10.1016/j.mtcomm.2019.100826. [DOI] [Google Scholar]
- Zou J.; Wu S.; Liu Y.; Sun Y.; Cao Y.; Hsu J.-P.; Shen Wee A. T.; Jiang J. An Ultra-Sensitive Electrochemical Sensor Based on 2D g-C3N4/CuO Nanocomposites for Dopamine Detection. Carbon N. Y. 2018, 130, 652–663. 10.1016/j.carbon.2018.01.008. [DOI] [Google Scholar]
- Asif M.; Sajid H.; Ayub K.; Ans M.; Mahmood T. A First Principles Study on Electrochemical Sensing of Highly Toxic Pesticides by Using Porous C4N Nanoflake. J. Phys. Chem. Solids 2022, 160, 110345 10.1016/j.jpcs.2021.110345. [DOI] [Google Scholar]
- Asif M.; Sajid H.; Ayub K.; Khan A. A.; Ahmad R.; Ans M.; Mahmood T. Nano-Porous C4N as a Toxic Pesticide’s Scavenger: A Quantum Chemical Approach. J. Mol. Graph. Model. 2022, 111, 108078 10.1016/j.jmgm.2021.108078. [DOI] [PubMed] [Google Scholar]
- Zhang H.; Du A.; Shi Q.; Zhou Y.; Zhang Y.; Tang Y. Adsorption Behavior of CO2 on Pristine and Doped Phosphorenes: A Dispersion Corrected DFT Study. J. CO2 Util. 2018, 24, 463–470. 10.1016/j.jcou.2018.02.005. [DOI] [Google Scholar]
- Shi Y.; Xia J.; Zhou M.; Li C.; Li H.; Gong Y.; Niu L.; Liu X. Exploration of the Toxic Target Gas Molecules for Layered and Tubular G-C3N4: Density Functional Theory. Appl. Surf. Sci. 2022, 571, 151230 10.1016/j.apsusc.2021.151230. [DOI] [Google Scholar]
- Cao J.; Qin C.; Wang Y.; Zhang B.; Gong Y.; Zhang H.; Sun G.; Bala H.; Zhang Z. Calcination Method Synthesis of SnO2/g-C3N4 Composites for a High-Performance Ethanol Gas Sensing Application. Nanomaterials 2017, 7 (5), 98. 10.3390/nano7050098. [DOI] [PMC free article] [PubMed] [Google Scholar]
- Basharnavaz H.; Habibi-Yangjeh A.; Kamali S. H. DFT Investigation for NH 3 Adsorption Behavior on Fe, Ru, and Os-Embedded Graphitic Carbon Nitride: Promising Candidates for Ammonia Adsorbent. J. Iran. Chem. Soc. 2020, 17 (1), 25–35. 10.1007/s13738-019-01747-7. [DOI] [Google Scholar]
- Zhu B.; Zhang L.; Cheng B.; Yu J. First-Principle Calculation Study of Tri-s-Triazine-Based g-C3N4: A Review. Appl. Catal. B Environ. 2018, 224, 983–999. 10.1016/j.apcatb.2017.11.025. [DOI] [Google Scholar]
- Ragupathi V.; Panigrahi P.; Subramaniam N. G. Bandgap Engineering in Graphitic Carbon Nitride: Effect of Precursors. Optik 2020, 202, 163601 10.1016/j.ijleo.2019.163601. [DOI] [Google Scholar]
- Wang Y.; Wang X.; Antonietti M. Polymeric Graphitic Carbon Nitride as a Heterogeneous Organocatalyst: From Photochemistry to Multipurpose Catalysis to Sustainable Chemistry. Angew. Chemie Int. Ed. 2012, 51 (1), 68–89. 10.1002/anie.201101182. [DOI] [PubMed] [Google Scholar]
- Mishra A.; Mehta A.; Basu S.; Shetti N. P.; Reddy K. R.; Aminabhavi T. M. Graphitic Carbon Nitride (g–C3N4)–Based Metal-Free Photocatalysts for Water Splitting: A Review. Carbon N. Y. 2019, 149, 693–721. 10.1016/j.carbon.2019.04.104. [DOI] [Google Scholar]
- Ong W.-J.; Tan L.-L.; Ng Y. H.; Yong S.-T.; Chai S.-P. Graphitic Carbon Nitride (g-C3N4)-Based Photocatalysts for Artificial Photosynthesis and Environmental Remediation: Are We a Step Closer To Achieving Sustainability?. Chem. Rev. 2016, 116 (12), 7159–7329. 10.1021/acs.chemrev.6b00075. [DOI] [PubMed] [Google Scholar]
- Perveen M.; Nazir S.; Arshad A. W.; Khan M. I.; Shamim M.; Ayub K.; Khan M. A.; Iqbal J. Therapeutic Potential of Graphitic Carbon Nitride as a Drug Delivery System for Cisplatin (Anticancer Drug): A DFT Approach. Biophys. Chem. 2020, 267, 106461 10.1016/j.bpc.2020.106461. [DOI] [PubMed] [Google Scholar]
- Dandia A.; Gupta S. L.; Saini P.; Sharma R.; Meena S.; Parewa V. Structure Couture and Appraisal of Catalytic Activity of Carbon Nitride (g-C3N4) Based Materials towards Sustainability. Curr. Res. Green Sustain. Chem. 2020, 3, 100039 10.1016/j.crgsc.2020.100039. [DOI] [Google Scholar]
- Ghashghaee M.; Azizi Z.; Ghambarian M. Adsorption of Iron(II, III) Cations on Pristine Heptazine and Triazine Polymeric Carbon Nitride Quantum Dots of Buckled and Planar Structures: Theoretical Insights. Adsorption 2020, 26 (3), 429–442. 10.1007/s10450-019-00197-0. [DOI] [Google Scholar]
- Ghashghaee M.; Azizi Z.; Ghambarian M. Conductivity Tuning of Charged Triazine and Heptazine Graphitic Carbon Nitride (g-C3N4) Quantum Dots via Nonmetal (B, O, S, P) Doping: DFT Calculations. J. Phys. Chem. Solids 2020, 141, 109422 10.1016/j.jpcs.2020.109422. [DOI] [Google Scholar]
- Chen Y.; Bai X. A Review on Quantum Dots Modified G-C3N4-Based Photocatalysts with Improved Photocatalytic Activity. Catalysts 2020, 10 (1), 142. 10.3390/catal10010142. [DOI] [Google Scholar]
- Wang W.; Yu J. C.; Shen Z.; Chan D. K. L.; Gu T. G-C 3 N 4 Quantum Dots: Direct Synthesis, Upconversion Properties and Photocatalytic Application. Chem. Commun. 2014, 50 (70), 10148–10150. 10.1039/C4CC02543A. [DOI] [PubMed] [Google Scholar]
- Abraham B. M. Adsorption of Cyanogen Halides (X-CN; X = F, Cl and Br) on Pristine and Fe, Mn Doped C60: A Highly Potential Gas Sensor. Mater. Today Commun. 2021, 26, 101901 10.1016/j.mtcomm.2020.101901. [DOI] [Google Scholar]
- Ruan L.; Xu G.; Gu L.; Li C.; Zhu Y.; Lu Y. The Physical Properties of Li-Doped g-C3N4Monolayer Sheet Investigated by the First-Principles. Mater. Res. Bull. 2015, 66, 156–162. 10.1016/j.materresbull.2015.02.044. [DOI] [Google Scholar]
- Opoku F.; Govender P. P. Adsorption Behaviour of Si Anchored on G-C3N4/Graphene van Der Waals Heterostructure for Selective Sensing of Toxic Gases: Insights from a First-Principles Study. Appl. Surf. Sci. 2020, 525, 146590 10.1016/j.apsusc.2020.146590. [DOI] [Google Scholar]
- Andrews L. E.; Banks T. M.; Bonin A. M.; Clay S. F.; Gillson A.-M. E.; Glover S. A. Mutagenic N-Acyloxy-N-Alkoxyamides: Probes for Drug–DNA Interactions. Aust. J. Chem. 2004, 57 (4), 377–381. 10.1071/CH03276. [DOI] [Google Scholar]
- Cho Y.-H.; Shin H.-S. Determination of Trace Levels of Acetamide, Propanamide, and Butyramide in Surface and Drinking Water Using Gas Chromatography–Mass Spectrometry after Derivatization with 9-Xanthydrol. Anal. Chim. Acta 2013, 787, 111–117. 10.1016/j.aca.2013.06.013. [DOI] [PubMed] [Google Scholar]
- Elbashir A. A.; Omar M. M. A.; Ibrahim W. A. W.; Schmitz O. J.; Aboul-Enein H. Y. Acrylamide Analysis in Food by Liquid Chromatographic and Gas Chromatographic Methods. Crit. Rev. Anal. Chem. 2014, 44 (2), 107–141. 10.1080/10408347.2013.829388. [DOI] [PubMed] [Google Scholar]
- Bals B.; Teymouri F.; Haddad D.; Julian W. A.; Vismeh R.; Jones A. D.; Mor P.; Van Soest B.; Tyagi A.; VandeHaar M.; Bringi V. Presence of Acetamide in Milk and Beef from Cattle Consuming AFEX-Treated Crop Residues. J. Agric. Food Chem. 2019, 67 (38), 10756–10763. 10.1021/acs.jafc.9b04030. [DOI] [PMC free article] [PubMed] [Google Scholar]
- Kerridge D. H. The Chemistry of Molten Acetamide and Acetamide Complexes. Chem. Soc. Rev. 1988, 17 (0), 181–227. 10.1039/cs9881700181. [DOI] [Google Scholar]
- Igbedioh S. O. Effects of Agricultural Pesticides on Humans, Animals, and Higher Plants in Developing Countries. Arch. Environ. Heal. An Int. J. 1991, 46 (4), 218–224. 10.1080/00039896.1991.9937452. [DOI] [PubMed] [Google Scholar]
- Koen Y. M.; Sarma D.; Hajovsky H.; Galeva N. A.; Williams T. D.; Staudinger J. L.; Hanzlik R. P. Protein Targets of Thioacetamide Metabolites in Rat Hepatocytes. Chem. Res. Toxicol. 2013, 26 (4), 564–574. 10.1021/tx400001x. [DOI] [PMC free article] [PubMed] [Google Scholar]
- Mousa A. A.; El-Gansh H. A. I.; Abd Eldaim M. A.; Mohamed M. A. E.-G.; Morsi A. H.; El Sabagh H. S. Protective Effect of Moringa Oleifera Leaves Ethanolic Extract against Thioacetamide-Induced Hepatotoxicity in Rats via Modulation of Cellular Antioxidant, Apoptotic and Inflammatory Markers. Environ. Sci. Pollut. Res. 2019, 26 (31), 32488–32504. 10.1007/s11356-019-06368-4. [DOI] [PubMed] [Google Scholar]
- Piscopo A.; Robert D.; Weber J. V. Influence of PH and Chloride Anion on the Photocatalytic Degradation of Organic Compounds: Part I. Effect on the Benzamide and Para-Hydroxybenzoic Acid in TiO2 Aqueous Solution. Appl. Catal. B Environ. 2001, 35 (2), 117–124. 10.1016/S0926-3373(01)00244-2. [DOI] [Google Scholar]
- Jayaram H. N.; Yalowitz J. A.; Arguello F.; GreeneJr J. F. Toxicity and Efficacy of Benzamide Riboside in Cancer Chemotherapy Models. Curr. Med. Chem. 2002, 9 (7), 787–792. 10.2174/0929867024606858. [DOI] [PubMed] [Google Scholar]
- Deichmann W. B.; Gerarde H. W.. Symptomatology and Therapy of Toxicological Emergencies; Elsevier, 2013. [Google Scholar]
- Kovac A. L. Prevention and Treatment of Postoperative Nausea and Vomiting. Drugs 2000, 59 (2), 213–243. 10.2165/00003495-200059020-00005. [DOI] [PubMed] [Google Scholar]
- Zhu G.; Lü K.; Sun Q.; Kawazoe Y.; Jena P. Lithium-Doped Triazine-Based Graphitic C3N4 Sheet for Hydrogen Storage at Ambient Temperature. Comput. Mater. Sci. 2014, 81, 275–279. 10.1016/j.commatsci.2013.08.015. [DOI] [Google Scholar]
- Jadoon T.; Ullah F.; Mahmood T.; Ayub K. Silver Cluster Decorated Graphene Nanoflakes for Selective and Accurate Detection of Nitroaniline Isomers; DFT Calculations. Mater. Sci. Semicond. Process. 2021, 134, 106023 10.1016/j.mssp.2021.106023. [DOI] [Google Scholar]
- Zhang L.; Ren D.; Ding W. High Hydrogen Storage Ability of a Decorated G-C3N4Monolayer Decorated with Both Mg and Li: A Density Functional Theory (DFT) Study. Int. J. Hydrogen Energy 2022, 47 (66), 28548–28555. 10.1016/j.ijhydene.2022.06.175. [DOI] [Google Scholar]
- Asif M.; Sajid H.; Ayub K.; Gilani M. A.; Mahmood T. Highly Accurate DFT Investigation for Triggering the Ultra-Strong Static and Dynamic Nonlinear Optical Properties of Superalkali Doped Aminated Graphdiyne (NH2-GDY) Donor-π-Acceptor (D-π-A) Quantum Dots. Polyhedron 2022, 215, 115695 10.1016/j.poly.2022.115695. [DOI] [Google Scholar]
- Huber R. G.; Margreiter M. A.; Fuchs J. E.; von Grafenstein S.; Tautermann C. S.; Liedl K. R.; Fox T. Heteroaromatic π-Stacking Energy Landscapes. J. Chem. Inf. Model. 2014, 54 (5), 1371–1379. 10.1021/ci500183u. [DOI] [PMC free article] [PubMed] [Google Scholar]
- Jomaa I.; Issaoui N.; Roisnel T.; Marouani H. Insight into Non-Covalent Interactions in a Tetrachlorocadmate Salt with Promising NLO Properties: Experimental and Computational Analysis. J. Mol. Struct. 2021, 1242, 130730 10.1016/j.molstruc.2021.130730. [DOI] [Google Scholar]
- Sagaama A.; Issaoui N.; Al-Dossary O.; Kazachenko A. S.; Wojcik M. J. Non Covalent Interactions and Molecular Docking Studies on Morphine Compound. J. King Saud Univ. - Sci. 2021, 33 (8), 101606 10.1016/j.jksus.2021.101606. [DOI] [Google Scholar]
- Ramalingam A.; Sambandam S.; Medimagh M.; Al-Dossary O.; Issaoui N.; Wojcik M. J. Study of a New Piperidone as an Anti-Alzheimer Agent: Molecular Docking, Electronic and Intermolecular Interaction Investigations by DFT Method. J. King Saud Univ. - Sci. 2021, 33 (8), 101632 10.1016/j.jksus.2021.101632. [DOI] [Google Scholar]
- Saji R. S.; Prasana J. C.; Muthu S.; George J.; Kuruvilla T. K.; Raajaraman B. R. Spectroscopic and Quantum Computational Study on Naproxen Sodium. Spectrochim. Acta Part A Mol. Biomol. Spectrosc. 2020, 226, 117614 10.1016/j.saa.2019.117614. [DOI] [PubMed] [Google Scholar]
- Rizwana F. B.; Muthu S.; Prasana J. C.; Abraham C. S.; Raja M. Spectroscopic (FT-IR, FT-Raman) Investigation, Topology (ESP, ELF, LOL) Analyses, Charge Transfer Excitation and Molecular Docking (Dengue, HCV) Studies on Ribavirin. Chem. Data Collect. 2018, 17–18, 236–250. 10.1016/j.cdc.2018.09.003. [DOI] [Google Scholar]
- Sajid H.; Ayub K.; Arshad M.; Mahmood T. Highly Selective Acridinium Based Cyanine Dyes for the Detection of DNA Base Pairs (Adenine, Cytosine, Guanine and Thymine). Comput. Theor. Chem. 2019, 1163, 112509 10.1016/j.comptc.2019.112509. [DOI] [Google Scholar]
- Khan S.; Sajid H.; Ayub K.; Mahmood T. Adsorption Behaviour of Chronic Blistering Agents on Graphdiyne; Excellent Correlation among SAPT, Reduced Density Gradient (RDG) and QTAIM Analyses. J. Mol. Liq. 2020, 316, 113860 10.1016/j.molliq.2020.113860. [DOI] [Google Scholar]
- Kenouche S.; Belkadi A.; Djebaili R.; Melkemi N. High Regioselectivity in the Amination Reaction of Isoquinolinequinone Derivatives Using Conceptual DFT and NCI Analysis. J. Mol. Graph. Model. 2021, 104, 107828 10.1016/j.jmgm.2020.107828. [DOI] [PubMed] [Google Scholar]
- Bartashevich E. V.; Pendás Á. M.; Tsirelson V. G. An Anatomy of Intramolecular Atomic Interactions in Halogen-Substituted Trinitromethanes. Phys. Chem. Chem. Phys. 2014, 16 (31), 16780–16789. 10.1039/C4CP01257G. [DOI] [PubMed] [Google Scholar]
- Saleh G.; Gatti C.; Lo Presti L.; Contreras-García J. Revealing Non-covalent Interactions in Molecular Crystals through Their Experimental Electron Densities. Chem.—Eur. J. 2012, 18 (48), 15523. 10.1002/chem.201201290. [DOI] [PubMed] [Google Scholar]
- Varadwaj A.; Marques H. M.; Varadwaj P. R. Is the Fluorine in Molecules Dispersive? Is Molecular Electrostatic Potential a Valid Property to Explore Fluorine-Centered Non-Covalent Interactions?. Molecules 2019, 24 (3), 379. 10.3390/molecules24030379. [DOI] [PMC free article] [PubMed] [Google Scholar]
- Lefebvre C.; Rubez G.; Khartabil H.; Boisson J.-C.; Contreras-García J.; Hénon E. Accurately Extracting the Signature of Intermolecular Interactions Present in the NCI Plot of the Reduced Density Gradient versus Electron Density. Phys. Chem. Chem. Phys. 2017, 19 (27), 17928–17936. 10.1039/C7CP02110K. [DOI] [PubMed] [Google Scholar]
- Espinosa E.; Lecomte C.; Molins E. Experimental Electron Density Overlapping in Hydrogen Bonds: Topology vs. Energetics. Chem. Phys. Lett. 1999, 300 (5), 745–748. 10.1016/S0009-2614(98)01399-2. [DOI] [Google Scholar]
- Yar M.; Hashmi M. A.; Ayub K. Nitrogenated Holey Graphene (C2N) Surface as Highly Selective Electrochemical Sensor for Ammonia. J. Mol. Liq. 2019, 296, 111929 10.1016/j.molliq.2019.111929. [DOI] [Google Scholar]
- Paul A.; Thomas R. Evidences for Sulfur Centered Hydrogen Bond with Sulfur Atoms as a Donor in Aromatic Thiols and Aliphatic Thiols in Aqueous Solution. J. Mol. Liq. 2022, 348, 118078 10.1016/j.molliq.2021.118078. [DOI] [Google Scholar]
- Khan S.; Yar M.; Kosar N.; Ayub K.; Arshad M.; Zahid M. N.; Mahmood T. First-Principles Study for Exploring the Adsorption Behavior of G-Series Nerve Agents on Graphdyine Surface. Comput. Theor. Chem. 2020, 1191, 113043 10.1016/j.comptc.2020.113043. [DOI] [Google Scholar]
- R D.; Verma A.; Choudhary B. C.; Sharma R. K. New Insights into NO Adsorption on Alkali Metal and Transition Metal Doped Graphene Nanoribbon Surface: A DFT Approach. J. Mol. Graph. Model. 2022, 111, 108109 10.1016/j.jmgm.2021.108109. [DOI] [PubMed] [Google Scholar]
- Liu G.; Niu P.; Sun C.; Smith S. C.; Chen Z.; Lu G. Q. M.; Cheng H.-M. Unique Electronic Structure Induced High Photoreactivity of Sulfur-Doped Graphitic C3N4. J. Am. Chem. Soc. 2010, 132 (33), 11642–11648. 10.1021/ja103798k. [DOI] [PubMed] [Google Scholar]
- Rad A. S.; Ayub K. Adsorption of Thiophene on the Surfaces of X12Y12 (X= Al, B, and Y= N, P) Nanoclusters; A DFT Study. J. Mol. Liq. 2017, 238, 303–309. 10.1016/j.molliq.2017.05.020. [DOI] [Google Scholar]
- Yu S.; Zheng W.; Wang C.; Jiang Q. Nitrogen/Boron Doping Position Dependence of the Electronic Properties of a Triangular Graphene. ACS Nano 2010, 4 (12), 7619–7629. 10.1021/nn102369r. [DOI] [PubMed] [Google Scholar]
- Khan M. U.; Ibrahim M.; Khalid M.; Braga A. A. C.; Ahmed S.; Sultan A. Prediction of Second-Order Nonlinear Optical Properties of D−π–A Compounds Containing Novel Fluorene Derivatives: A Promising Route to Giant Hyperpolarizabilities. J. Clust. Sci. 2019, 30 (2), 415–430. 10.1007/s10876-018-01489-1. [DOI] [Google Scholar]
- Ibarra-Rodríguez M.; Sánchez M. Theoretical Study of Boron, Beryllium and Lithium Clusters (N = 2–6), Adsorption on Graphitic Carbon Nitride and the Study of Acceptor-Donor Orbital of the Coordination of a Styrene Molecule on [Cluster/g-C3N4] Systems. J. Mol. Graph. Model. 2021, 102, 107772 10.1016/j.jmgm.2020.107772. [DOI] [PubMed] [Google Scholar]
- García Hernández M.; Beste A.; Frenking G.; Illas F. Charge Decomposition Analysis of the Chemisorption Bond. Chem. Phys. Lett. 2000, 320 (3–4), 222–228. 10.1016/S0009-2614(00)00160-3. [DOI] [Google Scholar]
- Shamim M.; Perveen M.; Nazir S.; Hussnain M.; Mehmood R.; Khan M. I.; Iqbal J. DFT Study of Therapeutic Potential of Graphitic Carbon Nitride (g-C3N4) as a New Drug Delivery System for Carboplatin to Treat Cancer. J. Mol. Liq. 2021, 331, 115607 10.1016/j.molliq.2021.115607. [DOI] [Google Scholar]
- Liu X.; Hamilton I. Adsorption of Small Molecules on Helical Gold Nanorods: A Relativistic Density Functional Study. J. Comput. Chem. 2014, 35 (27), 1967–1976. 10.1002/jcc.23711. [DOI] [PubMed] [Google Scholar]
- Weston M.; Tjandra A. D.; Chandrawati R. Tuning Chromatic Response, Sensitivity, and Specificity of Polydiacetylene-Based Sensors. Polym. Chem. 2020, 11 (2), 166–183. 10.1039/C9PY00949C. [DOI] [Google Scholar]
- Xia J.; Di J.; Li H.; Xu H.; Li H.; Guo S. Ionic Liquid-Induced Strategy for Carbon Quantum Dots/BiOX (X = Br, Cl) Hybrid Nanosheets with Superior Visible Light-Driven Photocatalysis. Appl. Catal. B Environ. 2016, 181, 260–269. 10.1016/j.apcatb.2015.07.035. [DOI] [Google Scholar]
- Frisch M.J.; Trucks G.W.; Schlegel H.B.; Scuseria G.E.; Robb M.A.; Cheeseman J.R.; Scalmani G.; Barone V.; Mennucci B.; Petersson G.A.; Nakatsuji H.; Caricato M.; Li X.; Hratchian H.P.; Izmaylov A.F.; Bloino J.; Zheng G.; Sonnenberg J.L.; Hada M.; Ehara M.; Toyota K.; Fukuda R.; Hasegawa J.; Ishida M.; Nakajima T.; Honda Y.; Kitao O.; Nakai H.; Vreven T.; Montgomery J.A. Jr.; Peralta J.E.; Ogliaro F.; Bearpark M.; Heyd J.J.; Brothers E.; Kudin K.N.; Staroverov V. N.; Normand R.K.J.; Raghavachari K.; Rendell A.; Burant J.C.; Iyengar S.S.; Tomasi J.; Rega M.C.N.; Millam J.M.; Klene M.; Knox J.E.; Cross J.B.; Bakken V.; Adamo C.; Gomperts J.J.R.; Stratmann R.E.; Yazyev O.; Austin A.J.; Cammi R.; Pomelli C.; Ochterski J.W.; Martin R.L.; Morokuma K.; Zakrzewski V. G.; Voth G.A.; Salvador P.; Dannenberg J.J.; Dapprich S.; Daniels A.D.; ¨Farkas O.; Foresman J.B.; Ortiz J.V.; Cioslowski J. D. J. F.; Gaussian 09, Revision D.01; Gaussian, Inc.: Wallingford CT, 2009.
- Dennington Roy; Keith Todd; Millam J.. GaussView 5.0; Semichem Inc.: Shawnee Mission KS, (2009).
- Zahid S.; Rasool A.; Ans M.; Yaseen M.; Iqbal J. Quantum Chemical Approach of Donor– π–Acceptor Based Arylborane–Arylamine Macrocycles with Outstanding Photovoltaic Properties Toward High-Performance Organic Solar Cells. Energy Fuels 2021, 35 (18), 15018–15032. 10.1021/acs.energyfuels.1c02260. [DOI] [Google Scholar]
- Cui G.; Yang W. Challenges with Range-Separated Exchange-Correlation Functionals in Time-Dependent Density Functional Theory Calculations. Mol. Phys. 2010, 108 (19–20), 2745–2750. 10.1080/00268976.2010.523442. [DOI] [Google Scholar]
- Wang Y.-S.; Shen K.-L.; Chao S. D. A Density Functional Theory Study of Double Proton Transfer Reactions in Formamide, Formamide-Formic Acid and Formic Acid Dimers. Chin. J. Phys. 2017, 55 (3), 719–728. 10.1016/j.cjph.2017.01.001. [DOI] [Google Scholar]
- Pandiyan B. V.; Deepa P.; Kolandaivel P. Do Resonance-Assisted Intramolecular Halogen Bonds Exist without a Charge Transfer and a σ-Hole?. Phys. Chem. Chem. Phys. 2015, 17 (41), 27496–27508. 10.1039/C5CP03625A. [DOI] [PubMed] [Google Scholar]
- Qureshi S.; Asif M.; Sajid H.; Gilani M. A.; Ayub K.; Mahmood T. First-Principles Study for Electrochemical Sensing of Neurotoxin Hydrazine Derivatives via h-g-C3N4 Quantum Dot. Surf. Interfaces 2022, 30, 101913 10.1016/j.surfin.2022.101913. [DOI] [Google Scholar]
- Qureshi S.; Asif M.; Sajid H.; Gilani M. A.; Ayub K.; Arshad M.; Mahmood T. Electrochemical Sensing of Heptazine Graphitic C3N4 Quantum Dot for Chemical Warfare Agents; a Quantum Chemical Approach. Mater. Sci. Semicond. Process. 2022, 148, 106753 10.1016/j.mssp.2022.106753. [DOI] [Google Scholar]
- Lu T.; Chen F. Multiwfn: A Multifunctional Wavefunction Analyzer. J. Comput. Chem. 2012, 33 (5), 580–592. 10.1002/jcc.22885. [DOI] [PubMed] [Google Scholar]
- Gangadharan R. P.; Krishnan S. S. Natural Bond Orbital (NBO) Population Analysis of 1-Azanapthalene-8-Ol. Acta Phys. Polym. A 2014, 125 (1), 18. 10.12693/APhysPolA.125.18. [DOI] [Google Scholar]
Associated Data
This section collects any data citations, data availability statements, or supplementary materials included in this article.