

Summary
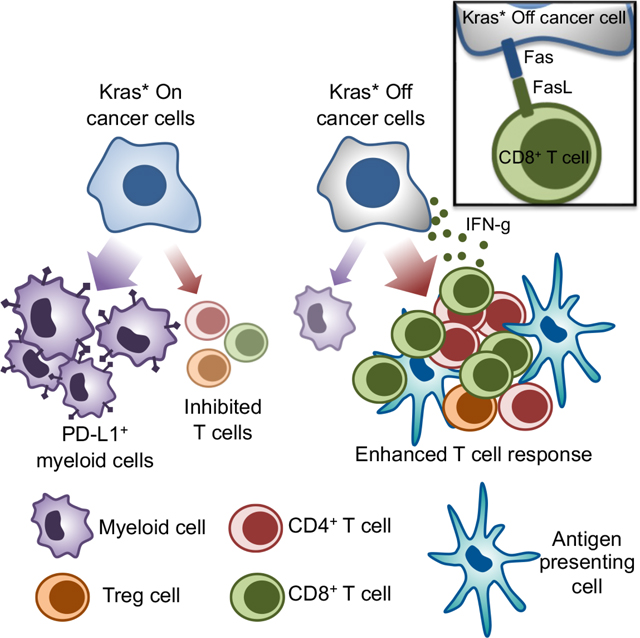
Oncogenic KrasG12D (Kras*) is critical for the initiation and maintenance of pancreatic ductal adenocarcinoma (PDAC), and a known repressor of tumor immunity. Conditional elimination of Kras* in genetic mouse models of PDAC leads to reactivation of Fas, CD8+ T cell mediated apoptosis, and complete eradication of tumors. Kras* elimination recruits activated CD4+ and CD8+ T cells and promotes the activation of antigen presenting cells. Mechanistically, Kras* mediated immune evasion involves epigenetic regulation of the Fas death receptor in cancer cells, via methylation of its promoter region. Further, analysis of human RNA sequencing identifies that high KRAS expressing PDAC tumors show a lower proportion of CD8+ T cells and demonstrate shorter survival compared to patients with low KRAS expression. This study highlights the role of CD8+ T cells in eradication of PDAC following Kras* elimination and provides rationale for combination of Kras* targeting with immunotherapy to control PDAC
eTOC blurb:
Mahadevan et al. report that KrasG12D epigenetically upregulates Fas death receptors in pancreatic cancer, with KrasG12D depletion enabling FasL expressing CD8+ T cells to eradicate tumors. Another study using inhibitor against KrasG12D in multiple PDAC models (Mahadevan and McAndrews et al. in Cancer Cell) shows similar mechanisms of tumour regression.
Graphical Abstract
Introduction
Pancreatic ductal adenocarcinoma (PDAC) can be characterized by a spectrum of T cell infiltration, from low to high with CD8+ T cell high tumors having better clinical outcomes as shown in previous studies 1,2. While immune checkpoint blockade therapy (iCBT) has revolutionized the treatment of cancers such as melanoma, bladder cancer, lymphomas and colorectal cancers 3,4, PDAC patients remain refractory to iCBT, with no survival benefit observed in clinical trials to date 5–7. Such failure to respond to iCBT has been in part attributed to the unique immunosuppressive PDAC TME, low neo-epitope burden, and possible lack of tumor infiltrating effector T cells 8,9. Oncogenic Kras (Kras*) plays an important role in inducing an immunosuppressive TME 9–13. Kras* is a dominant driver of PDAC, promoting tumor initiation, cancer cell survival, proliferation, and sustaining tumor maintenance 14–16. Deciphering the precise role of Kras* in shaping the immune microenvironment and understanding the nodes of regulation governing immune infiltration in PDAC is central to the development of effective therapeutic strategies.
Critical knowledge gaps persist in our understanding of the complex desmoplastic reaction associated with PDAC and the molecular underpinnings of immunosuppression. Given that Kras* is critical for PDAC initiation and maintenance, studies have attempted to develop inhibitors to target Kras* 17 and its downstream targets such as MEK and PI3K 18. However, despite prolonging overall survival of PDAC models, inhibitors of Kras* and its surrogate pathways failed to eradicate tumors. The Kras* target engagement efficacy of the inhibitors, the underlying mechanisms of PDAC progression, and the role of the immune system in PDAC control following Kras* targeting remain unknown 17,18. In addition to the ubiquitous Kras* driver mutation, genetic defects in TP53, CDKN2A, and genes implicated in the SMAD4/TGFβRII signaling pathway are frequently associated with accelerated tumor progression in PDAC 19–21. However, the role of these accompanying genetic defects in modulating the immune response in PDAC remains unknown.
Although the pancreatic tumor immune microenvironment (TIM) are characterized by relatively lower T cell infiltrates and T cell exclusion from the tumoral regions 22, spatial distribution analyses of T cells within human PDAC tumors has identified that the proximity of CD8+ cytotoxic lymphocytes (CTLs) to the tumor cells correlates with improved patient survival 2,22. Moreover, a subset of CD4+ T cells (TH2 cells) in PDACs were recently reported to produce cytokines that upregulated JAK1-STAT6-MYC signaling in cancer cells, driving anabolic growth of cancer cells via increased glycolysis 23. Further, studies on the role of MHC-unrestricted T cells in PDAC demonstrate that γδ T cells support pancreatic oncogenesis and tumor progression by restraining the adaptive αβ T cell response 24. While some studies support a tumor-promoting role of CD4+ and γδ T cells in PDAC 24–27, depletion of specific CD4+ and CD8+ T cell populations in an autochthonous Pdx1-Cre; LSL-KrasG12D; LSL-Trp53R172H/+ (KPC) mouse model had an insignificant impact on PDAC progression 8.
In this study, we probe the functional role of Kras* and other accompanying genetic defects in Trp53, Smad4, and Tgfbr2 in modulating the PDAC immune microenvironment. We generate autochthonous Kras* driven genetically engineered mouse models (GEMs) with Smad4, Tgfbr2, or Trp53 genetic alterations to evaluate the role of tumor suppressor gene defects in shaping the pancreatic TIM. We utilize GEMs with inducible Kras* on a conditional Trp53 or Tgfbr2 null background to identify the impact of suppressing Kras* on the pancreatic TIM. Our study identifies several key nodes of immune regulation in the TME by Kras*. Kras* mediated epigenetic regulation of Fas on cancer cells limits T cell activation and recruitment, which can be reversed upon suppression of Kras*. These new insights into the reprogramming of the pancreatic TIM and specific inhibitors of KrasG12D would potentially synergize with T cell targeted immunotherapies.
Results
Kras* elimination eradicates PDAC in adult PiKP and PiKT genetic mouse models
To determine the impact of Kras* on the pancreatic TIM, we employed GEMs in which Kras* expression can be turned ‘on’ and ‘off’ in a pancreas specific manner using a tetracycline-inducible Kras* genetic system 28. To appreciate the impact of tumor suppressor gene mutations/defects on the ability of Kras* to regulate the TIM, mice with inducible Kras* were generated with conditional Trp53 or Tgfbr2 null backgrounds. We generated PiKP (P48-Cre; R26-rtTa-IRES-EGFP; tetO-LSL-KrasG12D/+; Trp53L/L), PiKPF/+ (P48-Cre; R26-rtTa-IRES-EGFP; tetO-LSL-KrasG12D/+; Trp53L/+) and PiKT (P48-Cre; R26-rtTa-IRES-EGFP; tetO-LSL-KrasG12D/+; Tgfbr2L/L) mice and compared the immune infiltrates in Kras* driven PDAC tumors with that of tumors after Kras* elimination. In the PiKP, PiKPF/+ and PiKT GEMs, Kras* induction by continuous doxycycline (Dox) administration in the drinking water was initiated in adult mice (approximately 18 weeks of age, Figure S1A). Following Kras* induction, both PiKP and PiKT mice rapidly developed pancreatic tumors, with a median survival of approximately 25 weeks (7 weeks after the start of Dox, Figure S1A–B). As anticipated, hemizygous loss of Trp53 in PiKPF/+ mice resulted in slower tumor progression than the PiKP mice, with a median survival of approximately 36 weeks ((18 weeks after the start of Dox), Figure S1B).
In order to determine the impact of Kras* elimination on PDAC, we evaluated disease progression and overall survival in mice wherein Dox was administered (Dox+) to 18 weeks old PiKP, PiKPF/+ and PiKT mice (to activate Kras*) for 6 weeks, and subsequently withdrawn from Dox administration (Dox-) (Figure S1C). At start of Dox withdrawal, the mice presented with significant palpable tumors. Kras* elimination resulted in downregulation of the KrasG12D transcript and complete regression of established tumors with no histological evidence of tumor on follow up, resulting in long-term survival of PiKP and PiKT mice (Figure S1D–G). To define the temporal impact of Kras* elimination on PDAC, PiKP and PiKT mice were euthanized 5 days, 2 weeks, and 4 weeks following Dox withdrawal (Figure S1H). Histological analysis of the pancreas in mice on Dox demonstrated invasive PDAC (Figure S1I–J), as previously reported 28. Four weeks and 21 weeks after Kras* elimination, invasive PDAC was replaced by varying amounts of exocrine pancreatic tissue, PanINs and acinar-ductal metaplastic (ADM) lesions (assesed as described earlier 29,30), adipocytes, and fibrotic tissue (Figure S1I–K). Kras* elimination also resulted in decreased fibrosis (Figure S1J). Both PiKP and PiKT mice show a reduction in the total weights of pancreas following Kras* elimination (Figure S1L). Our results indicate that Kras* is required for initiation and maintenance of PDAC and Kras* elimination eradicates PDAC in PiKP and PiKT mice.
Kras* drives T cell paucity and myeloid infiltration in the PDAC microenvironment irrespective of other genetic mutations
To study the consequences of Kras* elimination on the TIM, we compared the immune infiltrates from Kras* driven tumors and following 5 days of Kras* elimination in PiKP and PiKT mice. Flow cytometry immunophenotyping analysis identified significant differences in immune cell composition, with an increase in the frequencies of CD3+ T cells, and a decrease in the frequencies of CD11b+ myeloid cells following Kras* elimination (Figure 1A–D). Subtyping analyses indicated a significant increase in the frequencies of CD8+ T cells, Tregs (CD4+ Foxp3+), and CD4+ Foxp3− T cells in PiKP and PiKT tumors following Kras* elimination (Figure 1A–D). Increased frequencies of T cells in the TME was accompanied by a concomitant decrease in tumor infiltrating myeloid cells, predominantly composed of CD11b+Ly6C−Ly6G− macrophages, CD11b+Ly6G+Ly6Clow/- (granulocytic myeloid derived suppressor cells; Gr-MDSCs), as well as CD11b+Ly6Glow/-Ly6C+ (monocytic myeloid suppressor cells; Mo-MDSCs) (Figure 1C–D). Further comparisons of immune infiltrates between PiKP and PiKT tumors identified no significant differences in the frequencies of T cells, CD11b+ myeloid cells, CD19+ B cells or NK cells either in Kras* driven tumors or in tumors following Kras* elimination (Figure S2A–B). Changes observed in the frequencies of T cells and myeloid cells in Kras* extinguished tumors compared to Kras* on tumors was not as consistent in the spleen of these mice despite changes in frequencies of the immune populations (Figure S2C), supporting that the impact of suppressing Kras* was mostly realized in the TIM and less so at the systemic level given the timeline studied. Quantitative immunolabeling analyses confirmed an influx of CD4+ T cells, CD8+ T cells, and a decrease in CD11b+ myeloid cells following Kras* elimination in the PiKP, PiKPF/+ and PiKT tumors (Figure 1E–F; Figure S2D–G). Further analysis of the CD4+ T cells demonstrated an influx of CD4+ Foxp3+ Tregs, CD4+ GATA3+ (TH2) cells, and CD4+ Rorγt+ (TH17) cells in addition to Tregs following Kras* elimination (Figure S2H–K). Analysis of liver and lung metastasis in the PiKPF/+ mice demonstrated significantly higher metastatic burden in the Kras* driven GEMs (Figure S2L–M) indicating that metastatic pancreatic cancer cells maintained Kras* dependency as Kras* inhibition reduced metastatic burden in these mice. Collectively, the results indicate that Kras* drives a T cell deficient and myeloid predominant PDAC TIM irrespective of tumor suppressor gene defects (Trp53 or Tgfbr2) (Figure 1G).
Figure 1. Kras* drives T cell suppression and myeloid infiltration in the PDAC TME irrespective of other genetic mutations.

(A) Timeline of the experiment. Kras* was induced in PiKP and PiKT mice at 18 weeks of age. After 6 weeks of induction, Kras* was turned off and tumors were analyzed at 5 days, 2 weeks and 4 weeks after removal of Dox. (B-D) Intra-tumoral immune composition of PiKP (Kras* On: n=11, Kras* 5d off: n=7) and PiKT (Kras* On: n=13, Kras* 5d off: n=5) tumors. (B) T cell populations determined as a percentage of CD45+ cells. T cells (CD45+ CD3+), CD4+ T cells (CD45+ CD3+ CD4+), CD8+ T cells (CD45+ CD3+ CD8+), CD4+ Foxp3+ cells and CD4+ Foxp3− cells of indicated groups. (C) Myeloid populations determined as a percentage of CD45+ cells. CD45+ CD11b+ (Myeloid cells), CD45+ CD11b+ Ly6C+ Ly6G− (Mo-MDSCs) and CD45+ CD11b+ Ly6G+ Ly6C− (Gr-MDSCs) of indicated groups. (D) Fold change of immune cells in Kras* 5d off PiKP and PiKT tumors, increase or decrease is indicated by arrows. (E-F) Representative images (E), and quantification (F) of CD4+ T cells (CD4), CD8+ T cells (CD8), and myeloid cells (CD11b+) by immunolabeling in Kras* On, Kras* off (5 days, 2 weeks and 4 weeks) and never on dox PiKP tumors (n = 2–6 per group). Scale bars, 100 μm; inset 50 μm. (G) Pie chart of intra-tumoral immune composition of PiKP (Kras* On: n=11, Kras* 5d off: n=7) and PiKT (Kras* On: n=13, Kras* 5d off: n=5) tumors as a percentage of CD45+ cells by flow cytometry. (H-I) Flow cytometry analysis of immune cells in PiKP tumors with Kras* On (n=6) and Kras* 5d off (n=6). Shown are percentages of TIM3+ T cells (H) and T-bet+ T cells (I). (J) qPCR analysis of Ifng expression on tumor infiltrating T cells (n=5 biological replicates). (K) Flow cytometry analysis of immune cells in PiKP tumors with Kras* On (n=6) and Kras* 5d off (n=6). Shown are percentages of CD40+ and CD86+ macrophages (CD11b+ F4/80+) and dendritic cells (CD11b− CD11c+DCs and CD11b+ CD11c+ DCs). In (B, C, F, H, I, J and K), data are presented as the mean ± SD, as mean values in (G) and as mean fold change in (D). In (B, C and D), significance was determined by unpaired T-test for comparison of PiKP (CD3+ T cells, CD8+ T cells, CD4+ T cells, CD4+ Foxp3− T cells, CD11b+ Ly6C− Ly6G+ cells, CD19+ B cells), and PiKT (CD3+ T cells, CD4+ T cells, CD8+ T cells, CD4+ Foxp3+ T cells, CD11b+ Ly6C− Ly6G+ cells) and by Mann-Whitney test for all other comparisons. Significance was determined by unpaired T-test (CD4+ T cells quantification) or Mann-Whitney test (CD8+ T cells quantification) or one-way ANOVA with Dunnett’s multiple comparisons test (CD11b+ cells quantification) for (F), by unpaired T-test in (H, I, J and K. * P<0.05, ** P<0.01, *** P<0.001, **** P<0.0001, ns: not significant. Note: CD11b+ F4/80+ and CD45+ Ly6G− Ly6C− cells have been used interchangeably to identify macrophages due to overlap of fluorophores conjugated to antibodies.
To probe the impact of accompanying genetic defects in P53, SMAD4, and TGFβRII signaling in the PDAC TIM of Kras* driven tumors, we generated P48-Cre; LSL-KrasG12D/+; Tgfbr2L/L (PKT) 31, P48-Cre; LSL-KrasG12D/+; SMAD4L/L (PKS) 20 and KPC mice. We compared the immune infiltrates in the stage matched PDAC (by histology and tumor weights) of KPC, PKT and PKS mice at the indicated age (Figure S3A–D). Flow cytometry analyses showed insignificant differences in the frequencies of CD3+ T cells, CD8+ T cells, CD4+ T cells, CD4+ Foxp3+ T regs, and CD11b+ myeloid cells between the KPC, PKT, and PKS tumors despite biological variability in the frequencies (Figure S3E–F). Quantitative immunolabelling also identified similar total numbers of tumor-infiltrating CD4+ T cells, CD8+ T cells, and CD11b+ myeloid cells between the three Kras* driven PDAC models (Figure S3G–H).
Kras* elimination recruits activated antigen presenting cells and effector T cells to the PDAC microenvironment
Kras* elimination resulted in an increased influx of a mixture of tumor restraining (CD8+ T cells) and tumor promoting (Tregs, TH2 and TH17 cells) T cells (Figure S2D–K). Further analysis of immune infiltrates following Kras* elimination indicated reduced frequencies of exhausted TIM3+ CD4+ T cells, accompanied by an increase in Tbet+ CD4+ (TH1) T cells and T-bet+ CD8+ T cells (Figure 1H–I). Expression of the immunostimulatory cytokine, interferon gamma (Ifng), was elevated in the tumor-infiltrating T cells (Figure 1J). PD-L1 expression was attenuated in CD11b+ myeloid cells, including CD11b+ Ly6C− Ly6G− and in CD11b+ Ly6Glow/-Ly6C+ (Mo-MDSC) cells, following Kras* elimination (Figure S3I). The rapid change in TIM following Kras* elimination (after 5 days) points to a possible impact of Kras* signaling on T cells, supporting its direct role in T cell-mediated anti-tumor response/s.
Analysis of putative antigen presenting cells (APCs) following Kras* elimination showed an increase in the frequencies of tumor-infiltrating CD86+ and CD40+ dendritic cells (CD11b− CD11c+ DC), as well as CD86+ and CD40+ CD11b+F4/80+ macrophages (Figure 1K). In contrast, CD40+ and CD86+ macrophage or dendritic cell populations were not altered in the spleen and lymph nodes of PiKP mice following Kras* elimination (Figure S3J–K). An increase in the frequencies of intra-tumoral MHCII+ macrophages, accompanied by an increase in MHCII signal intensity, was observed following Kras* elimination (Figure S3L). Although the frequencies of MHCII+ DCs remained unaltered, the MHCII signal intensity was significantly elevated in the tumor (Figure S3L), suggesting an increased capacity for antigen presentation, maturation, and activation upon Kras* elimination 32. In addition, the frequency of MHCII+ B cells increased in the tumors, spleens, and mesenteric lymph nodes upon Kras* elimination (Figure S3M), and MHCII intensities were also elevated (Figure S3N). These results suggest an increased potential of antigen presentation by B cells to TH cells 33,34. Our findings support that Kras* elimination promotes maturation, activation, and infiltration of antigen-presenting cells accompanied by an increase in effector CD4+ and CD8+ T cells. The increase in immunosuppressive CD4+ subsets (Tregs, TH2 and TH17 cells, Figure S2H–K) in the PDAC TIM upon Kras* elimination may reflect the launch of tissue regenerative programs to enable the emergence of normal parenchyma in the pancreas.
Kras* suppresses Fas expression on pancreatic cancer cells
To interrogate the mechanisms underlying the changes in the TIM due to Kras* elimination in cancer cells, we generated a primary cancer cell line (PiKP-785) from an advanced PiKP tumor (Figure 2A). The PiKP-785 cells demonstrated inducible Kras* expression in in-vitro culture and displayed slower growth kinetics in the absence of Kras* expression (Figure 2B, Figure S4A–B). Single cell RNA sequencing (scRNA seq) was performed on Kras* on and Kras* off PiKP-785 cells to identify Kras* mediated immune regulatory pathways in the cancer cells (Figure 2C–E). scRNA seq analyses confirmed the dynamic changes in the total Kras expression levels associated with Dox exposure in these cells (Figure 2D). Gene set enrichment analysis (GSEA) of Kras* on and Kras* 5d off cells identified enrichment of ‘apoptotic process’ and ‘programmed cell death’ related pathways following Kras* elimination (Figure S4C, Table S1A). Further analysis of immune related pathways identified pathways related to T cell proliferation, activation and immune response-activating signal transduction (Figure 2E, Table S1B). scRNA seq and qPCR microarray identified Fas death receptor amongst the top upregulated transcripts following Kras* elimination, and scRNA seq and real time qPCR analysis confirmed the increase in Fas expression following Kras* elimination (Figure 2F–H).
Figure 2. Kras* suppresses Fas expression on pancreatic cancer cells.

(A) Schematic representation of isolation of PiKP-785 cell line from advanced PiKP tumor. Cell lines were cultured in the presence (red, Kras* On) or absence of Dox (blue, Kras* off). (B) qPCR analysis of relative Kras* expression in PiKP-785 cells with Kras* on and Kras* 3 and 5 days off (n=3 biological replicates per group). (C) Seurat UMAP clustering of PiKP-785 cells in the presence or absence of Dox. (D) scRNA seq analysis of Kras expression level in PiKP Kras* On, 3d off, 5d off and On-off-on cells. (E) Pathway enrichment analysis of the differentially expressed genes by scRNA seq: Kras* 5d off vs. Kras* On PiKP-785 cells. Top 10 enriched immune related pathways were selected based on the FDR. (F) scRNA seq analysis of Fas expression level of PiKP-785 cells in the presence or absence of Dox. (G) Immune qPCR microarray was performed on PiKP-785 cells cultured with Kras* on and Kras* 3 and 5 days off (n=1 biological replicate per group). Heat maps depicts the fold change in gene expression 3d and 5d following Kras* elimination. The values indicate the relative fold change. (H) qPCR analysis of Fas expression in PiKP-785 cells with Kras* on and Kras* 3 and 5 days off (n=3 biological replicates per group). (I-J) Flow cytometry analysis of Fas surface expression on PiKP-785 cell line. Cells were cultured with Kras* on; Kras* off for 3 days, 5 days, 14 days, 3 weeks and 4 weeks, and Kras* off for 14 days and then Kras* on for 10 days (n=3 biological replicates per group). Histograms showing Fas expression (I) and percentage Fas+ cells calculated by overtone method (J). (K) Apoptosis in PiKP-785 cells with and without Kras* expression treated with anti-Fas agonist antibody (Jo2) (n=3 biological replicates per group). (L) Caspase 8 activity in PiKP-785 cells which were cultured with Kras* off for 5 days with Jo2 antibody treatment. Data are presented as the mean ± SD in (B, H, J, K and L) and as violin plots with normalized gene expression levels of indicated genes in (C and F). Significance was determined by one-way ANOVA with Dunnett’s multiple comparisons test (B, H and J), one way ANOVA with Sidak’s multiple comparisons test (K) and by unpaired T-test (L). ** P<0.01, *** P<0.001, **** P<0.0001, ns: not significant.
We hypothesized that Kras* elimination may promote apoptotic pathways triggered by binding of Fas ligand (FasL) to Fas on the cancer cells. Several immune cells including T cells, B cells, NK cells and macrophages have demonstrated FasL expression 35–39. Surface Fas protein expression on PiKP-785 PDAC cells following Kras* elimination increased over time, reached maximum levels at 2 weeks, and remained high even after 4 weeks, following Kras* elimination (Figure 2I–J). We next treated PiKP-785 cells with the Fas agonist antibody (Jo2), to mimic Fas-FasL binding 40. Kras* elimination alone enhanced apoptosis of PiKP-785 cells (Figure 2K). Jo2 antibody treatment of Kras* expressing PiKP-785 cells showed marginally increased apoptosis (Figure 2K). In contrast, a robust increase in apoptosis was observed in Kras* off PiKP-785 cells treated with Jo2 antibodies (Figure 2K). Correspondingly, Caspase 8 activity was elevated in Kras*-depleted cells upon Jo2 antibody treatment (Figure 2L). These results support that Kras* suppresses Fas expression to enable cancer cells’ escape from Fas-FasL mediated apoptosis.
Suppression of Fas on cancer cells reverses Kras* elimination mediated eradication of PDAC
To ascertain the functional relevance of Fas mediated apoptosis in-vivo following Kras* elimination, we suppressed Fas in PiKP cell lines (AK14837 and AK14838) with five different short hairpin RNA (shFas) and with a control scrambled short hairpin (shScr) (Figure 3A, Figure S5A). Both AK14837 and AK14838 cells with five different shFas clone heads displayed Dox inducible Kras* suppression (Figure S5B–C). In Kras* expressing cells (Kras* On), Fas transcript levels were low and not distinguishable from those in the parental and the shFas knockdown cell lines with Kras* on (Figure 3A, Figure S5A). Three days and five days following Kras* elimination, parental and scrambled shRNA (shScr) cell lines showed significant upregulation of Fas expression (mRNA and protein levels) compared to the shFas cell lines (Figure 3A–B, Figure S5A). We orthotopically implanted the PiKP parental AK14837, and AK14837 shScr and shFas cell lines in syngeneic recipients on Dox to induce Kras*. Two cohorts of mice in each group (Parental, shScr, and shFas) were monitored, one with Kras* expressed throughout the study, and the other with Kras* elimination after 10 days post orthotopic implantation of cancer cells (Figure 3C). MRI measurements and survival analysis demonstrated no difference in tumor growth between the Kras* On parental, shScr, and shFas orthotopic tumors (Figure 3D–F, Figure S5D–F). In the Kras* elimination group, mice bearing parental and shScr tumors regressed completely, whereas the shFas tumors demonstrated escape after elimination of Kras*, with the majority of mice (~80%) with a large tumor burden and rapidly succumbing to PDAC (Figure 3F–G, Figure S5F).
Figure 3. Suppression of Fas on cancer cells reverses Kras* elimination mediated eradication of PDAC.

(A) qPCR analysis of relative Fas expression (2-Δct) in AK14837 parental cells, sh-Scrambled (shScr) and shFas knockdown cells using different shRNAs (shFas#28, shFas#29, shFas#30, shFas#31, shFas#32) with Kras* on, Kras* 3d off and 5d off (n=3–6 biological replicates per group). (B) Western blot analysis of Fas expression level in parental cells, sh-Scrambled (shScr) and shFas#28 cells with Kras* on, Kras* 3d off and 5d off. (C) Timeline of the experiment for C57BL/6J mice orthotopically injected with syngeneic AK14837 cells (parental) and AK14837 Fas knockdown (sh-Fas#28) cell lines. Baseline MRI measurements were done on day 10 in mice prior to Dox withdrawal and subsequent MRI was done on day 20. (D) Baseline (day 10) (top panel) and post dox withdrawal (day 20) (bottom panel) MRI imaging of tumors of indicated groups. (E) Change in tumor volumes (based on MRI measurements) of parental, shScr and shFas#28 mice with Kras* On and Kras* On and off (n=4–5 mice/ group). (F) Kaplan-Meier survival curve of parental Kras* On (n=10), parental Kras* On and off (n=10), shScr Kras* On (n=10), shScr Kras* On and off (n=10), shFas#28 Kras* On (n=10), shFas#28 Kras* On and off (n=9). (G) Tumor/ pancreas weights of indicated groups at sacrifice or endpoint; Parental Kras* On (n=9), Parental Kras* On and off (n=10), shScr Kras* On (n=8), shScr Kras* On and off (n=8), shFas#28 Kras* On (n=9), shFas#28 Kras* On and off (n=9). (H-I) CD4 and CD8 immunolabeling (H), and quantification (I) of Kras* On and Kras* 5d off parental, shScr and shFas#28 tumors (n=3–6 tumors per group). Scale bars, 100 μm. In (A, E, G and I), data are presented as the mean ± SD. Significance was determined by Kruskal-Wallis (Dunn’s multiple comparisons) test (Kras* On comparisons of Parental, shScr and shFas cell lines) and one-way ANOVA with Dunnett’s multiple comparisons test (Kras* 3d off and Kras * 5d off comparisons of Parental, shScr and shFas cell lines) (A), one-way ANOVA with Sidak’s multiple comparisons test (E), Kruskal-Wallis (Dunn’s multiple comparisons) test (G). In (I), significance was determined by unpaired T-test for CD8+ T cells comparisons, and for CD4+ T cells comparison: parental and shFas#28 panels and by Mann-Whitney test for other panels. In (F), significance was determined by log-rank test. * P<0.05, ** P<0.01, *** P<0.001, **** P<0.0001, ns: not significant.
Analysis of T cell infiltration identified an increase in the number of intra-tumoral CD4+ and CD8+ T cells following Kras* elimination in the parental and shScr tumors, whereas the shFas tumors showed insignificant difference in the T cells infiltration following Kras* elimination (Figure 3H–I). Collectively, these experiments indicated that Fas is a critical mediator of tumor cell death upon Kras* elimination with significant survival benefit, and that its upregulation following Kras* elimination directly increased intra-tumoral T cell numbers.
Our cell culture data demonstrated a decrease in metabolic activity/proliferation of cancer cells following Kras* elimination (Figure S4A–B). However, Kras* elimination in combination with Jo2 antibody treatment (to mimics Fas-FasL interaction) resulted in robust increase in apoptosis of cancer cells (Figure 2K–L). In-vivo analysis of Kras* elimination in control and sh-Fas tumors demonstrated decrease in proliferation in both the tumor models, whereas cancer cells demonstrated apoptosis only in parental tumors (Figure S5G–H). Kras* elimination in sh-Fas tumors did not result in significant increase in apoptosis despite a decrease in proliferation (Figure S5G–H). Together, these data indicate that suppressed proliferation with minimal apoptosis in sh-Fas cancer cells upon Kras* elimination was sufficient induce a cytostatic response, but robust CD8+ T cell mediated eradication of tumors required Fas mediated apoptosis.
Next, we query if Il15, another cytokine upregulated following Kras* elimination in the qPCR microarray (Figure 2G) plays a functional role in the anti-tumor T cell response.Il15 is a potent T cell chemoattractant 41, which promotes the survival and proliferation of T, NK and B cells 42,43 among the top upregulated genes following Kras* elimination. IL-15 expression (Il15 mRNA) in PiKP-785 cells, its cell surface presentation, and the expression of the alpha subunit required for transportation of IL-15 to the cell surface 44,45 (Il15ra expression) were significantly increased upon Kras* elimination (Figure S5I–L). Analysis of T cells isolated from PiKP tumors demonstrated an upregulation of the β and γc complex, Il2rb following Kras* elimination (Figure S5M). Collectively, our data suggest that Kras* elimination participates in the regulation of immune mediated control of tumors, potentially via the upregulation of Fas and IL-15 on cancer cells. However, mice with or without αIL-15 antibody treatment showed similar tumor regression following Kras* elimination (Figure S5N–S). While IL-15 likely may play an important role in engaging productive anti-tumor immunity and immunological memory, in our experimental setting, it does not play a rate-limiting role in tumor regression following Kras* elimination.
CD8+ T cells functionally contribute to Fas mediated eradication of PDAC following Kras* elimination
Given the role of T cells in realizing Fas-mediated apoptosis signaling, we next ascertained whether CD4+ and CD8+ T cells are rate limiting in Fas–mediated apoptosis of PDAC following Kras* elimination. To assess the functional role of CD4+ or CD8+ T cells in tumor regression following Kras* elimination, we performed antibody mediated depletion of CD4+ or CD8+ T cells, respectively, in orthotopic PiKP mice (Figure 4A–C, Figure S6A–B). Analysis of tumor, spleen, and peripheral blood lymphocytes demonstrated depletion of CD4+ or CD8+ T cells with αCD4 or αCD8 antibody, respectively (Figure 4B–C, Figure S6A–B). Following Kras* elimination, the isotype and αCD4 treated orthotopic PiKP mice demonstrated complete tumor regression, whereas the αCD8 antibody treated mice demonstrated escape from regression and PDAC related mortality rates similar to those observed in mice with Kras* on (Figure 4D–G). Analysis of tumor/pancreas weight and PDAC histology at endpoint demonstrated increased tumor burden (Figure 4D) and invasive PDAC (Figure 4F–G) in αCD8 antibody treated mice following Kras* elimination when compared to isotype and αCD4 treated mice (Figure 4D–G). These result support a rate limiting role for CD8+ T cells in tumor regression following Kras* elimination.
Figure 4. Kras* elimination epigenetically upregulates Fas on cancer cells to facilitate CD8+ T cells mediated eradication of PDAC.

(A) Timeline of the experiment for C57BL/6J mice orthotopically injected with syngeneic PiKP (AK14837) cells. αCD4, αCD8 or isotype antibody treatment was initiated from day 8 in orthotopic PiKP tumor bearing mice with Kras* On and off. (B) Flow cytometry analysis of depletion of intratumoral CD4+ or CD8+ T cells (gated on CD45+ CD3+ CD11b− cells) by αCD4 or αCD8 respectively. (C) Intratumoral immune composition of orthotopic PiKP Iso (Kras* On), PiKP Iso (Kras* 5d off), PiKP αCD4 (Kras* 5d off), and PiKP αCD8 (Kras* 5d off) tumors (n=3 per group). (D-E) Tumor/ pancreas weights at sacrifice or endpoint (D) and Kaplan-Meier survival curve (E) of indicated groups. PiKP Iso (Kras* On; n=7), PiKP Iso (Kras* On and off; n=6), PiKP αCD4 (Kras* On and off; n=7) and PiKP αCD8 (Kras* On and off; n=7). (F) Histopathological analyses of H&E stained tumor/pancreas sections of mice in the indicated groups and time points. PiKP Iso (Kras* On; n=4), PiKP Iso (Kras* On and off; n=5), PiKP αCD4 (Kras* On and off; n=6) and PiKP αCD8 (Kras* On and off; n=4). Scale bars, 100 μm. (G) Quantification of relative percentage of tissue phenotype in indicated groups from (F). (H) tSNE plot demonstrating main cell types in murine PDAC tumors from Elyada et al., study 46 (left panel). Cell type labels were obtained from the original study. tSNE plot of T cells extracted from all cells (right panel). (I) Expression levels of Cd3d, Cd8a, Cd4 and Fasl in T cells are plotted onto the tSNE. (J) Violin plots showing distributions of Cd8a and Fasl in all 5 subclusters of T cells. (K) MeDIP analysis of Fas methylation in PiKP-785 cells with Kras* On, Kras* 3d off and 5d off (n=3 biological replicates per group). (L) Surface Fas expression evaluated by flow cytometry. PiKP-785 cells were cultured with Kras* on, Kras* off for 5 days, or Kras* off for 5 days and then on for 5 days. DNA methylation inhibitor 5-AZA (5-azacytidine) was added to cells during the 5-day culture (n=3 biological replicates per group). (M) scRNA seq analysis of Dnmt1 and S100z expression level in PiKP Kras* On, 3d off, 5d off and On-off-on cells. (N) ChIP assays demonstrating the relative binding of DNMT1, EZH2, H3K27me3 and H3K27ac on Fas promoter in Kras* On, 3d off and 5d off cells (n=3 biological replicates per group). (O) Summary of ChIP results. (P) Representative immunolabeling for co-localization analysis of tumor cells (CK19, green), Fas (red) and cleaved caspase 3 (CC3, yellow) on a PiKT tumor tissue. Co-localization of the three markers is indicated in magenta color. Scale bars, 100 μm. (Q) Quantification of Fas, CC3 and CK19 co-localization in PiKP and PiKT tumors with Kras* on (n=7) and Kras* 5d off (n=8). Data are presented as mean ± SD (C, D, G, K, L, N and Q) and as violin plots with normalized gene expression levels of indicated genes in (J and M). Significance was determined by one-way ANOVA with Dunnett’s multiple comparisons test (C, D, K and N), two-way ANOVA with Tukey’s multiple comparisons test (G), log rank test (E), by Mann-Whitney test (Q). In (L), Mann-Whitney test was used for ‘5d off’ comparisons and unpaired T-test for all other panels. * P<0.05, ** P<0.01, *** P<0.001, **** P<0.0001, ns: not significant.
To identify the specific T cell populations expressing FasL, we analyzed a scRNA-seq dataset of murine PDAC samples 46. tSNE analysis of single-cell sequencing data captured ductal epithelial cells, fibroblasts, myeloid cells, macrophages, neutrophils, endothelial cells, B cells, T cells, and NK cells in murine PDAC tumors (Figure 4H). Unsupervised clustering of the T cells identified 5 metaclusters (Figure 4H). Analyses of T cell specific transcripts, including Cd3d, Cd4, Cd8a and Fasl transcripts identified expression of Fasl predominantly in Cd8a expressing T cells and minimal co-expression in Cd4 expressing T cells (Figure 4I–J, Figure S6C–E).
Kras* epigenetically regulates Fas mediated apoptosis of pancreatic cancer cells
To identify the potential mechanism/s by which Kras* regulates Fas expression in PDAC, and informed by a RNAi screen that indicated multiple genes involved in Ras mediated epigenetic silencing of Fas in 3T3 cells 47, we explored whether Kras* epigenetically regulates Fas expression in PDAC, as also observed in earlier studies in non-small cell lung carcinoma models 48–50. We carried out methylated DNA immunoprecipitation (MeDIP) analysis of PiKP-785 cancer cells with Kras*-On, Kras*−3d off, and Kras*−5d off. MeDIP analysis showed a decrease in the methylation of the Fas promoter following Kras* elimination (Figure 4K). PiKP-785 cells with Kras* on and cultured in the presence of the DNA methyltransferase (DNMT) inhibitor 5-azacitidine (5-AZA) showed increased Fas expression (Figure 4L). Although Fas expression increased following Kras* elimination, Fas expression reached a saturation point and further addition of 5-AZA did not change Fas expression in Kras* extinguished PiKP-785 cells (Figure 4L). Further, re-expression of Kras*, 5 days after Kras* elimination, downregulated Fas expression and rendered the cells sensitive to 5-AZA (Figure 4L). The expression of Fas and Kras* inversely correlate in cancer cells (Figure 4L). Our results support that Kras* epigenetically suppresses Fas expression via hypermethylation of its promoter.
scRNA seq analysis identified that the DNA methyl transferase, Dnmt1, and S100z (involved in Ras mediated epigenetic silencing of Fas) were downregulated upon Kras* elimination (Figure 4M). Chromatin immunoprecipitation (ChIP) analysis identified that Kras* expression led to a significant enrichment of a DNA methyltransferase, DNMT1 and a histone methyltransferase EZH2 (the enzymatic component of polycomb-repressive complex (PRC2) that facilitates trimethylation of histone H3 at lysine 27 (H3K27me3) 51 on the Fas promoter region in PiKP-785 cancer cells (Figure 4N). Consistent with enrichment of EZH2 at the Fas promoter site, analysis of histone marks identified significant enrichment of trimethylation of histone H3 at lysine 27 at the promoter site in Kras* on cells (Figure 4N). Further, Kras* elimination resulted in enrichment of acetylation of histone H3 at lysine 27 (H3K27ac) at the Fas promoter region, indicating a transcriptionally active state (Figure 4N). Taken together, Kras* mediates the suppression of Fas via multiple epigenetic controls, including the methylation of the Fas promoter by DNMT1, and the trimethylation of histone H3 at lysine 27 (H3K27me3) catalyzed by EZH2 (Figure 4O).
We next evaluated Fas expression in-vivo by immunolabeling of Kras* driven PiKP tumors, and PiKP tumors 5 days following Kras* elimination. We co-stained the tissue simultaneously with cytokeratin 19 (CK19), cleaved caspase-3 (CC3), and Fas. Analysis of the immunostaining identified a significant increase in Fas+ CC3+ CK19+ cancer cells after 5 days of Kras* elimination compared to controls (Kras* on), indicating apoptotic death of Fas expressing cancer cells (Figure 4P–Q, Figure S6F). Taken together, these results show that Kras* suppressed Fas expression via DNA hypermethylation, and Fas expressed on the tumor cell surface induces apoptosis upon Kras* elimination.
KRAS expression inversely correlated with FAS and CD8+ T cell infiltration in human PDAC
In order to further validate the association between Kras and Fas in cancer cells and FasL on T cells, we examined the expression of KRAS (includes mutant and WT Kras transcripts), FAS, FASLG in treatment naïve human PDAC scRNA-seq dataset 52 (Figure 5A–E). tSNE analysis identified that the scRNA seq dataset captured pancreatic acinar cells, cancer cells (ductal cells type 1 and type 2), stellate cells, fibroblasts, endothelial cells, endocrine cells, and immune cells (macrophages, T and B cells) in human PDAC tumors (Figure 5A). CD8A expressing (CD8+) T cells were confirmed as the predominant cell population expressing FASLG, with minimal expression overlap between FASLG and CD4 (Figure 5A–C, Figure S7A–C). Analysis of FAS and KRAS in the cancer cell clusters demonstrated negligible overlap between FAS high and KRAS high cells (Figure 5D). KRAS high cells demonstrated significantly lower expression of FAS than KRAS low cells (Figure 5D–E).
Figure 5. KRAS expression inversely correlates with FAS and CD8+ T cell infiltration in human PDAC (A-E).

Single cell RNA seq analysis of human PDAC tumors from Peng et. al. Cell type labels were obtained from the original study. (A) tSNE plot denoting cell types in PDAC tumors (left panel). tSNE plot of T cells (right panel) and ductal cells type 1 and type 2 (bottom panel). (B) tSNE plots of CD3D, CD8A, CD4 and FASLG expression levels in T cells. (C) Violin plots showing distributions of CD8A and FASLG in all 13 subclusters of T cells. (D) tSNE plots of FAS and KRAS expression in cancer cell subclusters. (E) FAS expression level in KRAS low and KRAS high cancer cells. From (L). (F-H) CIBERSORTx analysis of bulk gene expression data of TCGA pancreatic adenocarcinoma (PAAD) from the UCSC Xena database (n=179). Median expression value of KRAS (F), and the proportion of indicated cell types in tumors (G). (H) Kaplan Meier survival curves of KRAS high and KRAS low tumors from (N). Data are presented as violin plots with normalized gene expression levels of indicated genes in (C) and as box and whisker plots in (E, F and G). Significance was determined by unpaired T-test in (F), Mann-Whitney test in (E and G), and by log rank test in (H). *P<0.05, ****P<0.0001, ns: not significant. Scale bars, 100 μm.
In addition, we analyzed bulk RNA seq of TCGA pancreatic adenocarcinoma (PAAD, n=179) 53 and CIBERSORT 54 was employed to estimate the proportions of immune cell types using built-in gene signatures of LM22 cell types with default parameters (Figure 5F–H). Tumor samples were split into two groups based on the median expression value of KRAS to compare the proportion of each immune cell type in KRAS high and KRAS low tumors (Figure 5F). The results indicated that low KRAS expressing PDAC tumors showed a higher proportion of CD8+ T cells and demonstrated longer survival compared to patients with high KRAS expression (Figure 5G–H). Collectively, these data support that increased KRAS expression is associated with reduced FAS and shorter survival in human PDAC.
Collectively, our data indicate that Kras* facilitates PDAC progression by epigenetic silencing of Fas and by driving T cell paucity in the PDAC TIM. Our current working model, supported by our immune profiling and functional studies, includes the facilitation of antigen presentation and T cell mediated anti–tumor response by Kras* silencing/targeting and synergistic Fas–mediated apoptosis of pancreatic cancer cells to control PDAC progression.
Discussion
Inducible iKras* GEMs, with either Trp53 or Tgfbr2 conditional null alleles, exhibited similar dependency on Kras* for survival and growth, as well as a similar TIM. These results suggest that differences in tumor suppressor gene mutations/defects may not significantly impact the composition of immune cells in the pancreatic TIM, but rather are largely driven by Kras*. Genetic elimination of Kras* resulted in an increase in CD4+ and CD8+ T cell infiltration, with concomitant decrease in myeloid infiltration and immunosuppressive checkpoint ligands. Elimination of Kras* also resulted in an increase in immunosuppressive Tregs, TH2 and TH17 cells in the pancreatic TIM, likely as a measure to prevent cytotoxic damage of normal pancreatic tissue.
Mutations in Kras associated with cancers other than PDAC, such as lung and colon cancer, also point to oncogenic Kras as a principle driver of immunosuppressive TME 12,55. In PDAC, Kras* is associated with inhibition of the expression of MHC-I 13, upregulation of IL2Rγ and IL4Rα on cancer cells which receive pro-tumorigenic growth signals from the TH2 cells 23 and mobilization of myeloid cells to the TME 9. While iCBT has been successful in patients with melanoma, PDAC remain largely refractory 5,6. Our data indicate that Kras* elimination reverses multiple nodes of immune evasion, including T cell paucity and exhaustion, loss of INF-γ response, accumulation of immunosuppressive myeloid cells, and lack of antigen presentation in PDAC. The recruitment of immunosuppressive Tregs upon Kras* elimination opens opportunities for anti-CTLA-4 iCBT 56. Our proof-of-concept study establishes that Kras* predominantly drives T cell paucity, myeloid infiltration, and therapeutic Kras* targeting could potentially render PDAC amenable to immunotherapy. In addition, our expression profiling data indicate that Kras* suppresses cancer cell intrinsic apoptotic pathways such as Fas dependent apoptosis 47,49. Our data provides direct in-vivo evidence that Fas upregulation following Kras* elimination is required for cancer cell apoptosis and PDAC regression. Kras* elimination facilitated anti-tumor response by augmenting the receptor-ligand interaction of Fas in the TIM. In lung cancer, oncogenic Kras was observed to epigenetically silence Fas through methylation of its promoter and repressor complex recruitment 48.
Our data indicate that Kras* upregulates transcriptional repressors such as DNMT1 at the Fas promoter, which facilitates its hypermethylation. In addition, Kras* recruits EZH2 to the Fas promoter site, which catalyzes enrichment of H3K27me3. Kras* elimination results in restoration of transcriptional activation of Fas by H3K27 acetylation and suppression of methyltransferases, DNMT1 and EZH2, at the promoter region. Further, our data establishes the functional role of CD8+ T cells in Fas–mediated eradication of PDAC following Kras* elimination. Our single cell analysis of murine and human PDAC demonstrates that FasL is predominantly expressed on CD8+ T cells and recognizes Fas expression on pancreatic cancer cells resulting in their Fas-FasL mediated apoptosis. FasL expression on CD8+ T cells provide a critical co-stimulatory signal for T cell expansion following Fas-FasL interaction 57. Therefore, the lack of Fas expression following Kras* elimination in the shFas tumors possibly results in T cell paucity and escape from Fas-FasL mediated apoptosis.
Our studies brings forward some key observations about the impact of Kras* inhibition on tumor growth and overall survival. Here, we show that in adult genetic models of PDAC with inducible Kras*, complete elimination of Kras in advanced tumors leads to eradication of PDAC with dramatic increase in overall survival of mice. Studies that observe relapse of PDAC following Kras* elimination and development of Kras* resistance/ relapse employ murine models that induce PDAC in immature pancreas (starting at 3w of age)10,28,58. Our cell culture studies coupled with in-vivo experiments demonstrate that Kras* inhibition leads to largely tumor stasis with inhibition of proliferation and a small degree of cell death, but complete and sustained elimination of cancer cells and tumors requires CD8+ T cells mediated apoptotic clearance to provide long term benefit. Such important role of immune cells in PDAC control following Kras* inhibition was also suggested recently 59. Without such elimination, resistance mechanism involving Kras* independent pathways can eventually take over and lead to therapy escape. More detailed studies are required to support this speculation. Of course, resistance observed when using real life pharmacological agents that target Kras* or it downstream pathways could be due to inefficient targeting and likely off-target effects.
Nevertheless, our study provides the proof-of-concept that in genetic model systems that allow for total suppression of Kras*, complete regression and eradication of PDAC can be observed. This is realized by Fas-mediated apoptosis of cancer cells and anti-tumor immunity that provides immunological memory and likely prevents relapse. Changes in the PDAC TIM induced by Kras* suppression also opens a window of opportunity to combine Kras* and T cell targeting/iCBT to facilitate PDAC control.
Limitations of study:
This study used genetic mouse models with capability to induce and eliminate Kras* in pancreatic epithelial cells with Ptf1α-Cre activity. This useful model allows tumor/tissue evaluation after complete elimination of Kras* in advanced PDAC. However, in clinical setting, the use of Kras* targeting drugs needs to account for inefficient targeting and development of resistance to Kras* inhibition.
STAR Methods
RESOURCE AVAILABILITY
Lead contact
Further information and requests for resources, reagents and samples should be directed to and will be fulfilled by the lead contact, Dr. Raghu Kalluri (rkalluri@mdanderson.org).
Materials availability
Materials and reagents used in this study are listed in the Key resources table.
KEY RESOURCES TABLE
| REAGENT or RESOURCE | SOURCE | IDENTIFIER |
|---|---|---|
| Antibodies | ||
| Anti-mouse CD45-Pacific Blue (Clone 30-F11) | Bio Legend | Cat# 103126, RRID: AB_493535 |
| Anti-mouse CD45-PE-Cy7 (Clone 30-F11) | BD Bioscience | Cat# 552848, RRID: AB_394489 |
| Anti-mouse CD3-PE-Cy7 (Clone 145-2C11) | eBioscience | Cat# 25-0031-82, RRID: AB_469572 |
| Anti-mouse CD3-Alexa700 (Clone 17A2) | eBioscience | Cat# 56-0032-82, RRID: AB_529507 |
| Anti-mouse CD4-BV605 (Clone RM4-5) | BioLegend | Cat# 100548, RRID: AB_2563054 |
| Anti-mouse CD8-BV650 (Clone 53-6.7) | BioLegend | Cat# 100742, RRID: AB_2563056 |
| Anti-mouse CD11b-BV711 (Clone M1/70) | BD Bioscience | Cat# 563168, RRID: AB_2716860 |
| Anti-mouse CD11b-BV786 (Clone M1/70) | BD Bioscience | Cat# 740861, RRID: AB_2740514 |
| Anti-mouse PD1 PerCP-Cy5.5 (Clone 29F.1A12) | BioLegend | Cat# 135208, RRID: AB_2159184 |
| Anti-mouse PDL1-APC (Clone F.9G2) | BioLegend | Cat# 124312, RRID: AB_10612741 |
| Anti-mouse PDL1- PE (Clone MIH5) | eBioscience | Cat# 12-5982-83, RRID: AB_466090 |
| Anti-mouse CD49b-PE (Clone Dx5) | eBioscience | Cat# 12-5971-81, RRID: AB_466072 |
| Anti-mouse NK1.1 (Clone PK136) | eBioscience | Cat# 12-5941-83, RRID: AB_466051 |
| Anti-mouse Ki67-Alexa 488 (Clone B56) | BD Bioscience | Cat# 558616, RRID: AB_647087 |
| Anti-mouse FoxP3 (Clone FJK-16s) | eBioscience | Cat# 56-5773-82, RRID: AB_1210557 |
| Anti-mouse F4/80-PE (Clone Cl:A3-1) | BioRad | Cat# MCA497PE, RRID: AB_322048 |
| Anti-mouse Ly6C-APC (Clone AL-21) | BD Bioscience | Cat# 560595, RRID: AB_1727554 |
| Anti-mouse Ly6G-PE-Cy7 (Clone 1A8) | BD Bioscience | Cat# 560601, RRID: AB_1727562 |
| Anti-mouse CD19-BV650 (Clone 6D5) | BioLegend | Cat# 115541, RRID: AB_11204087 |
| Anti-mouse CD19-PerCP-Cy5.5 (Clone 1D3) | BD Bioscience | Cat# 561113, RRID: AB_10563071 |
| Anti-mouse CD11c-eFluor615 (Clone N418) | eBioscience | Cat# 42-0114-82, RRID: AB_10853016 |
| Anti-mouse CD11c-PE-CF594 (Clone HL3) | BD Bioscience | Cat# 562454, RRID: AB_2737617 |
| Anti-mouse MHCII eFluor450 (Clone M5/114.15.2) | eBioscience | Cat# 48-5321-80, RRID: AB_1272241 |
| Anti-mouse MHCII-BV510 (Clone M5/114.15.2) | BioLegend | Cat# 107635, RRID: AB_2561397 |
| Anti-mouse CD40-BV650 (Clone 3/23 ) | BD Bioscience | Cat# 740492, RRID: AB_2740215 |
| Anti-mouse CD86-BV605 (Clone GL1) | BD Bioscience | Cat# 563055, RRID: AB_2737977 |
| Anti-mouse TIM3-PE/Dizzle (Clone B8.2C12) | BioLegend | Cat# 134013, RRID: AB_2632737 |
| Anti-mouse TIM3-BV711 (Clone RMT3-23) | eBioscience | Cat# 119727, RRID: AB_2716208 |
| Anti-mouse T-bet-PE-Cy7 (Clone eBio4B10) | eBioscience | Cat# 25-5825-80, RRID: AB_11041809 |
| In Vivo Ready Anti-Mouse CD16 / CD32 (2.4G2) antibody | Tonbo Biosciences | Cat# 40-0161, RRID: AB_2621443 |
| Rabbit monoclonal D4W2Z anti-CD8 antibody | Cell signaling technology | Cat# 98941s, RRID: AB_2756376 |
| Anti-CD4 antibody [EPR19514] | Abcam | Cat# ab183685, RRID: AB_2686917 |
| FOXP3 Monoclonal Antibody (NRRF-30) | ThermoFischer Scientific | Cat# 14-4771-80, RRID: AB_529583 |
| GATA-3 (D13C9) XP Rabbit mAb antibody | Cell signaling technology | Cat# 5852, RRID: AB_10835690 |
| Recombinant Anti-ROR gamma antibody [EPR20006] | Abcam | Cat# ab207082, RRID: AB_2889310 |
| Anti-CD11b antibody [EPR1344] | Abcam | Cat# ab133357, RRID: AB_2650514 |
| Rabbit Anti-CD95 Polyclonal Antibody, Unconjugated | Abcam | Cat# ab82419, RRID: AB_1658628 |
| Cleaved Caspase-3 (Asp175) (5A1E) Rabbit mAb antibody | Cell signaling technology | Cat# 9664, RRID: AB_2070042 |
| Cytokeratin 19 antibody [EP1580Y] | Abcam | Cat# ab52625, RRID: AB_2281020 |
| Ki67 antibody - Proliferation Marker | Abcam | Cat# ab15580, RRID: AB_443209 |
| IL-15 Polyclonal Antibody | Life Technologies | Cat# PA5-47014, RRID: AB_2608699 |
| Anti-mouse CD4 antibody | Bio X Cell | Cat# BE0003-1, RRID: AB_1107636 |
| InVivoPlus anti-mouse CD8α antibody | Bio X Cell | Cat# BE0004-1, RRID: AB_1107671 |
| Rat IgG2b Isotype control | Bio X Cell | Cat# BE0090, RRID: AB_1107780 |
| InVivoMAb anti-mouse IL-15 antibody | Bio X Cell | Cat# BE0315, RRID: AB_2754553 |
| InVivoPlus rat IgG2a isotype control antibody | Bio X Cell | Cat# BE0089, RRID: AB_1107769 |
| CD95 antibody | BD Bioscience | Cat# 554254, RRID: AB_395326 |
| Brilliant Violet 421™ Annexin V antibody | BioLegend | Cat# 640923, RRID: AB_2893503 |
| Histone H3 (acetyl K27) antibody - ChIP Grade | Abcam | Cat# ab4729, RRID: AB_2118291 |
| H3K27me3 antibody | Diagenode | Cat# C15410195, RRID: AB_2753161 |
| Dnmt1 Antibody | Novus | Cat# NB100-56519, RRID: AB_838131 |
| EZH2-human antibody | Cell Signaling Technology | Cat# 5246, RRID: AB_10694683 |
| Anti-Fas, clone 7C10 antibody | Millipore | Cat# 05-351, RRID: AB_2100499 |
| Vinculin antibody [EPR8185] | Abcam | Cat# ab129002, RRID: AB_11144129 |
| Donkey polyclonal Secondary Antibody to Rabbit IgG - H&L (HRP) | Abcam | Cat# ab16284, RRID: AB_955387 |
| Peroxidase-AffiniPure Goat Anti-Rat IgG (H+L) antibody | Jackson ImmunoResearch Labs | Cat# 112-035-003, RRID: AB_2338128 |
| Goat Anti-Rabbit IgG Antibody (H+L), Biotinylated | Vector Laboratories | Cat# BA-1000, RRID: AB_2313606 |
| Biotin-SP-AffiniPure F(ab’)2 Fragment Donkey Anti-Goat IgG (H+L) | Jackson ImmunoResearch Labs | Cat# 705-066-147, RRID: AB_2340398 |
| Chemicals, peptides and recombinant proteins | ||
| Liberase TL | Roche | Cat# 05401020001 |
| DNase I | Roche | Cat# 10104159001 |
| ACK Lysing Buffer | Quality Biological | Cat# 118-156-101 |
| Fixable Viability Dye eFluor780 | eBioscience | Cat# 65-0865-14 |
| Brilliant Stain Buffer | BD Bioscience | Cat# 566349 |
| Foxp3/Transcription Factor Staining Buffer Set | eBioscience | Cat# 00-5523-00 |
| Fixation/Permeabilization diluent | eBioscience | Cat# 00-5223 |
| Fixation buffer BD Cytofix | BD Bioscience | Cat# 554655 |
| Histopaque-1119 | Sigma | Cat# 11191 |
| TRIzol™ reagent | Invitrogen | Cat# 15596026 |
| Dispase II | Gibco | Cat# 17105041 |
| Collagenase IV | Gibco | Cat# 17104019 |
| Thiazolyl Blue Tetrazolium Bromide | Sigma-Aldrich | Cat# M2128-1G |
| 5-AZA | Sigma-Aldrich | Cat# A2385 |
| Cytofix/Cytoperm | BD Bioscience | Cat# 554722 |
| Polybrene | EMD Millipore | Cat# TR-1003-G |
| Puromycin | Fischer scientific | Cat# AAJ672368EQ |
| Laemmli Sample Buffer | Biorad | Cat# 1610747 |
| Pierce™ ECL Western Blotting Substrate | ThermoFischer Scientific | Cat# 32106 |
| Cycloheximide | Sigma | Cat# 01810-1G |
| Critical Commercial assays | ||
| Magnetic beads-based mouse Pan T cell Isolation Kit II | MACS Miltenyi | Cat# 130-095-130 |
| Direct-zol RNA MiniPrep Kit | Zymo Research | Cat# R2052 |
| High-Capacity cDNA Reverse Transcription Kit with RNase Inhibitor | Applied Biosystems | Cat# 4374966 |
| Methylamp Methylated DNA Capture Kit | Epigentek | Cat# P-1015-24 |
| Bicinchoninic Acid (BCA) assay (Pierce™ BCA Protein Assay Kit | Thermo Fischer | Cat# 23225 |
| Caspase-8 Colorimetric Assay Kit | BioVision | Cat# K113-25 |
| Deposited data | ||
| scRNA seq-data | This paper | GEO: GSE201887 |
| TCGA pancreatic adenocarcinoma (PAAD) RNA-seq data | UCSC Xena database | https://xena.ucsc.edu/ |
| Experimental models: Cell lines | ||
| PiKP-785 | This paper | NA |
| AK14837 | Chang et al. 66 | NA |
| AK14838 | Dey et al. 23 | NA |
| Experimental models: Organisms/strains | ||
| C57BL/6J | Jackson laboratories | RRID:IMSR_JAX:000664 |
| B6.FVB-Tg(Pdx1-cre)6Tuv/J | Hingorani et al. 21 | RRID:IMSR_JAX:014647 |
| B6.129S4-Krastm4Tyj/J | Hingorani et al. 21 | RRID:IMSR_JAX:008179 |
| B6.129P2-Trp53tm1Brn/J | Marino et al. 61 | RRID:IMSR JAX:008462 |
| tetO/CMV-LSL-KrasG12D/+ | Ying et al. 28 | NA |
| Ptf1atm1.1(cre)Cvw/Mmnc | Kawaguchi et al. 62 | RRID:MMRRC 000435-UNC |
| Tgfbr2tm1.2Hlm/Tgfbr2tm1.2Hlm | Chytil et al. 63 | RRID:MGI:5911077 |
| 129S-Trp53tm2Tyj/J | Olive et al. 65 | RRID:IMSR JAX:008652 |
| 129S-Smad4lox/lox | Bardeesy et al. 20 | NA |
| Oligonucleotides | ||
| qPCR Primers added to Table3 | ||
| sh-Fas#28: 5’-GTGTTCTCTTTGCCAGCAAAT-3’ | Millipore Sigma | TRCN0000012328 |
| sh-Fas#29: 5’-CCTCAAATCTTAGCTTGAGTA-3’ | Millipore Sigma | TRCN0000012329 |
| sh-Fas#30: 5’-GCTCACAGTTAAGAGTTCATA-3’ | Millipore Sigma | TRCN0000012330 |
| sh-Fas#31:5’-CCCGAGAATTGCTGAAGACAT-3’ | Millipore Sigma | TRCN0000012331 |
| sh-Fas#32: 5’-GCAGGAAACAAAGTCCCAGAA-3’ | Millipore Sigma | TRCN0000012332 |
| sh-Scr: 5’- GTCGGTATTCGTATCCTAACT-3’ | Millipore Sigma | Custom oligo |
| Fas primers for MeDIP analysis- F: 5’-GGCATTGGGTGCCACCGGTCC-3’ R: 5’-GGCACTAGAAAAGTGTCTGGGCAAGTC-3’ | Sigma-Aldrich | ENSMUSG00000024778, gene ID: 14102 |
| FAS TSS (Histone ChIP): 5’-CTGCCTCTGGTAAGCTTTGG, 3’-CAGCCACATCTGGAATCTCA | Sigma-Aldrich | qPCR primers |
| FAS promoter site (DNMT1, EZH2 ChIP): 5’-CCCTGTATTCCCATTCATCG and 3’-ACTAGGGGAGGGGACAGAAA | Sigma-Aldrich | qPCR primers |
| Software and algorithms | ||
| inForm Tissue Analysis Software (Version 2.1) | AKOYA biosciences | inform Tissue analysis |
| Seurat R package (version 3.2.1) | https://satijalab.org/seurat/ | |
| Flowjo v10.7.1 | Flowjo, L.L.C. | RRID: SCR_008520 |
| CIBERSORTx | http://cibersort.stanford.edu/ | |
| Graphpad Prism (Version 9.2.0) | GraphPad Software Inc. | RRID: SCR_002798 |
| ImageJ | Schneider et al. 67 | RRID:SCR_003070 |
| Others | ||
| shRNA lentiviral particles: sh-Fas, sh-Scr particles | Millipore Sigma | SHCLNV-NM_007987 |
Data and code availability
The accession numbers for the data reported in this paper have been deposited in GEO and are publicly available as of the date of publication. Accession numbers are listed in the Key resources table. The single-cell RNA sequencing analyses in this study were based on recently published datasets that are available as GEO: GSE129455 and GSA: CRA001160. The gene expression data of TCGA pancreatic adenocarcinoma (PAAD) was downloaded from the UCSC Xena database. The clinical survival data for these patients was obtained from the previous study 60. Source data are included in Data S1 and original western blot images are included in the supplementary material. Any additional information required to reanalyze the data reported in this paper is available from the lead contact upon request. This paper does not report original code.
EXPERIMENTAL MODEL AND STUDY PARTICIPANT DETAILS
Animal studies
The genotyping and tumor kinetics of the Ptf1αcre/+, tetO/CMV-LSL-KrasG12D/+, Trp53L/L, LSL-rtTA-EGFP (PiKP) model used in this study has been previously described 28,61,62. To generate Ptf1αcre/+, tetO/CMV-LSL-KrasG12D/+, Tgfbr2L/L, LSL-rtTA-EGFP (PiKT) model, Trp53L/L allele was bred out of the PiKP colony and replaced with Tgfbr2L/L 63. For Kras* induction, mice were fed Doxycycline (Dox) (Sigma-Aldrich, D9891) water (Dox 2g/L, sucrose 20 g/L) starting at 18 weeks of age. ‘Kras* On’ cohort of mice were maintained on Dox water until they were euthanized when mice reached moribundancy. Mice in the ‘Kras* On and off’ cohort were maintained on Dox until tumors had progressed to advanced stage (on average 6 weeks), following which mice were given regular water without Dox and euthanized at 5 days, 2 weeks, 4 weeks or ≥21 weeks after Dox withdrawal. For orthotopic experiments, syngeneic PiKP cells (1 × 10⁶ cells in 20 μL PBS) from AK14837 64, shFas#28, shScr cell lines were injected into the tail of the pancreas of 6 to 8 weeks-old C57BL/6J mice on Dox (West-Ward, NDC 0143–2122-50) under general anesthesia. ‘Kras* On’ mice were maintained on Dox until the mice reached endpoint, whereas another cohort of mice ‘Kras* On and off’ were administered regular water after 10 days. Tumor volumes were measured by serial MRI measurements using Bruker 7T MRI at the MDACC Small animal imaging core. Depletion of CD4+ and CD8+ T cells were performed starting from 8 days following orthotopic injection of PiKP cells by administration of intraperitoneal injections of 200 μg of anti-mouse CD4 (BioXcell, GK1.5, BE0003–1), 200 μg of anti-mouse CD8 (BioXcell, 53–6.7, BE0004–1) or isotype controls (Rat IgG2b, LTF-2, BE0090 and Rat IgG2a, 2A3, BE0089) twice per week in 100 μL of PBS for the entire course of the experiments. For neutralization experiments, mice were injected intraperitoneally every alternate day starting from 8 days (αCD4/αCD8) following orthotopic injection of PiKP cells in 100 μL of PBS for the entire course of the experiments. For IL-15 neutralization experiments, 50 μg of anti-IL15 antibody (BioXcell, AIO.3, BE0315) was injected intraperitoneally every alternate day starting from 10 days (αIL-15) following orthotopic injection of PiKP cells in 100 μL of PBS for the entire course of the experiments.
For analysis of immune infiltrates in Kras* driven tumors, we analyzed stage matched KPC (Pdx1cre/+, LSL- KrasG12D/+, LSL-Trp53R172H/+) 21,65, PKT (P48cre/+, LSL- KrasG12D/+, TgfbrL/L) 31 and PKS (P48cre/+, LSL- KrasG12D/+, Smad4L/L)mice) 20. The PiKP, PiKT, PiKPF/+, KPC, PKT and PKS mice were maintained on mixed backgrounds and started on treatments at indicated time points from birth. Investigators were blinded for histological assessment of tumor and pancreatic tissues with no randomization method used. Both male and female mice with the experimental genotypes were enrolled in all the treatment groups. The animals were before they reach moribund state. The mice were euthanized if a visible tumor burden reaches the maximum allowable size of 1.5cm in diameter (sum of diameters, visualized by imaging) or the total tumor burden is 10% of the body weight. All the mice were housed in the MD Anderson Cancer Center (MDACC) under modified barrier, in a 12 h light/dark cycle at 21°C with humidity at 40–60% and fed ad libitum (LabDiet, 5053). All animal procedures were approved by the MDACC Institutional Animal Care and Use Committee.
Cell lines
The PiKP-785 primary cell line was isolated by mincing fresh mouse tumor with sterile razor blades, digested using Dispase II (Gibco, 17105041, 4mg/mL) and Collagenase IV (Gibco, 17104019, 4mg/mL) in RPMI-1640 for 1 hour at 37°C, filtered by a 70 μm cell strainer and resuspended in RPMI-1640 (Corning 10–040-CV), 10% Tet System Approved FBS (Tet-free FBS) (Clontech 631106), and 1x penicillin-streptomycin (PS) (Corning, VWR 30–002-CI). Primary PiKP cell lines AK1483766, AK1483823, shFas and shScr cell lines generated from the parental lines were cultured in DMEM (Corning 10–017-CV), 10% Tet-free FBS, and 1x PS. Cells were cultured in medium with 1 μg/mL Dox (Sigma-Aldrich, D9891) to ensure oncogenic Kras expression (Kras* on) as described previously. To extinguish oncogenic Kras, Dox was withdrawn from the media (Kras* off). The cell lines were tested for mycoplasma and confirmed to be negative prior to start of in-vivo and in-vitro experiments.
METHOD DETAILS
Tissue processing
Blood was collected via retro-orbital vein and transferred into EDTA-tubes (BD 365974). Tumor, healthy pancreas, spleen, and mesenteric lymph node were collected and placed into RPMI (Corning™, 10041CM) with 10% fetal bovine serum (FBS) on ice. The tumor was divided in three parts: one part of tumor was snap-frozen in liquid nitrogen, one part was formalin-fixed for histological analysis, and one part was processed for immunotyping or T cell isolation.
Immunotyping
Single cell suspensions were prepared from tumor, spleen, and lymph node. Tumors were minced and digested in 5 to 10 mL of 0.1 mg/mL Liberase TL (Roche, 05401020001) and 0.2 mg/mL DNase I (Roche, 10104159001) in RPMI-1640 for 30 min at 37°C with gentle mixing. The digestion was stopped with equal volume of stop mixture (RPMI-1640, 10% fetal bovine serum (FBS), 10 mM EDTA). Cells were filtered through 100 μm cell strainer (Corning 352350), washed 3 times with FACS buffer (PBS, 2% FBS). Spleens and lymph nodes were mashed through 100 μm cell strainer and washed once with FACS buffer. ACK Lysing Buffer (Quality Biological, 118–156-101) was added to collected blood to lyse red blood cells. After a 5 min incubation at room temperature (RT), the cell pellet was washed twice with PBS. Cells were stained with 100 μL surface antibody cocktail [with 50 μg/mL anti-mouse CD16/CD32 (2.4G2) block (TONBO biosciences, 40–0161), Fixable Viability Dye eFluor780 (eBioscience, 65–0865-14) diluted in FACS buffer, 20% Brilliant Stain Buffer (BD Bioscience, 566349)] for 30 min on ice. Cells were washed twice with FACS buffer, fixed-permeabilized with Foxp3/Transcription Factor Staining Buffer Set (eBioscience, 00–5523-00) and stained for 30 min with intracellular antibody cocktail diluted in Fixation/Permeabilization diluent (eBioscience, 00–5223) on ice. The cells were washed twice with Fixation/Permeabilization diluent, fixed in Fixation buffer (BD Bioscience 554655), and washed with FACS buffer. Antibodies used in surface and intracellular staining cocktails are described in Key resources table. Data were acquired on Fortessa-X20 (BD Bioscience) and analyzed with FlowJo V10. Immune populations were gated on single live CD45+ cells. Markers used to determine different immune populations and gating strategy are illustrated in Figure S8a and Table 1.
Table 1.
Phenotyping of cells in flow cytometry analysis. Related to STAR methods.
| Cell | Phenotype |
|---|---|
| T cells | Live/CD45+/CD3+ |
| CD4+ T cell | Live/CD45+/CD3+/CD4+ |
| CD8+ T cell | Live/CD45+/CD3+/CD8+ |
| Treg | Live/CD45+/CD3+/CD4+/FoxP3+ |
| Myeloid cells | Live/CD45+/CD11b+ |
| Mo-MDSC | Live/CD45+/CD11b+/Ly6C+/ Ly6Glow/- |
| Gr-MDSC | Live/CD45+/CD11b+/Ly6G+/Ly6Clow/- |
| Macrophages | Live/CD45+/CD11b+/Ly6C−Ly6G− or Live/CD45+/CD11b+/F4/80+ |
| B cells | Live/CD45+/CD19+ |
| NK cells | Live/CD45+/CD3−/NK1.1+ or Live/CD45+/CD3−/CD49b+ |
Quantitative real-time PCR (qPCR) analyses
For cell culture, TRIzol™ reagent (Invitrogen, 15596026) was directly added to cell culture dish after culture medium removal and RNA was extracted using Direct-zol RNA MiniPrep Kit (Zymo Research, R2052) according to the manufacturer’s recommendations with on-column DNase I treatment. For mouse tumors, ≤ 25 mg of tumor was transferred into a 2-mL tube with 0.5 mL TRIzol™ reagent and homogenized with handheld tissue homogenizer, subsequently centrifuged at 12,000g for 15 min at 4°C. RNA isolation was performed in the supernatant using the RNA MiniPrep Kit. 500 to 1000 ng of the RNA was used for cDNA synthesis using High-Capacity cDNA Reverse Transcription Kit with RNase Inhibitor (Applied Biosystems, #4374966). qPCR was run with Fast SYBR Green Master Mix (Applied Biosystems #4385612) using the QuantStudio 7 Flex Real-Time PCR System (Applied Biosystems). Primer sets are listed in Key resources table. Measurements were standardized to expression of the housekeeping genes (18s or Gapdh). Fold change in gene expression was determined using the 2-ΔΔCt method, and the fold change of the control group was arbitrarily set to 1. Statistical analyses were computed on biological replicates values of ΔCt.
For the TaqMan™ qPCR array, total RNA was extracted from PiKP-785 cells with Kras* On, Kras* 3d off and Kras* 5d off using TRIzol™ (Invitrogen, 15596026). TaqMan™ Array Mouse Immune Panel (Applied Biosystems, Catalogue # 4367786) qPCR array was performed on one biological replicate from each group according to the manufacturer’s instructions. 18s expression was used as the internal control for analysis. Fold change in gene expression was determined in PiKP-785 cells with Kras* 3d off and Kras* 5d off relative to gene expression in cells with Kras* On using the 2-ΔΔCt method.
Immunostaining
Immunofluorescence staining was performed using Tyramide Signal Amplification (TSA) technology as described previously 2. In short, 5 μm-thick formalin fixed paraffin embedded (FFPE) sections were deparaffinized and fixed in formaldehyde: methanol (1: 10). Antigen retrieval was performed in Tris-EDTA (TE) buffer (pH 9.0) at 95°C for 15 min, following which the slides were blocked in 4% cold water fish gelatin (CWFG) (Sigma-Aldrich, GL7765) for 10 min, stained with primary antibody (1h at RT) and secondary antibody (10 min at RT), followed by incubation with TSA fluorophore (10 min at RT). The reagents are listed in Table 2. In between steps, tissues were washed with Tris buffered saline with 0.1% Tween-20 (TBST) 3 times x 2 min each wash. All buffers and dilutions were prepared with TBST. Subsequently, another round of antigen retrieval is performed before staining for the next antibody ensues. After the last round of antigen retrieval and antibody staining, slides were cover slipped with mounting media containing DAPI (Fluoroshield™ with DAPI – Sigma Aldrich F6057). The phenotyping of cells for CD4, CD8 and Foxp3 staining in PiKP and PiKT tumors were performed as described in Table S2. Multiple representative images (at 20X magnification) were obtained from the tumor containing areas in the PiKP (Kras* On, Kras* 5d off, Kras* 2w off and Kras* 4w off) and PiKT mice (Kras* On, Kras* 2w off and Kras*4w off). Uninvolved pancreatic tissue, associated adipose tissue, and intra-tumoral lymphoid follicles (ITLF) were not included in the analyses. The number of Fas+, CK19+, CD4+, CD8+, CD11b+, CD4+ Foxp3+ and CD4+ Foxp3− per 20x field were counted and the mean number of each cell type was tabulated. The average numbers of each of these cell types were compared between groups.
Table 2.
T cell panel immunofluorescence staining. Related toSTAR methods.
| Antigen | Primary antibody | Secondary antibody | TSA fluorophore | |||
|---|---|---|---|---|---|---|
| Vendor | Catalog # | Dilution | Vendor | Polymer | ||
| CD8 | Cell signaling technology | 98941s | 1:250 | BioCare | Rabbit-on-Rodent HRP | Opal 650 |
| CD4 | Abcam | Ab183685 | 1:400 | BioCare | Rabbit-on-Rodent HRP | Opal 520 |
| Foxp3 | ThermoFischer Scientific | 14-4771-80 | 1:50 | BioCare | Rat HRP | Opal 650 |
| GATA3 | Cell signaling technology | 5852S | 1:1500 | BioCare | Rabbit-on-Rodent HRP | Opal 650 |
| Rorγt | Abcam | Ab207082 | 1:1000 | BioCare | Rabbit-on-Rodent HRP | Opal 650 |
| CD11b | Abcam | Ab133357 | 1:500 | BioCare | Rabbit-on-Rodent HRP | Opal 650 |
| Fas | Abcam | Ab82419 | 1:100 | BioCare | Rabbit-on-Rodent HRP | Opal 570 |
| Cleaved Caspase 3 | Cell signaling technology | 9664S | 1:1000 | BioCare | Rabbit-on-Rodent HRP | Opal 520, Opal 690 |
| CK19 | Abcam | Ab52625 | 1:1000 | BioCare | Rabbit-on-Rodent HRP | Opal 650, Opal 520 |
| Ki-67 | Abcam | Ab15580 | 1:250 | BioCare | Rabbit-on-Rodent HRP | Opal 690 |
The analysis for Fas, CC3 and CK19 staining was performed as previously described 2. Multicolor TSA slides were imaged using Vectra multispectral imaging version 2 (Perkin Elmer). A spectral library was generated using Nuance Image analysis software (Perkin Elmer). Subsequently, spectral unmixing was performed using Inform software (Version 2.1, AKOYA biosciences) allowing for fluorophore-based identification of individual markers. For the analysis, co-localization function was chosen. Pixel intensity was computed for three overlapping colors that were co-localized: CK19, CC3, and Fas. The following images were excluded in Inform merge: intra-tumoral lymphoid follicles, uninvolved pancreas with no or little CK19 signal (ADM regions), and adipose tissue. Text files were generated by Inform for each slide, then combined in one file using R-code. Excel pivot table was used to calculate total pixel count for each mouse. For CD4, CD8 and Ki-67 immunostaining, slides were processed similar to the staining procedure described above and incubated with CD4 (Abcam, Ab183685, 1:400), CD8 (CST, 98941s, 1:250), Ki-67 (Abcam, ab15580, 1:250) for 1h at RT, followed by secondary antibody (Biotinylated rabbit IgG (H+L), Vector Laboratories BA-1000, 1:250) for 30 minutes at RT and ABC reagent (Vectastain ABC kit, PK-6100) for 30 minutes at RT. Subsequently, the sections were developed by DAB and counterstained with hematoxylin. For IL-15 immunostaining, slides with FFPE tissue were processed similar to the staining procedure described above and incubated with αIL-15 (Life Technologies, PA5–47014) primary antibody at a concentration of 1:100 for 1h at RT, followed by secondary antibody (Donkey anti-goat biotin, 1:250, 705–066-147) for 30 minutes at RT and ABC reagent (Vectastain ABC kit, PK-6100) for 30 minutes at RT. Subsequently, the sections were developed by DAB and counterstained with hematoxylin. For quantification of IL-15 immunostaining, multiple random images (at 20x magnification) were selected for scoring using bright-field microscope and number of pixels positive for the antibody were computed using Image J67. The average number of pixels positive for IL-15 were compared between groups. All source data for the quantification of aforementioned staining and other experiments in this study are provided in Data S1.
MTT assay
2 × 10³ PiKP-785 cells were plated per well in 96-well plates in 10% Tet-free FBS-RPMI, PS with or without Dox. Cells were cultured for 5 days and assessed by MTT assay at multiple time points starting from the day of plating (day 0) using Thiazolyl Blue Tetrazolium Bromide (MTT, Sigma-Aldrich, M2128–1G), flowing the manufacturer’s recommendations. The absorbance at 540 nm was detected on FLUO star Omega plate reader (BMG Labtech). Assay was performed using three to four biological replicates.
Protein surface expression on cell line
PiKP-785 cells were cultured in the presence or absence of doxycycline for 3 days, 5 days, 14 days or 4 weeks. Subsequently, the cells were washed in FACS buffer and stained for 20 min on ice with corresponding surface marker antibody or isotype control diluted in FACS buffer (Key resources table) and Viability Dye eFluor780. For intracellular staining, cells were permeabilized with Cytofix/Cytoperm (BD Bioscience, 554722) and stained in Perm/Wash buffer (BD Bioscience, 554723). The cells were analyzed by flow cytometry on FortessaX-20 (BD Bioscience). Percentage of positive cells was quantified by Overtone method in FlowJo v10.1. For Fas surface expression in the presence of DNA methylation inhibition, cells were incubated with 5 μM 5-azacytidine (5-AZA, Sigma A2385) in 10% Tet-free FBS RPMI and PS for 5 days, and Fas expression was analyzed as described above.
Apoptosis analysis
PiKP-785 cells were cultured in the presence or absence of 1 μg/mL doxycycline for 5 days. Subsequently, anti-Fas antibody (BD554254, Clone Jo2, 0.5 μg/mL final concentration) was added to the cells to 0.5 μg/mL final concentration and untreated cells (no anti-Fas antibody) were used as controls. Apoptosis was detected 48 h after antibody treatment. Cells collected were washed in Annexin V Binding Buffer (BD Bioscience, 51–66-121E) and stained for 10 min at RT with 100 μL Annexin V-BV421 (1:20, Biolegend, 640924) and Fixable Viability Dye eFluor780 (1:1000) diluted in Annexin V Binding Buffer (BD Pharmingen, 556454). 100 μL of Annexin V Binding Buffer was added and the cells were analyzed on Fortessa X-20 (BD Biosciences). Percentage of Annexin V+ cells out of total cells was quantified in FlowJo v10.1.
Single cell RNA-seq analysis
3’ scRNA seq gene expression profiling (10x Genomics) on PiKP-785 cells with Kras* On, Kras* 3d off, Kras* 5d off and Kras* On off on was conducted at the Advanced Technology Genomics Core, MDACC. Single cell Gel Bead-In-Emulsions generation and barcoding, post GEM-RT clean-up and cDNA amplification, library construction and Illumina-ready sequencing library generation were prepared by following the manufacturer’s guidelines. cDNA concentration was estimated using High Sensitivity dsDNA Qubit kit and quantified using HS DNA Bioanalyzer. Following capture and lysis, cDNA was synthesized and amplified to construct Illumina sequencing libraries and sequenced with Illumina NextSeq 500. We performed scRNA seq analysis using Seurat (version 3.2.1)68 to process the expression matrices and perform downstream analysis. Multiple functions implemented in Seurat were used. To avoid the analysis driven by noise and low-quality cells, we discarded the cells with a limited number of genes. We used quantile function from R (version 4.0.0) to determine the range of genes to filter low-quality cells. The quantile range of genes was set from 2.5% to 97.5% and we discarded the cells with genes over 97.5% and less than 2.5%. Cells with more than 10% of mitochondrial counts were also filtered for downstream analysis. “Sctransform” function was used to normalize and stabilize the variance of expression matrices. The expression matrices were dimension reduced with principal component analysis (PCA). ‘FindNeighbors’ was used to define the nearest neighbours among cells in the PCA space, top 17 principal components were selected according to the ‘JackStrawPlot’ and ‘ElbowPlot’ functions, and then ‘FindClusters’ was used to group cells with the Louvain algorithm based on the resolution of 0.5. ‘RunUMAP’ function was used for visualizing the UMAP dimension reduction clusters. ‘DoHeatmap’ function was employed to display the top 10 genes for each meta cluster. ‘VinPlot’ function was used to show the expression probability distribution of genes across the defined cell clusters.
We examined the expression of KRAS, FAS and FASLG for all of the scRNA-seq datasets in the TISCH database 69, and found one PDAC dataset 52 with its expression. Then we downloaded the normalized scRNA-seq data and meta information for this study from the TISCH database 69. We processed the scRNA-seq data using the same processes and functions in Seurat (version 3.2.1) as described in this section earlier and labelled the cell clusters using the meta-information from the original study. We used Markov Affinity-based Graph Imputation of Cells (MAGIC) 70 to recover the missing gene expressions for the scRNA-seq dataset. For the mouse scRNA-seq data, we downloaded raw FASTQ sequencing files from the Sequence Read Archive (SRA) database as mentioned in the original publication 46. We employed 10x Genomics Cell Ranger 3.0.1 to perform the alignment, filtering, barcode counting and UMI counting for the raw FASTQ files using the mus musculus reference genome (mm10). We then used the R package Seurat (version 3.2.1) and embedded functions as described in the earlier section to analyze the matrices generated from Cell Ranger. We used the same markers as mentioned in the original publication to annotate the unsupervised clusters. To recover the missing gene expressions of the scRNA-seq, we used Adaptively thresholder Low-Rank Approximation (ALRA) 71 to impute the values with the default parameters for the T cell populations.
Chromatin immunoprecipitation
For ChIP experiments, 5 × 10⁶ cells per immunoprecipitation from Kras* On, 3d off and 5d off PiKP-785 cells were trypsinized and cross-linked by gently shaking cells suspended in 1% methanol free formaldehyde (ThermoFischer, Cat# 28908) in tissue culture medium at room temperature for 12 minutes. Subsequently, 125 mM glycine was added to this mix for 5 minutes at room temperature. The cells were centrifuged at 2000 rpm for 5 minutes at 4°C and cells were washed twice with ice cold PBS (with 1mM PMSF). The cell pellets were snap frozen in liquid nitrogen and stored at −80°C. ChIP assays were performed at the MD Anderson Epigenomics Profiling Core with some modifications to previously described high-throughput ChIP protocol 72. Briefly, nuclei were isolated in cell lysis buffer (5 mM PIPES pH 8.0, 85 mM KCl, 0.5 % NP-40 supplemented with protease inhibitors) and lysed in lysis buffer (12 mM Tris-HCl pH 7.5, 6 mM EDTA pH 8.0, 0.5 % SDS supplemented with protease inhibitors) followed by sonication with a Bioruptor (Diagenode) to obtain DNA fragments ranging 200–600 bp. The resulting chromatin was incubated overnight at 4°C with histone modification antibodies (H3K27ac, Abcam – Cat# ab4729; H3K27me3, Diagenode – Cat# C15410195 and H3, Abcam – Cat# ab1791) preconjugated with Dynabeads Protein G. ChIPs with non-histone antibodies (DNMT1, Novus Biologicals, Cat# NB100–56519 and EZH2, Cell Signaling Technology, Cat# 5246S) were performed using the iDeal ChIP kit (Diagenode) with modifications to manufacturer instructions. The immunocomplexes were collected following day using Dynamag, washed, treated with RNase and Proteinase K, and reverse crosslinked overnight followed by DNA extraction. The DNA region of interest was detected by SYBR real-time quantitative PCR using following oligonucleotides at FAS transcription start site for histone enrichment (Key resources table), and at FAS promoter for DNMT1 and EZH2 enrichment (Key resources table). The statistical analyses were performed on transcript level normalized to IgG (for DNMT1 and EZH2 ChIPs) and on transcript level normalized to histone H3 (for H3K27me3 and H3K27ac ChIPs).
MeDIP assay
Methylated DNA was isolated using Methylamp Methylated DNA Capture Kit (Epigentek, Farmingdale, USA). 1.0 μg of sonicated DNA was added to each antibody coated well and incubated for 120 min at RT on an orbital shaker. After releasing with proteinase K for 60 min at 65°C, DNA was eluted from the column and adjusted to a final volume of 100 μL with nuclease-free water. For each sample, 5 μL of the total sonicated DNA was used as loading control and the rest of the sample went through precipitation. For SYBR-based real-time PCR, 5 μL of eluted DNA was added to the reaction mixture containing the primer pair (200 nmol/l each) and diluted 2x Fast SYBR Green Master Mix (Applied Biosystems, Carlsbad, USA) in a final volume of 20 μl for each PCR reaction. The real-time PCR reactions were performed in a 96-well reaction plate using the StepOne Real-Time System (Applied Biosystems, Carlsbad, USA) and were done in triplicates. An initiation step at 95 °C for 20 seconds was followed by 40 cycles at 95 °C for 3 seconds and 64 °C for 30 seconds. Primer sequences: mouse Fas (ENSMUSG00000024778, gene ID: 14102) (Key resources table).
shRNA knockdown experiments
To determine to role of Fas mediated cell death following Kras* elimination, we screened 5 short hairpin RNA clone heads targeting Fas. The shRNA oligosequences (target sequences in Key resource table) were as follows : TRCN0000012328 (sh-Fas#28), TRCN0000012329 (sh-Fas#29), TRCN0000012330 (sh-Fas#30), TRCN0000012331 (sh-Fas#31) and TRCN0000012332 (sh-Fas#32). The scrambled control (sh-Scr target in Key resource table) was prepared by scrambling sh-Fas#28 target sequence in the same pLKO.1 backbone. The shRNA lentiviral particles (SHCLNV-NM_007987) were added to cell culture medium (10% Tet-free FBS DMEM with PS) with 4 μg/mL polybrene (EMD Millipore, TR-1003-G) for transduction of AK14837 and AK14838 cells. 24h following infection with the lentiviral particles, 10 μg/mL puromycin (Fischer scientific, AAJ672368EQ) was used for selection of cells containing the shRNA and tested for knockdown of Fas and KrasG12D by qPCR.
Western blot
To analyze protein expression in PiKP cell lines, cell lysates were prepared in RIPA lysis buffer and protein levels were normalized using Bicinchoninic Acid (BCA) assay (Pierce™ BCA Protein Assay Kit, Thermo Fischer, Cat# 23225). 40 μg of protein lysates per sample were diluted with Laemmli Sample Buffer (Biorad, Cat#1610747) and RIPA in a final volume of 25 μL and incubated at 95°C for 5 min. Subsequently, the protein lysates were loaded into Bolt™ 4–12% Bis-Tris Plus gel (Thermo Fischer, Cat# NW04120BOX) for electrophoretic separation and transferred onto nitrocellulose membranes (Amersham™, Protran™, Cat#10600007). The membranes were incubated in blocking buffer (5% nonfat milk in TBST), and incubated overnight at 4°C in the primary antibodies: Fas (EMD Millipore, Clone 7c10, Cat# 05–351; 1:500) and Vinculin (Abcam, Cat# 129002, 1:10,000). Membranes were incubated in secondary antibodies (Donkey Anti-rabbit IgG H&L, Abcam, ab16284, 1:10,000 (for Vinculin primary) and Peroxidase AffiniPure Goat Anti-Rat IgG (H+L), Jackson Immunoresearch labs, Cat# 112–035-003, 1:10,000 (for Fas primary)) for 1 h at RT. Membranes were developed with chemiluminescence reagents (Pierce™ ECL Western Blotting Substrate, Cat# 32106) as per manufacturer’s recommendation. Uncropped western blot images from Figure 3B are included in the supplementary material.
Tissue processing
Blood was collected via retro-orbital vein and transferred into EDTA-tubes (BD 365974). Tumor, healthy pancreas, spleen, and mesenteric lymph node were collected and placed into RPMI (Corning™, 10041CM) with 10% fetal bovine serum (FBS) on ice. The tumor was divided in three parts: one part of tumor was snap-frozen in liquid nitrogen, one part was formalin-fixed for histological analysis, and one part was processed for immunotyping or T cell isolation.
T cell isolation from PDAC mouse tumors
Single cell suspensions were prepared as described for immunotyping above. Dead cells were removed by gradient centrifugation on Histopaque-1119 (Sigma, 11191). Cells were washed with PBS and FACS buffer. T cells were isolated by negative selection using magnetic beads-based mouse Pan T cell Isolation Kit II (MACS Miltenyi, 130–095-130) according to the manufacturer’s recommendations. T cells were used for flow cytometry analysis as described for immunotyping and for RNA isolation.
Activated Caspase-8 Colorimetric Assay
PiKP-785 cells were cultured in the absence of doxycycline for 5 days. Then anti-Fas antibody (BD554254, Clone Jo2, 0.5 μg/mL final concentration) and cycloheximide (CHX, Sigma 01810–1G, 2.5 μg/mL) were added. After 24 h, activated caspase levels were assessed using Caspase-8 Colorimetric Assay Kit (BioVision K113–25). Plate was incubated for 2 h at 37°C and read on FLUOstar Omega plate reader (BMG Labtech) at 400nm.
QUANTIFICATION AND STATISTICAL ANALYSIS
Statistical tests were performed using GraphPad Prism 8 and reported alongside figure legends. For comparison of means, Shapiro-Wilk test was used to assess normality of distribution of samples. For comparison of two groups, unpaired T-test (for samples with normal distribution) and Mann-Whitney test (for samples with non-normal distribution) was used for comparison of means. For comparison of multiple groups, one-way analysis of variance (ANOVA) with Tukey’s, Sidak’s or Dunnett’s multiple comparisons test (for samples with normal distribution) and Kruskal-Wallis with Dunn’s multiple comparisons test (for samples with non-normal distribution) was used. Two-way ANOVA with Tukey’s multiple comparisons test was used for comparison of histopathological analysis of tissue phenotypes. Log-rank test was used to compare Kaplan-Meier survival curves. P values are reported as *P<0.05, **P<0.01, ***P<0.001, **** P<0.0001, ns: not significant.
Supplementary Material
Table S1: Gene list for pathways enriched following Kras* extinction in PiKP cancer cells. Related to Figure 2. A) Top 10 enriched pathways and B) Immune related pathways.
Highlights:
KrasG12D inhibition upregulates Fas death receptor on cancer cells
KrasG12D inhibition increases activated CD4+ and CD8+ T cell infiltrates in PDAC
CD8+ T cells expressing FasL mediate PDAC regression following KrasG12D inhibition
Acknowledgements
This work was supported by NCI P01 CA117969 (RK and RAD), Ergon Foundation Post-Doctoral Trainee Fellowships (KKM, YC, and KMM). RK is a Distinguished University Chair supported by Sid W. Richardson Foundation. Other supports include Small Animal Imaging Facility, Flow Cytometry and Cellular Imaging Core Facility - South Campus and Epigenomics Profiling Core, and Advanced Technology Genomics Core (ATGC) (all supported by NCI P30CA16672) at MD Anderson Cancer Center. We thank Qian Peng for performing qPCRs and tissue culture, Charles Kingsley, Vivien Tran and Martha Taghavi for MRI imaging, Dr. Lisa Becker and Dr. Olga Volpert for review of the data, and Dr. Michael Curran and Dr. Cassian Yee for their assessment and input on this work. AM acknowledges support from Sheikh Khalifa bin Zayed Foundation and R01CA220236.
Footnotes
Declaration of interests
Y.C., K.M.M. received speaker honorarium from Stellanova Therapeutics. V.S.L. is a Scientific Advisory Board member and stock holder of Stellanova Therapeutics. R.A.D. is a founder, advisor, and director of Tvardi Therapeutics, Inc., cofounder and advisor to Asylia Therapeutics, Nirogy Therapeutics, Stellanova Therapeutics, and Sporos Bioventures. A.M. receives royalties from Cosmos Wisdom Biotechnology and is listed as an inventor of a patent licensed to Thrive Earlier Detection, an Exact Sciences Company. A.M. is a consultant for Freenome and Tezcat Biotechnology.
Inclusion and Diversity Statement
One or more of the authors of this paper self-identifies as an underrepresented ethnic minority in their field of research or within their geographical location. One or more of the authors of this paper self-identifies as a gender minority in their field of research.
Publisher's Disclaimer: This is a PDF file of an unedited manuscript that has been accepted for publication. As a service to our customers we are providing this early version of the manuscript. The manuscript will undergo copyediting, typesetting, and review of the resulting proof before it is published in its final form. Please note that during the production process errors may be discovered which could affect the content, and all legal disclaimers that apply to the journal pertain.
References
- 1.Liudahl SM, Betts CB, Sivagnanam S, Morales-Oyarvide V, da Silva A, Yuan C, Hwang S, Grossblatt-Wait A, Leis KR, Larson W, et al. (2021). Leukocyte Heterogeneity in Pancreatic Ductal Adenocarcinoma: Phenotypic and Spatial Features Associated with Clinical Outcome. Cancer Discov 11, 2014–2031. 10.1158/2159-8290.CD-20-0841. [DOI] [PMC free article] [PubMed] [Google Scholar]
- 2.Carstens JL, Correa de Sampaio P, Yang D, Barua S, Wang H, Rao A, Allison JP, LeBleu VS, and Kalluri R. (2017). Spatial computation of intratumoral T cells correlates with survival of patients with pancreatic cancer. Nat Commun 8, 15095. 10.1038/ncomms15095. [DOI] [PMC free article] [PubMed] [Google Scholar]
- 3.Hodi FS, O’Day SJ, McDermott DF, Weber RW, Sosman JA, Haanen JB, Gonzalez R, Robert C, Schadendorf D, Hassel JC, et al. (2010). Improved survival with ipilimumab in patients with metastatic melanoma. N Engl J Med 363, 711–723. 10.1056/NEJMoa1003466. [DOI] [PMC free article] [PubMed] [Google Scholar]
- 4.Lamm DL., Blumenstein BA., Crawford ED., Montie JE., Scardino P., Grossman HB., Stanisic TH., Smith JA Jr., Sullivan J., Sarosdy MF., and et al. (1991). A randomized trial of intravesical doxorubicin and immunotherapy with bacille Calmette-Guerin for transitional-cell carcinoma of the bladder. N Engl J Med 325, 1205–1209. 10.1056/NEJM1991102432. [DOI] [PubMed] [Google Scholar]
- 5.Royal RE, Levy C, Turner K, Mathur A, Hughes M, Kammula US, Sherry RM, Topalian SL, Yang JC, Lowy I, and Rosenberg SA (2010). Phase 2 trial of single agent Ipilimumab (anti-CTLA-4) for locally advanced or metastatic pancreatic adenocarcinoma. J Immunother 33, 828–833. 10.1097/CJI.0b013e3181eec14c. [DOI] [PMC free article] [PubMed] [Google Scholar]
- 6.Le DT, Lutz E, Uram JN, Sugar EA, Onners B, Solt S, Zheng L, Diaz LA Jr., Donehower RC, Jaffee EM, and Laheru DA (2013). Evaluation of ipilimumab in combination with allogeneic pancreatic tumor cells transfected with a GM-CSF gene in previously treated pancreatic cancer. J Immunother 36, 382389. 10.1097/CJI.0b013e31829fb7a2. [DOI] [PMC free article] [PubMed] [Google Scholar]
- 7.Winograd R, Byrne KT, Evans RA, Odorizzi PM, Meyer AR, Bajor DL, Clendenin C, Stanger BZ, Furth EE, Wherry EJ, and Vonderheide RH (2015). Induction of T-cell Immunity Overcomes Complete Resistance to PD-1 and CTLA-4 Blockade and Improves Survival in Pancreatic Carcinoma. Cancer immunology research 3, 399–411. 10.1158/2326-6066.CIR-14-0215. [DOI] [PMC free article] [PubMed] [Google Scholar]
- 8.Evans RA, Diamond MS, Rech AJ, Chao T, Richardson MW, Lin JH, Bajor DL, Byrne KT, Stanger BZ, Riley JL, et al. (2016). Lack of immunoediting in murine pancreatic cancer reversed with neoantigen. JCI Insight 1. 10.1172/jci.insight.88328. [DOI] [PMC free article] [PubMed] [Google Scholar]
- 9.Pylayeva-Gupta Y, Lee KE, Hajdu CH, Miller G, and Bar-Sagi D. (2012). Oncogenic Kras-induced GM-CSF production promotes the development of pancreatic neoplasia. Cancer Cell 21, 836–847. 10.1016/j.ccr.2012.04.024. [DOI] [PMC free article] [PubMed] [Google Scholar]
- 10.Kapoor A, Yao W, Ying H, Hua S, Liewen A, Wang Q, Zhong Y, Wu CJ, Sadanandam A, Hu B, et al. (2014). Yap1 activation enables bypass of oncogenic Kras addiction in pancreatic cancer. Cell 158, 185–197. 10.1016/j.cell.2014.06.003. [DOI] [PMC free article] [PubMed] [Google Scholar]
- 11.Zhang Y, Velez-Delgado A, Mathew E, Li D, Mendez FM, Flannagan K, Rhim AD, Simeone DM, Beatty GL, and Pasca di Magliano M. (2017). Myeloid cells are required for PD-1/PD-L1 checkpoint activation and the establishment of an immunosuppressive environment in pancreatic cancer. Gut 66, 124–136. 10.1136/gutjnl-2016-312078. [DOI] [PMC free article] [PubMed] [Google Scholar]
- 12.Liao W, Overman MJ, Boutin AT, Shang X, Zhao D, Dey P, Li J, Wang G, Lan Z, Li J, et al. (2019). KRAS-IRF2 Axis Drives Immune Suppression and Immune Therapy Resistance in Colorectal Cancer. Cancer Cell 35, 559–572 e557. 10.1016/j.ccell.2019.02.008. [DOI] [PMC free article] [PubMed] [Google Scholar]
- 13.Yamamoto K, Venida A, Yano J, Biancur DE, Kakiuchi M, Gupta S, Sohn ASW, Mukhopadhyay S, Lin EY, Parker SJ, et al. (2020). Autophagy promotes immune evasion of pancreatic cancer by degrading MHC-I. Nature 581, 100–105. 10.1038/s41586-020-2229-5. [DOI] [PMC free article] [PubMed] [Google Scholar]
- 14.Aguirre AJ, Bardeesy N, Sinha M, Lopez L, Tuveson DA, Horner J, Redston MS, and DePinho RA (2003). Activated Kras and Ink4a/Arf deficiency cooperate to produce metastatic pancreatic ductal adenocarcinoma. Genes Dev 17, 3112–3126. 10.1101/gad.1158703. [DOI] [PMC free article] [PubMed] [Google Scholar]
- 15.Izeradjene K., Combs C., Best M., Gopinathan A., Wagner A., Grady WM., Deng CX., Hruban RH., Adsay NV., Tuveson DA., and Hingorani SR. (2007). Kras(G12D) and Smad4/Dpc4 haploinsufficiency cooperate to induce mucinous cystic neoplasms and invasive adenocarcinoma of the pancreas. Cancer Cell 11, 229–243. 10.1016/j.ccr.2007.01.017. [DOI] [PubMed] [Google Scholar]
- 16.Grabocka E, and Bar-Sagi D. (2016). Mutant KRAS Enhances Tumor Cell Fitness by Upregulating Stress Granules. Cell 167, 1803–1813 e1812. 10.1016/j.cell.2016.11.035. [DOI] [PMC free article] [PubMed] [Google Scholar]
- 17.Kamerkar S, LeBleu VS, Sugimoto H, Yang S, Ruivo CF, Melo SA, Lee JJ, and Kalluri R. (2017). Exosomes facilitate therapeutic targeting of oncogenic KRAS in pancreatic cancer. Nature 546, 498–503. 10.1038/nature22341. [DOI] [PMC free article] [PubMed] [Google Scholar]
- 18.Alagesan B, Contino G, Guimaraes AR, Corcoran RB, Deshpande V, Wojtkiewicz GR, Hezel AF, Wong KK, Loda M, Weissleder R, et al. (2015). Combined MEK and PI3K inhibition in a mouse model of pancreatic cancer. Clin Cancer Res 21, 396–404. 10.1158/1078-0432.CCR-14-1591. [DOI] [PMC free article] [PubMed] [Google Scholar]
- 19.Ying H, Dey P, Yao W, Kimmelman AC, Draetta GF, Maitra A, and DePinho RA (2016). Genetics and biology of pancreatic ductal adenocarcinoma. Genes Dev 30, 355–385. 10.1101/gad.275776.115. [DOI] [PMC free article] [PubMed] [Google Scholar]
- 20.Bardeesy N, Cheng KH, Berger JH, Chu GC, Pahler J, Olson P, Hezel AF, Horner J, Lauwers GY, Hanahan D, and DePinho RA (2006). Smad4 is dispensable for normal pancreas development yet critical in progression and tumor biology of pancreas cancer. Genes Dev 20, 3130–3146. 10.1101/gad.1478706. [DOI] [PMC free article] [PubMed] [Google Scholar]
- 21.Hingorani SR, Wang L, Multani AS, Combs C, Deramaudt TB, Hruban RH, Rustgi AK, Chang S, and Tuveson DA (2005). Trp53R172H and KrasG12D cooperate to promote chromosomal instability and widely metastatic pancreatic ductal adenocarcinoma in mice. Cancer Cell 7, 469–483. 10.1016/j.ccr.2005.04.023. [DOI] [PubMed] [Google Scholar]
- 22.Blando J, Sharma A, Higa MG, Zhao H, Vence L, Yadav SS, Kim J, Sepulveda AM, Sharp M, Maitra A, et al. (2019). Comparison of immune infiltrates in melanoma and pancreatic cancer highlights VISTA as a potential target in pancreatic cancer. Proc Natl Acad Sci U S A 116, 1692–1697. 10.1073/pnas.1811067116. [DOI] [PMC free article] [PubMed] [Google Scholar]
- 23.Dey P, Li J, Zhang J, Chaurasiya S, Strom A, Wang H, Liao WT, Cavallaro F, Denz P, Bernard V, et al. (2020). Oncogenic KRAS-Driven Metabolic Reprogramming in Pancreatic Cancer Cells Utilizes Cytokines from the Tumor Microenvironment. Cancer Discov 10, 608–625. 10.1158/2159-8290.CD-19-0297. [DOI] [PMC free article] [PubMed] [Google Scholar]
- 24.Daley D, Zambirinis CP, Seifert L, Akkad N, Mohan N, Werba G, Barilla R, Torres-Hernandez A, Hundeyin M, Mani VRK, et al. (2016). gammadelta T Cells Support Pancreatic Oncogenesis by Restraining alphabeta T Cell Activation. Cell 166, 1485–1499 e1415. 10.1016/j.cell.2016.07.046. [DOI] [PMC free article] [PubMed] [Google Scholar]
- 25.Zhang Y., Yan W., Mathew E., Bednar F., Wan S., Collins MA., Evans RA., Welling TH., Vonderheide RH., and di Magliano MP. (2014). CD4+ T lymphocyte ablation prevents pancreatic carcinogenesis in mice. Cancer Immunol Res 2, 423–435. 10.1158/2326-6066.CIR-14-0016-T. [DOI] [PMC free article] [PubMed] [Google Scholar]
- 26.McAllister F, Bailey JM, Alsina J, Nirschl CJ, Sharma R, Fan H, Rattigan Y, Roeser JC, Lankapalli RH, Zhang H, et al. (2014). Oncogenic Kras activates a hematopoietic-to-epithelial IL-17 signaling axis in preinvasive pancreatic neoplasia. Cancer Cell 25, 621–637. 10.1016/j.ccr.2014.03.014. [DOI] [PMC free article] [PubMed] [Google Scholar]
- 27.Zhang Y, Lazarus J, Steele NG, Yan W, Lee HJ, Nwosu ZC, Halbrook CJ, Menjivar RE, Kemp SB, Sirihorachai VR, et al. (2020). Regulatory T-cell Depletion Alters the Tumor Microenvironment and Accelerates Pancreatic Carcinogenesis. Cancer Discov 10, 422–439. 10.1158/2159-8290.CD-19-0958. [DOI] [PMC free article] [PubMed] [Google Scholar]
- 28.Ying H, Kimmelman AC, Lyssiotis CA, Hua S, Chu GC, Fletcher-Sananikone E, Locasale JW, Son J, Zhang H, Coloff JL, et al. (2012). Oncogenic Kras maintains pancreatic tumors through regulation of anabolic glucose metabolism. Cell 149, 656–670. 10.1016/j.cell.2012.01.058. [DOI] [PMC free article] [PubMed] [Google Scholar]
- 29.Basturk O, Hong SM, Wood LD, Adsay NV, Albores-Saavedra J, Biankin AV, Brosens LA, Fukushima N, Goggins M, Hruban RH, et al. (2015). A Revised Classification System and Recommendations From the Baltimore Consensus Meeting for Neoplastic Precursor Lesions in the Pancreas. Am J Surg Pathol 39, 1730–1741. 10.1097/PAS.0000000000000533. [DOI] [PMC free article] [PubMed] [Google Scholar]
- 30.Hruban RH, Adsay NV, Albores-Saavedra J, Compton C, Garrett ES, Goodman SN, Kern SE, Klimstra DS, Kloppel G, Longnecker DS, et al. (2001). Pancreatic intraepithelial neoplasia: a new nomenclature and classification system for pancreatic duct lesions. Am J Surg Pathol 25, 579–586. 10.1097/00000478-200105000-00003. [DOI] [PubMed] [Google Scholar]
- 31.Ijichi H, Chytil A, Gorska AE, Aakre ME, Fujitani Y, Fujitani S, Wright CV, and Moses HL (2006). Aggressive pancreatic ductal adenocarcinoma in mice caused by pancreas-specific blockade of transforming growth factor-beta signaling in cooperation with active Kras expression. Genes Dev 20, 3147–3160. 10.1101/gad.1475506. [DOI] [PMC free article] [PubMed] [Google Scholar]
- 32.Hirsch S, Austyn JM, and Gordon S. (1981). Expression of the macrophage-specific antigen F4/80 during differentiation of mouse bone marrow cells in culture. J Exp Med 154, 713–725. [DOI] [PMC free article] [PubMed] [Google Scholar]
- 33.Pierce SK, Morris JF, Grusby MJ, Kaumaya P, van Buskirk A, Srinivasan M, Crump B, and Smolenski LA (1988). Antigen-presenting function of B lymphocytes. Immunol Rev 106, 149–180. [DOI] [PubMed] [Google Scholar]
- 34.Chen X, and Jensen PE (2008). The role of B lymphocytes as antigen-presenting cells. Arch Immunol Ther Exp (Warsz) 56, 77–83. 10.1007/s00005-008-0014-5. [DOI] [PubMed] [Google Scholar]
- 35.Suda T, Okazaki T, Naito Y, Yokota T, Arai N, Ozaki S, Nakao K, and Nagata S. (1995). Expression of the Fas ligand in cells of T cell lineage. J Immunol 154, 3806–3813. [PubMed] [Google Scholar]
- 36.Lettau M, Paulsen M, Kabelitz D, and Janssen O. (2008). Storage, expression and function of Fas ligand, the key death factor of immune cells. Curr Med Chem 15, 1684–1696. [DOI] [PubMed] [Google Scholar]
- 37.Rouvier E, Luciani MF, and Golstein P. (1993). Fas involvement in Ca(2+)-independent T cell-mediated cytotoxicity. J Exp Med 177, 195–200. [DOI] [PMC free article] [PubMed] [Google Scholar]
- 38.Dockrell DH., Badley AD., Villacian JS., Heppelmann CJ., Algeciras A., Ziesmer S., Yagita H., Lynch DH., Roche PC., Leibson PJ., and Paya CV. (1998). The expression of Fas Ligand by macrophages and its upregulation by human immunodeficiency virus infection. J Clin Invest 101, 2394–2405. 10.1172/JCI1171. [DOI] [PMC free article] [PubMed] [Google Scholar]
- 39.Hahne M, Renno T, Schroeter M, Irmler M, French L, Bornard T, MacDonald HR, and Tschopp J. (1996). Activated B cells express functional Fas ligand. Eur J Immunol 26, 721–724. 10.1002/eji.1830260332. [DOI] [PubMed] [Google Scholar]
- 40.Hiromatsu K, Aoki Y, Makino M, Matsumoto Y, Mizuochi T, Gotoh Y, Nomoto K, Ogasawara J, Nagata S, and Yoshikai Y. (1994). Increased Fas antigen expression in murine retrovirus-induced immunodeficiency syndrome, MAIDS. European journal of immunology 24, 2446–2451. 10.1002/eji.1830241028. [DOI] [PubMed] [Google Scholar]
- 41.Wilkinson PC, and Liew FY (1995). Chemoattraction of human blood T lymphocytes by interleukin-15. J Exp Med 181, 1255–1259. [DOI] [PMC free article] [PubMed] [Google Scholar]
- 42.Dooms H, Desmedt M, Vancaeneghem S, Rottiers P, Goossens V, Fiers W, and Grooten J. (1998). Quiescence-inducing and antiapoptotic activities of IL-15 enhance secondary CD4+ T cell responsiveness to antigen. J Immunol 161, 2141–2150. [PubMed] [Google Scholar]
- 43.Waldmann TA (2006). The biology of interleukin-2 and interleukin-15: implications for cancer therapy and vaccine design. Nat Rev Immunol 6, 595–601. 10.1038/nri1901. [DOI] [PubMed] [Google Scholar]
- 44.Jabri B, and Abadie V. (2015). IL-15 functions as a danger signal to regulate tissue-resident T cells and tissue destruction. Nat Rev Immunol 15, 771–783. 10.1038/nri3919. [DOI] [PMC free article] [PubMed] [Google Scholar]
- 45.Dubois S, Mariner J, Waldmann TA, and Tagaya Y. (2002). IL-15Ralpha recycles and presents IL-15 In trans to neighboring cells. Immunity 17, 537–547. [DOI] [PubMed] [Google Scholar]
- 46.Elyada E, Bolisetty M, Laise P, Flynn WF, Courtois ET, Burkhart RA, Teinor JA, Belleau P, Biffi G, Lucito MS, et al. (2019). Cross-Species Single-Cell Analysis of Pancreatic Ductal Adenocarcinoma Reveals Antigen-Presenting Cancer-Associated Fibroblasts. Cancer Discov 9, 1102–1123. 10.1158/2159-8290.CD-19-0094. [DOI] [PMC free article] [PubMed] [Google Scholar]
- 47.Gazin C, Wajapeyee N, Gobeil S, Virbasius CM, and Green MR (2007). An elaborate pathway required for Ras-mediated epigenetic silencing. Nature 449, 1073–1077. 10.1038/nature06251. [DOI] [PMC free article] [PubMed] [Google Scholar]
- 48.Mou H, Moore J, Malonia SK, Li Y, Ozata DM, Hough S, Song CQ, Smith JL, Fischer A, Weng Z, et al. (2017). Genetic disruption of oncogenic Kras sensitizes lung cancer cells to Fas receptor-mediated apoptosis. Proc Natl Acad Sci U S A 114, 3648–3653. 10.1073/pnas.1620861114. [DOI] [PMC free article] [PubMed] [Google Scholar]
- 49.Wajapeyee N, Malonia SK, Palakurthy RK, and Green MR (2013). Oncogenic RAS directs silencing of tumor suppressor genes through ordered recruitment of transcriptional repressors. Genes Dev 27, 2221–2226. 10.1101/gad.227413.113. [DOI] [PMC free article] [PubMed] [Google Scholar]
- 50.Peli J, Schroter M, Rudaz C, Hahne M, Meyer C, Reichmann E, and Tschopp J. (1999). Oncogenic Ras inhibits Fas ligand-mediated apoptosis by downregulating the expression of Fas. EMBO J 18, 1824–1831. 10.1093/emboj/18.7.1824. [DOI] [PMC free article] [PubMed] [Google Scholar]
- 51.Duan R, Du W, and Guo W. (2020). EZH2: a novel target for cancer treatment. J Hematol Oncol 13, 104. 10.1186/s13045-020-00937-8. [DOI] [PMC free article] [PubMed] [Google Scholar]
- 52.Peng J., Sun BF., Chen CY., Zhou JY., Chen YS., Chen H., Liu L., Huang D., Jiang J., Cui GS., et al. (2019). Single-cell RNA-seq highlights intra-tumoral heterogeneity and malignant progression in pancreatic ductal adenocarcinoma. Cell Res 29, 725–738. 10.1038/s41422-019-0195-y. [DOI] [PMC free article] [PubMed] [Google Scholar]
- 53.Goldman MJ, Craft B, Hastie M, Repecka K, McDade F, Kamath A, Banerjee A, Luo Y, Rogers D, Brooks AN, et al. (2020). Visualizing and interpreting cancer genomics data via the Xena platform. Nat Biotechnol 38, 675–678. 10.1038/s41587-020-0546-8. [DOI] [PMC free article] [PubMed] [Google Scholar]
- 54.Newman AM, Liu CL, Green MR, Gentles AJ, Feng W, Xu Y, Hoang CD, Diehn M, and Alizadeh AA (2015). Robust enumeration of cell subsets from tissue expression profiles. Nat Methods 12, 453–457. 10.1038/nmeth.3337. [DOI] [PMC free article] [PubMed] [Google Scholar]
- 55.Canon J, Rex K, Saiki AY, Mohr C, Cooke K, Bagal D, Gaida K, Holt T, Knutson CG, Koppada N, et al. (2019). The clinical KRAS(G12C) inhibitor AMG 510 drives anti-tumour immunity. Nature 575, 217–223. 10.1038/s41586-019-1694-1. [DOI] [PubMed] [Google Scholar]
- 56.Quezada SA, Peggs KS, Simpson TR, Shen Y, Littman DR, and Allison JP (2008). Limited tumor infiltration by activated T effector cells restricts the therapeutic activity of regulatory T cell depletion against established melanoma. J Exp Med 205, 2125–2138. 10.1084/jem.20080099. [DOI] [PMC free article] [PubMed] [Google Scholar]
- 57.Suzuki I, Martin S, Boursalian TE, Beers C, and Fink PJ (2000). Fas ligand costimulates the in vivo proliferation of CD8+ T cells. J Immunol 165, 5537–5543. 10.4049/jimmunol.165.10.5537. [DOI] [PubMed] [Google Scholar]
- 58.Viale A, Pettazzoni P, Lyssiotis CA, Ying H, Sanchez N, Marchesini M, Carugo A, Green T, Seth S, Giuliani V, et al. (2014). Oncogene ablation-resistant pancreatic cancer cells depend on mitochondrial function. Nature 514, 628–632. 10.1038/nature13611. [DOI] [PMC free article] [PubMed] [Google Scholar]
- 59.Kemp SB, Cheng N, Markosyan N, Sor R, Kim IK, Hallin J, Shoush J, Quinones L, Brown NV, Bassett JB, et al. (2022). Efficacy of a small molecule inhibitor of KrasG12D in immunocompetent models of pancreatic cancer. Cancer Discov. 10.1158/2159-8290.CD-22-1066. [DOI] [PMC free article] [PubMed] [Google Scholar]
- 60.Liu J, Lichtenberg T, Hoadley KA, Poisson LM, Lazar AJ, Cherniack AD, Kovatich AJ, Benz CC, Levine DA, Lee AV, et al. (2018). An Integrated TCGA Pan-Cancer Clinical Data Resource to Drive High-Quality Survival Outcome Analytics. Cell 173, 400–416 e411. 10.1016/j.cell.2018.02.052. [DOI] [PMC free article] [PubMed] [Google Scholar]
- 61.Marino S, Vooijs M, van Der Gulden H, Jonkers J, and Berns A. (2000). Induction of medulloblastomas in p53-null mutant mice by somatic inactivation of Rb in the external granular layer cells of the cerebellum. Genes Dev 14, 994–1004. [PMC free article] [PubMed] [Google Scholar]
- 62.Kawaguchi Y, Cooper B, Gannon M, Ray M, MacDonald RJ, and Wright CV (2002). The role of the transcriptional regulator Ptf1a in converting intestinal to pancreatic progenitors. Nat Genet 32, 128–134. 10.1038/ng959. [DOI] [PubMed] [Google Scholar]
- 63.Chytil A, Magnuson MA, Wright CV, and Moses HL (2002). Conditional inactivation of the TGF-beta type II receptor using Cre:Lox. Genesis 32, 73–75. [DOI] [PubMed] [Google Scholar]
- 64.Bryant KL, Stalnecker CA, Zeitouni D, Klomp JE, Peng S, Tikunov AP, Gunda V, Pierobon M, Waters AM, George SD, et al. (2019). Combination of ERK and autophagy inhibition as a treatment approach for pancreatic cancer. Nat Med 25, 628–640. 10.1038/s41591-019-0368-8. [DOI] [PMC free article] [PubMed] [Google Scholar]
- 65.Olive KP., Tuveson DA., Ruhe ZC., Yin B., Willis NA., Bronson RT., Crowley D., and Jacks T. (2004). Mutant p53 gain of function in two mouse models of Li-Fraumeni syndrome. Cell 119, 847–860. 10.1016/j.cell.2004.11.004. [DOI] [PubMed] [Google Scholar]
- 66.Chang WH, Liu Y, Hammes EA, Bryant KL, Cerione RA, and Antonyak MA (2023). Oncogenic RAS promotes MYC protein stability by upregulating the expression of the inhibitor of apoptosis protein family member Survivin. J Biol Chem 299, 102842. 10.1016/j.jbc.2022.102842. [DOI] [PMC free article] [PubMed] [Google Scholar]
- 67.Schneider CA, Rasband WS, and Eliceiri KW (2012). NIH Image to ImageJ: 25 years of image analysis. Nat Methods 9, 671–675. 10.1038/nmeth.2089. [DOI] [PMC free article] [PubMed] [Google Scholar]
- 68.Butler A, Hoffman P, Smibert P, Papalexi E, and Satija R. (2018). Integrating single-cell transcriptomic data across different conditions, technologies, and species. Nat Biotechnol 36, 411–420. 10.1038/nbt.4096. [DOI] [PMC free article] [PubMed] [Google Scholar]
- 69.Sun D, Wang J, Han Y, Dong X, Ge J, Zheng R, Shi X, Wang B, Li Z, Ren P, et al. (2021). TISCH: a comprehensive web resource enabling interactive single-cell transcriptome visualization of tumor microenvironment. Nucleic Acids Res 49, D1420–D1430. 10.1093/nar/gkaa1020. [DOI] [PMC free article] [PubMed] [Google Scholar]
- 70.van Dijk D, Sharma R, Nainys J, Yim K, Kathail P, Carr AJ, Burdziak C, Moon KR, Chaffer CL, Pattabiraman D, et al. (2018). Recovering Gene Interactions from Single-Cell Data Using Data Diffusion. Cell 174, 716–729 e727. 10.1016/j.cell.2018.05.061. [DOI] [PMC free article] [PubMed] [Google Scholar]
- 71.Linderman GC, Zhao J, Roulis M, Bielecki P, Flavell RA, Nadler B, and Kluger Y. (2022). Zero-preserving imputation of single-cell RNA-seq data. Nat Commun 13, 192. 10.1038/s41467-021-27729-z. [DOI] [PMC free article] [PubMed] [Google Scholar]
- 72.Blecher-Gonen R, Barnett-Itzhaki Z, Jaitin D, Amann-Zalcenstein D, Lara-Astiaso D, and Amit I. (2013). High-throughput chromatin immunoprecipitation for genome-wide mapping of in vivo protein-DNA interactions and epigenomic states. Nat Protoc 8, 539–554. 10.1038/nprot.2013.023. [DOI] [PubMed] [Google Scholar]
Associated Data
This section collects any data citations, data availability statements, or supplementary materials included in this article.
Supplementary Materials
Table S1: Gene list for pathways enriched following Kras* extinction in PiKP cancer cells. Related to Figure 2. A) Top 10 enriched pathways and B) Immune related pathways.
Data Availability Statement
The accession numbers for the data reported in this paper have been deposited in GEO and are publicly available as of the date of publication. Accession numbers are listed in the Key resources table. The single-cell RNA sequencing analyses in this study were based on recently published datasets that are available as GEO: GSE129455 and GSA: CRA001160. The gene expression data of TCGA pancreatic adenocarcinoma (PAAD) was downloaded from the UCSC Xena database. The clinical survival data for these patients was obtained from the previous study 60. Source data are included in Data S1 and original western blot images are included in the supplementary material. Any additional information required to reanalyze the data reported in this paper is available from the lead contact upon request. This paper does not report original code.