

Abstract
Ensemble perception is a process by which we summarize complex scenes. Despite the importance of ensemble perception to everyday cognition, there are few computational models that provide a formal account of this process. Here we develop and test a model in which ensemble representations reflect the global sum of activation signals across all individual items. We leverage this set of minimal assumptions to formally connect a model of memory for individual items to ensembles. We compare our ensemble model against a set of alternative models in five experiments. Our approach uses performance on a visual memory task for individual items to generate zero-free-parameter predictions of interindividual and intraindividual differences in performance on an ensemble continuous-report task. Our top-down modelling approach formally unifies models of memory for individual items and ensembles and opens a venue for building and comparing models of distinct memory processes and representations.
Human perception and cognition are grounded in a capacity-limited system1–4. A basic question across research areas in the behavioural sciences is how people effectively represent an environment that should far exceed their processing capabilities5. One widely accepted answer to this question is that perceptual and cognitive systems take advantage of redundancies in the environment by forming a condensed summary or gist6–8. In the visual domain, the ability of people to extract summaries in this way is commonly referred to as ensemble perception9.
In a standard laboratory ensemble task, participants are shown a set of stimuli that share properties in a specific feature dimension, such as colour, and are instructed to report on their average along that dimension. Figure 1 depicts two example ensemble tasks with colours and shapes. People are remarkably accurate at these tasks and often notably better at reporting the average of the set than at reporting on any individual item10. Extensive empirical and theoretical work suggests that ensemble processing partially underlies our ability to create more robust representations of simple scenes10,11, categorize objects12 and guide our attention13. Such tasks may also lead to critical insights into the limits of conscious perception. For example, preserved ensemble information in the relative absence of information about individuals is thought to show that ‘phenomenal’ consciousness overflows conscious access14,15.
Fig. 1 |. Laboratory ensemble tasks.
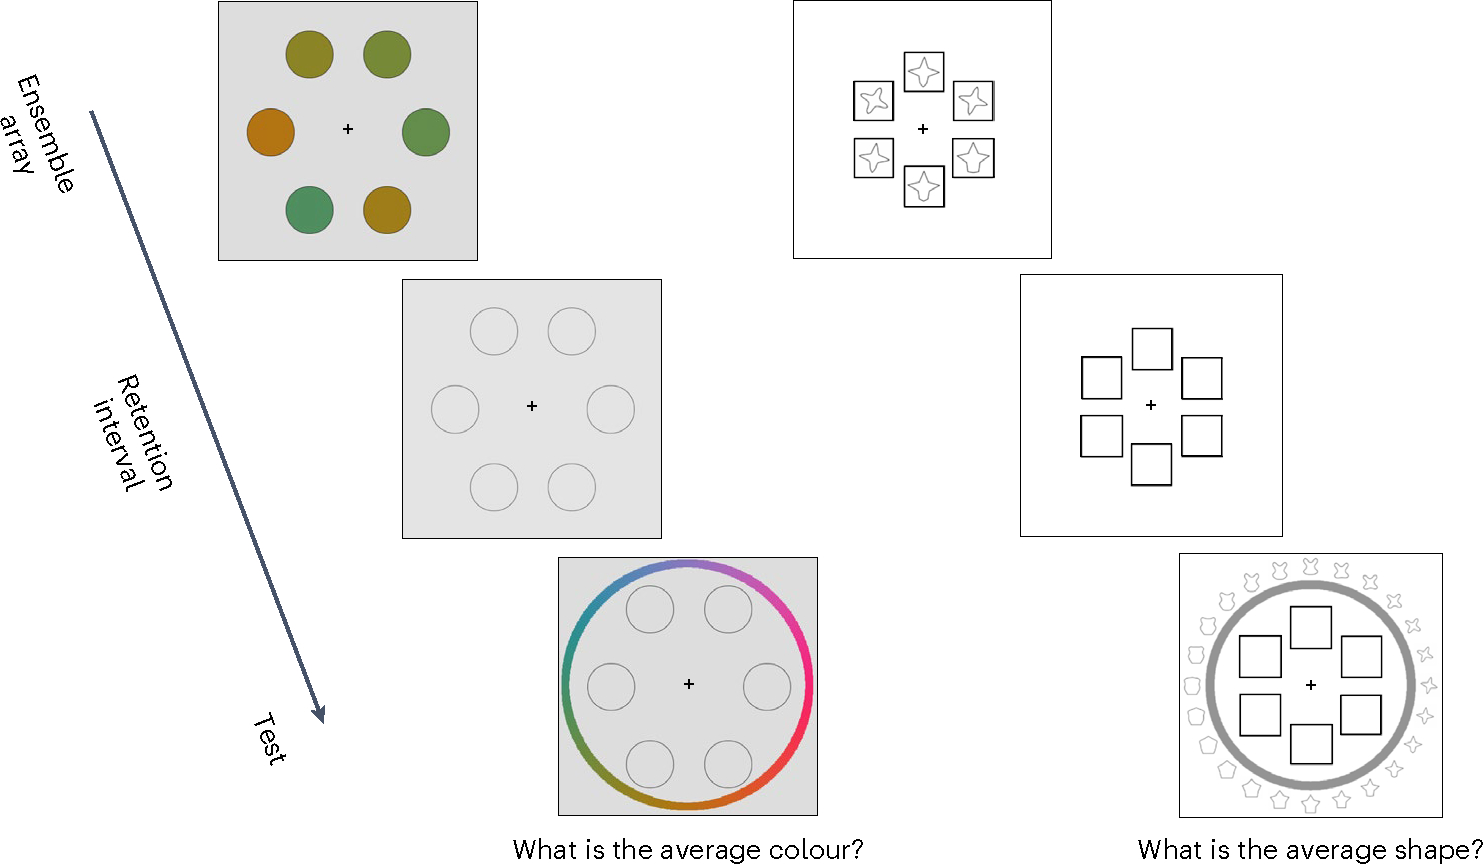
Examples of laboratory ensemble tasks in which participants are typically asked to report on the average along a stimulus dimension, such as colour or shape, using a continuous reproduction task.
Given the fundamental role of ensemble processing, there is immense value in developing process-based models that explain the mechanisms of ensemble extraction. However, so far, mainstream theories of ensemble extraction are largely grounded in verbal descriptions9. A known limitation of verbal theories is that they may lack the precision of mathematical models, which is requisite for delineating hypothetical constructs and adjudicating between competing theoretical accounts16–19.
The goal of the current work is to attempt to fill this gap. We present a theoretical framework and quantitative models of ensemble memory, and compare these models in different experiments to test core process-based hypotheses of how ensembles are computed and represented. We report consistent evidence for a Perceptual Summation model of ensemble memory. According to this model, stimuli evoke distributed patterns of activity over feature values, and ensemble representations reflect the global sum of these activations. We find that this model captures a range of phenomena in the ensemble and gist-memory literature.
A major aspect of our modelling framework is that rather than deriving a ‘best fit’ to ensemble data alone, we instead formally link a model of memory for individual items with ensembles. Accordingly, we use our framework to predict performance in a wide range of ensemble tasks, which differ in both stimuli and presentation format, from tasks that involve processing of individual items. This modelling thus involves generalizing across different cognitive tasks rather than simply fitting the data of a particular task20–22. The proposed model also provides a high-precision account of human performance by capturing complete distributions of errors in continuous-report tasks. Finally, this framework postulates probabilistic mental representations, making it broadly consistent with contemporary population coding models of perception and cognition23. Next, we review relevant theoretical work on ensemble perception, placing a special focus on dichotomies that highlight core questions researchers may want a model of ensemble processing to answer.
Existing theories of ensemble perception are foundational for stimulating hypotheses of ensemble perception and memory9,24. We use these theories to outline three relevant dichotomies, which highlight core desiderata for a quantitative process model of ensembles.
The first dichotomy is between views that ensemble processing does versus does not involve operating over representations of individual items24. This is a core dichotomy because it speaks to how ensemble representations are computed. It also bears on the extent to which ensembles are possible to compute when item information is unavailable to memory, which is critical for theories about the role of ensembles in consciousness15,25.
One class of views posit that ensemble processing involves pooling over already-processed representations of individual items10,26–28. According to this view, people have complete representations of individual items and pool them to compute an ensemble. In contrast, other views suggest that ensemble processing involves automatically extracting an average without first representing each individual on its own6,25. Researchers have also proposed that ensemble extraction involves dividing the total amount of activation elicited by perceived items by their number, without explicitly representing individual items29.
Much of the work that seeks to address how representations of individual items relate to ensembles is non-quantitative, which can make the connection between individual and ensemble representations difficult to explain. For example, some researchers report that representations of ensembles are present even when memory for individual items is at chance, implying distinct representations for both10. However, these authors also report that pooling noisy information about individual items can predict ensemble data27. The question of how representations of individual items relate to ensembles thus remains an important puzzle in the ensemble literature.
The second relevant dichotomy is between views that noise accrues during an ‘early’ versus ‘late’ stage of ensemble processing30. We make two distinctions between possible types of early and late noise in ensemble processing. The first is between perceptual and post-perceptual noise—that is, noise that accrues during perception without memory demands versus noise that accrues during memory-based processes, such as active maintenance. The second distinction is between presummarization and postsummarization noise31, which is noise that accrues before versus after ensemble representations are computed.
We distinguish between these two kinds of early and late noise because it is conceptually possible, and is in fact an assumption of the model we propose, that patterns of activation elicited by individual items are corrupted by perceptual noise (consistent with early perceptual noise accrual) but that post-perceptual noise accrues after rather than before ensembles are computed (consistent with late postsummarization noise accrual). This view entails that ensemble computation operates over item representations that are corrupted by perceptual but not post-perceptual noise. This contrasts to some subsampling accounts, according to which only a few items are used to create ensemble representations. Current subsampling models are more aligned with the view that ensembles are computed after post-perceptual noise accrues over representations of individual items, which are then used to compute an ensemble when memory is tested28. Broadly, these dichotomies between variants of early and late theories of noise provide insight into the time course of ensemble extraction.
The last relevant dichotomy is between views that ensemble representations are probabilistic versus point estimates. For instance, some researchers examined the content of ensemble-like representations in a visual search task32. These authors reported evidence that people are sensitive to the entire underlying (uniform or Gaussian) distribution of features in the external environment, rather than simply an estimate of the average and variance of those features. This claim is consistent with people storing entire probability distributions over visual features, at least in the kind of implicit tasks used in that work33. This probabilistic representation view contrasts with an alternative view that people represent a point estimate of the ensemble, such as an average in feature space of each individual item10,24. This dichotomy speaks to the richness of ‘summaries’ computed in ensemble tasks.
The current model posits that ensemble processing involves pooling over individual item representations. It also postulates that representations of individual items are corrupted by noise at an early perceptual stage, but that post-perceptual noise accrues after ensembles are computed. This aligns with the view that ensemble perception is distinct from simply actively maintaining individual items in working memory and then summarizing them when ensemble memory is probed. Finally, the model posits probabilistic representations, according to which each individual item as well as the ensemble is represented as a distribution of activity over the entire feature space. We next describe the quantitative framework that serves as the conceptual and mathematical basis for the current ensemble model.
We took a top-down strategy for developing a computational model of ensemble processing34. We used an existing quantitative framework of memory and carved out a set of plausible constraints on the algorithms that underlie ensemble perception and memory for them. We formalized these constraints using a set of computational models.
We conceived of the current ensemble model using the target confusability competition (TCC) theory of memory35. In a set of more than a dozen experiments, TCC outperformed mainstream models of visual memory in terms of both fit to data and ability to predict data across distinct visual working and long-term memory tasks. The TCC model combines two fundamental ideas shared by a broad range of cognitive computational models (Fig. 2a), which are that memory-based decisions are made under uncertainty36,37 and that information in the world is processed on the basis of its psychophysical rather than physical similarity structure38–40.
Fig. 2 |. TCC framework for memory of individual items and ensembles.
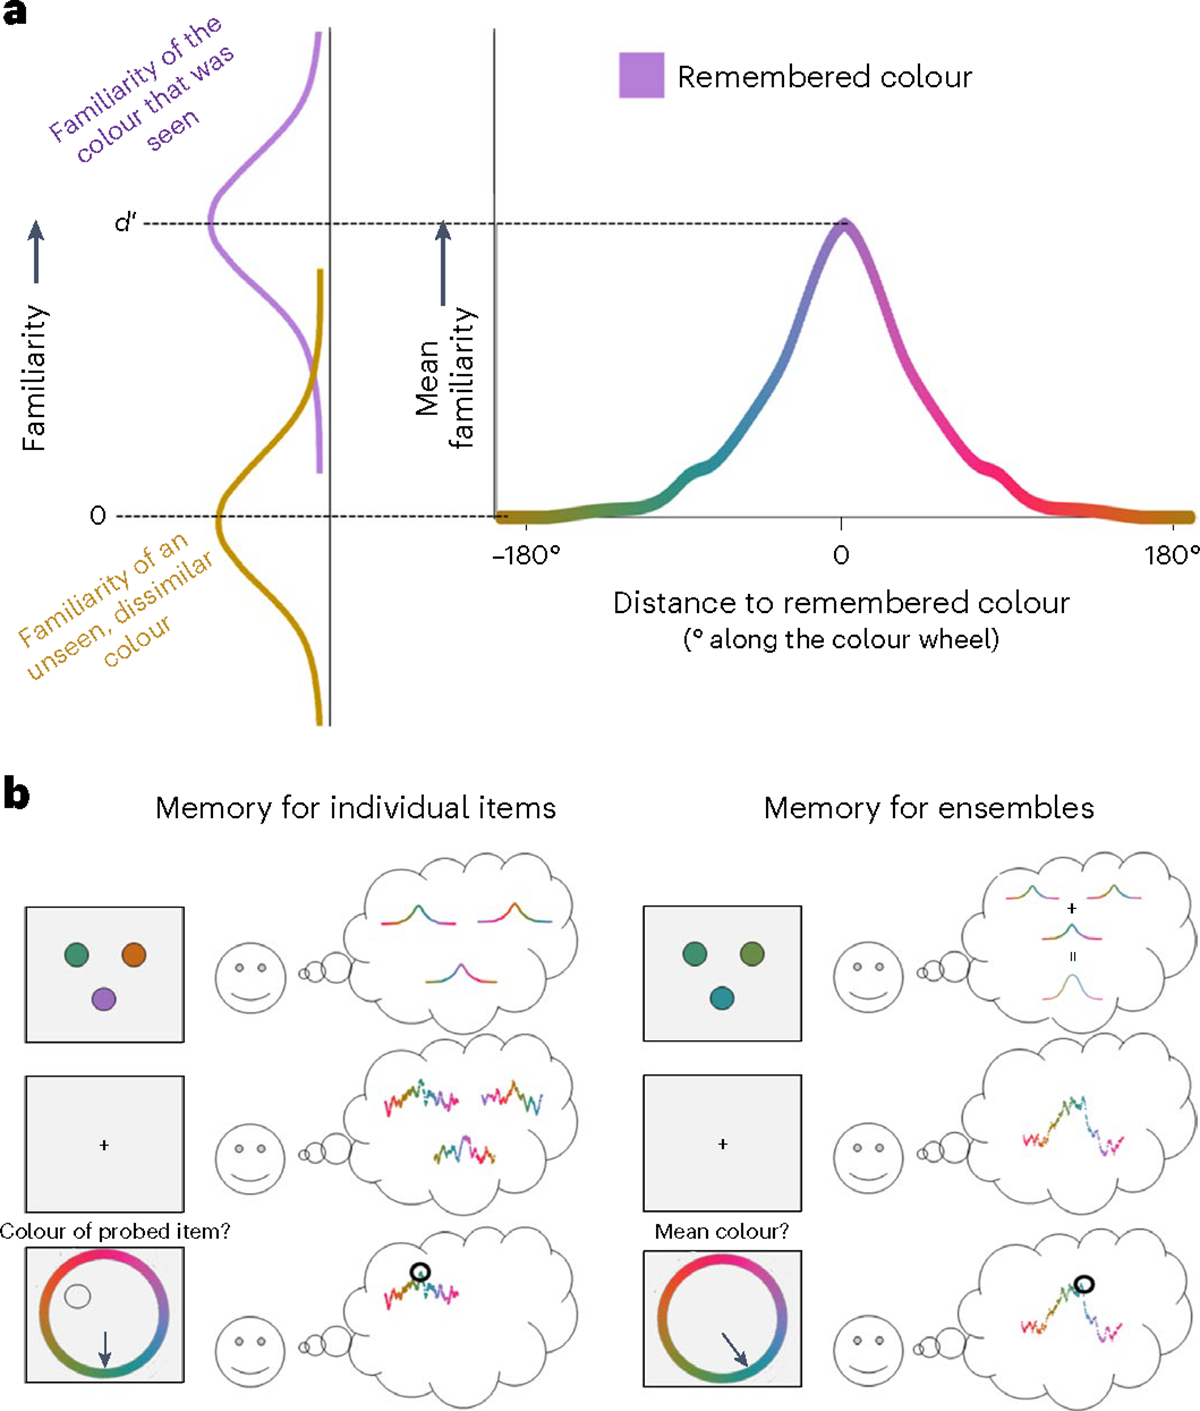
a, The TCC framework merges principles of memory uncertainty and the exponential generalization gradient. On the left, the two Gaussian distributions represent the distribution of familiarity signals for old (purple) and new (yellow/orange) items, with increasing values denoting greater familiarity. Purple, having been seen, on average has higher familiarity, but on a given trial people judge just one sample from this distribution, such that sometimes, yellow/orange may feel more familiar. In line with signal detection theory, the distance between these distributions () quantifies memory fidelity. On the right, the psychophysical similarity function shows how average familiarity scales as a function of psychophysical similarity to the remembered item (for example, the purple at the centre of the distribution has familiarity equal to , and the yellow and orange at the edges have familiarity equal to zero). b, TCC allows us to link models for individual items and ensembles. The left panel shows the TCC model for individual items, which postulates that each item in the memory array elicits a distributed pattern of activation over feature values (upper left), which is corrupted by noise (centre left). When tested, people report on the feature value that generates the maximum memory signal based on the probed item (lower left). The right panel shows the TCC Perceptual Summation model for ensembles, which postulates that each item in the memory array elicits a distributed pattern of activation over feature values, which are pooled at an early encoding stage of processing (upper right). This distributed pattern of activation is corrupted by noise (middle right), and when queried on the mean colour, people report on the feature value that elicits the maximum memory signal in this ensemble representation (lower right).
The first premise of TCC is that memory representations are intrinsically probabilistic and vary in strength, a core principle of signal detection theory37,41,42 and, broadly, Bayesian models of cognition43–46. For instance, a remembered item is assumed to be neither completely forgotten nor completely remembered. Instead, there is a probability distribution over how well the item is remembered, such that sometimes it is remembered with high fidelity and elicits a strong familiarity signal, and other times it is remembered with lower fidelity and elicits a weaker familiarity signal. In signal detection theory and TCC, the strength of each memory’s familiarity signal is captured with the signal-to-noise-ratio parameter, .
The second premise of TCC is that familiarity spreads across feature space according to the stimulus’s psychophysical properties, an assumption shared with other foundational models of memory47–51. Specifically, the familiarity of a given stimulus is a function of the psychophysical similarity between this stimulus and contents of memory, which can also be thought of as distributed patterns of activation in neural populations that are selective to remembered feature values52,53. This assumption entails that stimuli will elicit a stronger familiarity signal if they are more psychophysically similar to contents in memory. For instance, if the remembered item is a purple square, the colour purple will elicit a very strong familiarity signal, as will colours that are nearly perceptually indistinguishable from purple. Colours that are somewhat similar to purple, such as magenta, will also elicit a familiarity signal, which will be stronger than those elicited by relatively dissimilar colours, such as green. This latent psychophysical similarity function and the corresponding distribution of memory signals is approximately exponential in form, in line with previous theories of memory and generalization39,40,54,55.
To summarize, TCC is a model that formally combines two fundamental views about memory processes in a way that permits generalization across memory tasks with a single free parameter, . The generalizability and parsimony of TCC, as well as its basis on probabilistic models of cognition and psychophysical scaling, make it a powerful framework for building cognitive architectures. We used TCC to derive the Perceptual Summation model as well as a set of contending models, with which we tested hypotheses of how ensembles are computed and represented. We also derived and tested a set of alternative, non-TCC-based models that make different processing assumptions. Next, we describe the TCC working-memory model for individual items and explain how we extended it to models of ensemble memory and formally linked these models.
Figure 2b (left) shows a schematic of a typical trial in a visual working memory task for individual items, which requires memorizing three coloured circles and their spatial locations. The TCC model postulates that each item elicits some location-dependent pattern of activity, which causes an increase in familiarity for its respective colour but also for similar colours. These levels of activation are each corrupted by perceptual noise, which makes it more difficult to distinguish highly similar feature values from one another. Throughout our modelling, we assumed that perceptual noise affects individual item activations in the same way in both working memory and ensemble tasks (see Methods for how perceptual noise was measured and modelled).
After individual item representations are perceived, their pattern of activity is corrupted by attention-based and memory-based noise. These effects of post-perceptual noise are captured with a single free parameter, , which quantifies the signal-to-noise ratio of each individual representation. The signal-to-noise ratio is affected by key experimental variables, such as memory load, encoding time and the retention interval, each of which affects how well the items are initially encoded and how much noise accumulates during memory maintenance. At the end of the trial, the probed item’s location is queried, and the participants report on the colour channel that generates the maximum familiarity signal.
Formally, the TCC model for individual items is given by the following equation:
| (1) |
The index denotes the probed item, is the predicted response on the continuous-report visual working memory task for that item, is the measured similarity of each colour x with respect to item is a fixed amount of post-perceptual noise (set to one standard deviation with no loss in generality) and argmax denotes the decision rule that memory reports are based on the feature that generates the maximum familiarity signal.
We developed the Perceptual Summation ensemble model from the TCC model for individual items, as well as constraints based on prior evidence from the ensemble literature. These constraints include seemingly contradictory evidence that memory for individual items can predict memory for ensembles, but that memory for ensembles is more robust than memory for individual items10.
Like the model for individual items, the Perceptual Summation model postulates that each item in the memory array elicits patterns of activity over feature values, each of which is corrupted by perceptual noise (Fig. 2b, right). However, the Perceptual Summation model postulates that the ensemble is extracted during encoding, before memory-based noise accrues over representations of individual items. The model thus postulates that memory-based noise accumulates over the ensemble instead of over representations of each item in the array. When probed on the average, participants report on the colour channel that generates the maximum familiarity signal. The equation for the Perceptual Summation model is the following:
| (2) |
Note that equations (1) and (2) are nearly identical, except that self-reports on the visual working memory task are determined by levels of activation elicited by a single probed item (), whereas self-reports on the ensemble task () are determined by the summed levels of activation of all items.
With this framework, we connected the models for individual items and ensembles. We postulated that the patterns of activation elicited by each item in the memory array are the same in both working memory and ensemble tasks, and are pooled via summation in the early perceptual stage of ensemble extraction. Like in the model for individual items, this pattern of activation is measured with a psychophysical similarity function (which captures how familiarity signals are distributed across feature values for each item) and a single free parameter (which measures the signal-to-noise ratio that scales these patterns of activation on the basis of the demands of the memory task). We formally linked memory for individual items and ensembles by estimating the signal-to-noise ratio () of each individual item from a visual working memory task for individual items, and substituting this signal-to-noise ratio into the Perceptual Summation model to compute the predicted summed pattern of activation of the ensemble. With this approach, we predicted entire distributions of memory errors in continuous-report ensemble tasks with zero free parameters.
To summarize, the difference between representations of individual items and ensembles is that in ensemble tasks patterns of activation elicited by individual items are pooled via summation before post-perceptual noise accrual. This entails that the signal-to-noise ratio of the post-summation ensemble representation will be larger than it is for individual items when there is overlap in feature values or redundancies between items in the ensemble array. Through the lens of likelihood signal detection theory41, this pooling mechanism can be seen as an optimal way of combining the likelihood elicited by each item into a more robust ensemble memory representation, or gist, as opposed to treating the evidence elicited by each item separately.
The Perceptual Summation model’s pooling mechanism can be seen as a cognitive-level approximation of processes described in neural population coding models. Very generally, some evidence suggests that increased population size may increase the amount of information embedded in populations of neurons56. Although the relationship between population size and readout accuracy is extremely complex and an active topic of investigation56–59, this framework provides one neurally plausible instantiation for the computations postulated in the Perceptual Summation model.
To test the predictions of the Perceptual Summation model, we compared it with a set of alternative models. The first prediction we considered is the time course of ensemble extraction. The Perceptual Summation model’s ‘early pooling’ prediction contrasts with an alternative view that individual items are held in working memory until ensemble memory is probed, at which point they are pooled to compute an ensemble. This alternative view is informally embodied in some subsampling theories of ensemble processing28. We formalized this prediction within the TCC framework with the Post-perceptual Summation model.
The Post-perceptual Summation model predicts that people maintain location-dependent representations of each item in memory—as they would in a standard working memory task for individual items—until they are probed on their memory for the ensemble. Thus, according to this model, ensemble representations are computed at a relatively late stage, and each item therefore accrues memory-based noise separately, before the ensemble is pooled. The equation for the Post-perceptual Summation model is the following:
| (3) |
Note that the terms in the Post-perceptual (equation (3)) and Perceptual Summation (equation (2)) models are nearly identical, with the difference that summation occurs over individual items that have already accrued post-perceptual noise (equation (3)) versus before representations of individual items have accrued post-perceptual noise (equation (2)). To summarize, these two models can mimic each other if is allowed to freely vary; however, because we use a generalization approach, is constrained across tasks, allowing us to differentiate these models (see Supplementary Information for extended discussion of these issues).
Finally, we considered an ensemble model that follows from theories that ensemble averages are extracted automatically, without processing of individual items6,25, which we refer to as the Automatic Averaging model. Although still nested within the TCC framework, this model differs from the Perceptual and Post-perceptual Summation models because it postulates that individual items in ensemble tasks automatically elicit distributed patterns of activation around the average feature value in ensemble array, rather than eliciting item-specific patterns of activation that are pooled via summation. This representation of the average is also probabilistic and scaled by the signal-to-noise ratio of a single memory representation. We also consider alternative assumptions about the signal-to-noise ratio for this model in the Supplementary Information. To summarize, this model is equivalent to assuming that the ‘average’ is directly perceptually available to people in the same way as an item that is physically present. As shown in equation (4), this model postulates that people extract a single probability distribution over the mean feature, which is also corrupted by noise:
| (4) |
Note that equation (4) is nearly identical to equation (1) except that the similarity function is centred on the average feature value instead of the value of an individual item. Figure 3 depicts each of these TCC ensemble models.
Fig. 3 |. TCC ensemble models.
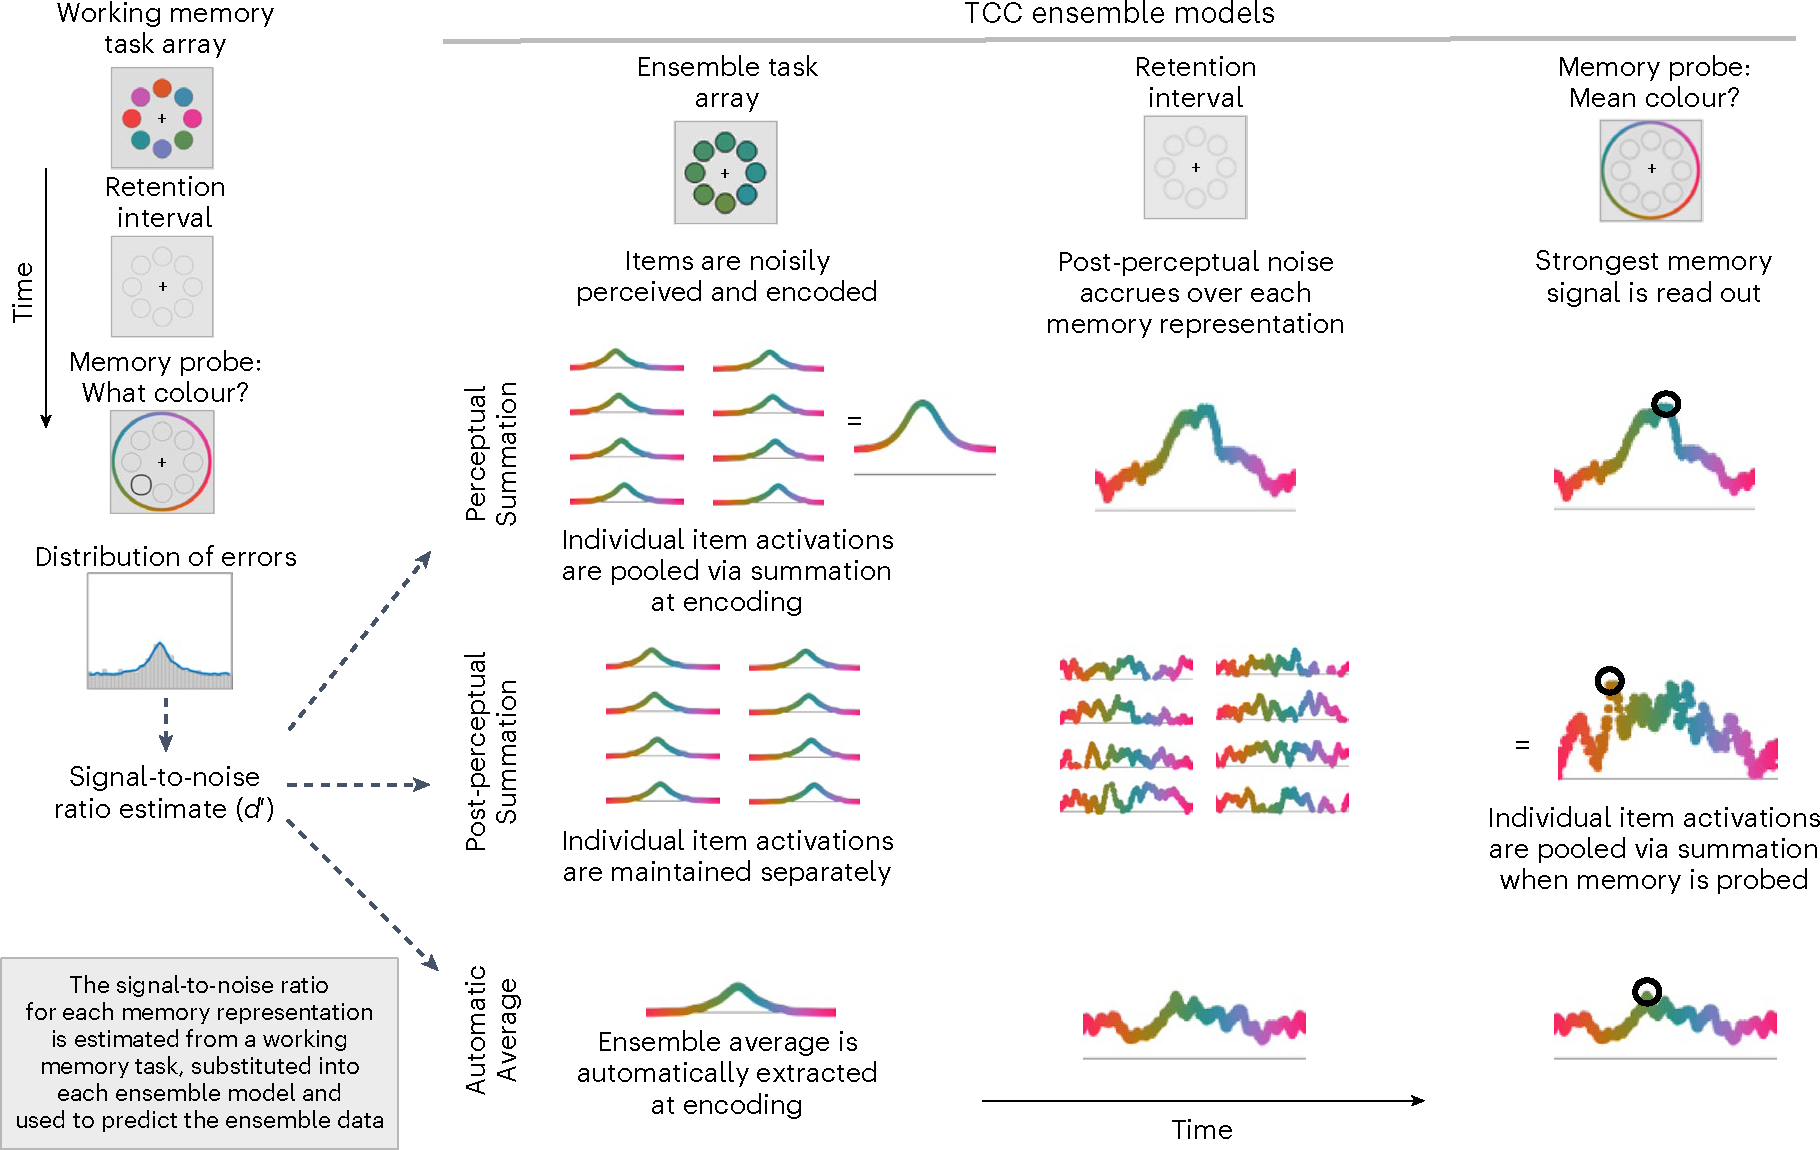
Schematic of all ensemble models that fall within the TCC framework. Within the TCC framework, all ensemble models posit that activations of individual memory representations, quantified with the signal-to-noise ratio (), underlie ensemble memory processes. Accordingly, each model can be used to predict ensemble data with zero free parameters by independently estimating a signal-to-noise ratio from a working memory task and substituting it into the ensemble models. Each model provides a way of linking memory for individual items to memory for ensembles, but each embodies different theoretical assumptions regarding how ensembles are computed. The Perceptual Summation model postulates that each item elicits item-specific patterns of activation that are pooled at an early encoding stage of processing. This model has the potential to capture key predictions in the ensemble memory literature, such as that ensemble representations are more robust than representations of individual items, but that item-specific memory can still predict aspects of ensemble memory. The Post-perceptual Summation model, in contrast, captures the view that representations of individual items are maintained in working memory until memory is probed. Finally, the Automatic Averaging model postulates that ensemble representations of the average are extracted automatically rather than being built up from representations of individual items. Together, comparing these models allows us to formally test key predictions in the ensemble literature using formal model comparison as well as a principled, theoretical framework of memory processes.
So far, these ensemble models posit that, on average, each item is weighted equally when computing an ensemble. This is tenable under conditions that do not lead to disproportionate prioritization of a specific item or subset of items60,61.
However, it is known that some conditions do elicit unequal weighting of items in memory. For instance, items that were shown more recently tend to be remembered better than items shown less recently, and such recency effects affect ensemble representations as well62. To evaluate the generalizability of our modelling, we extended it to conditions in which items receive unequal prioritization in memory. Furthermore, the summation account becomes more distinct from other possible accounts when items vary in strength; therefore, this analysis also provides a stronger test of the view that ensemble representations reflect a sum of local patterns of activation. Finally, this analysis helps demonstrate that we can predict both interindividual and intraindividual variations in ensemble processing.
To this end, in one of our experiments we used a sequential presentation ensemble paradigm. One way to generalize the TCC-based models to this situation is to simply obtain separate estimates for each item in the sequence and use these estimates to compute ensemble predictions. However, we can also use a temporal model that captures memory changes as a function of the sequential presentation with fewer parameters. We used prior modelling work62 to extend our modelling in this way (Methods). As expected, we found the same pattern of results using both types of models. Next, we describe a few alternative, non-TCC models of ensemble perception.
Currently, there are no computational models of ensemble processing that fully capture distributions of errors in a continuous self-report task and that can account for data across a range of ensemble manipulations. However, to bolster the interpretability of our modelling, we derived a set of alternative models that serve as conceptual foils to the TCC ensemble models. Some of these models are baseline models that make extremely simplistic assumptions about ensemble processing, which we use to check the tenability of our TCC models. Other models link memory performance for individual items to memory for ensembles while postulating different assumptions about memory processes, such as that there are true ‘guessing states’63. Each of these models is depicted schematically in Fig. 4. Because we did not find that these are best-performing models, for ease of exposition, we include a conceptual description of these models in the Methods.
Fig. 4 |. Non-TCC ensemble models.
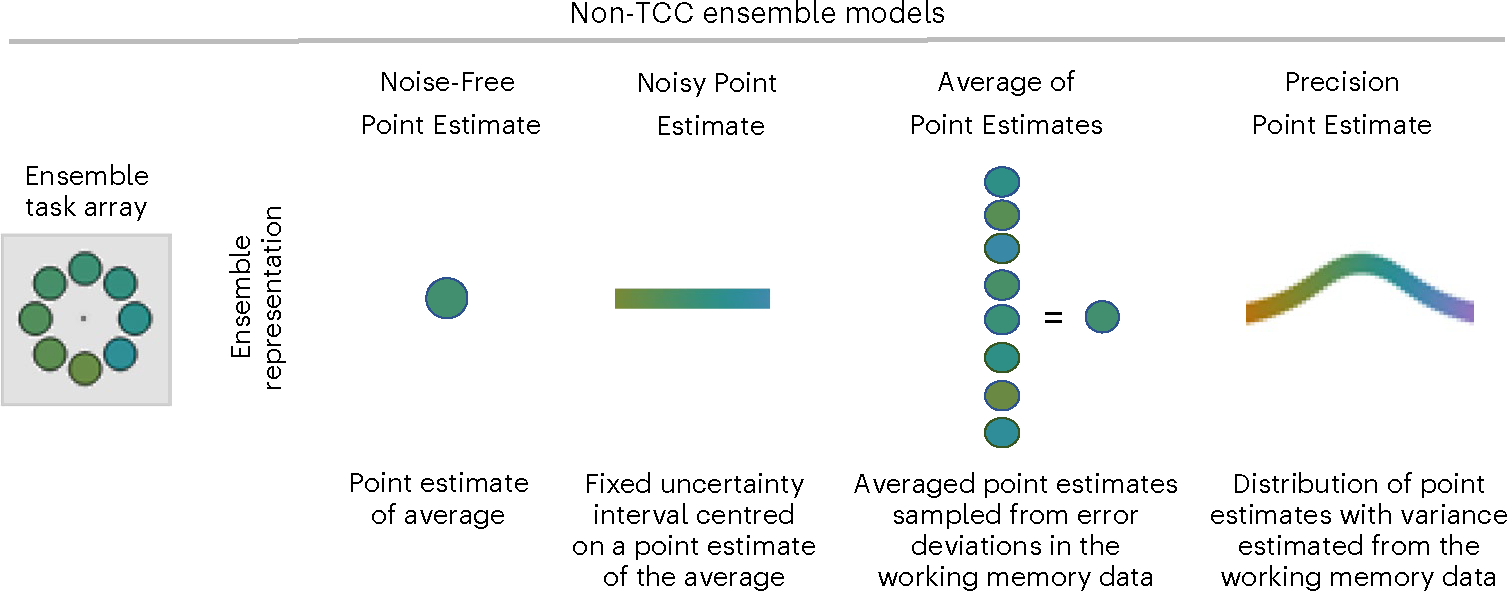
Schematic of all ensemble models that do not fall within the TCC framework. The non-TCC models differ in the extent to which they represent uncertainty (Noisy Point Estimate, Average of Point Estimates and Precision Point Estimate) versus do not (Noise-Free Point Estimate) and the extent to which they assume an averaging of individual item values (Average of Point Estimates) versus a direct extraction of the ensemble mean (Noise-Free and Noisy Point Estimate and Precision Point Estimate). See the main text for the full model descriptions.
We ran five experiments to evaluate the predictive accuracy of each ensemble model, with the goal of assessing the generalizability of our modelling results across different ensemble tasks. As previewed, each experiment had the same structure, meaning that the participants completed one block of a visual working memory task and one block of an ensemble task (presented in random order across participants). This allowed us to measure in the visual working memory task and use it to predict performance in the ensemble task. In Experiments 1 and 2, we examined people’s memory for colour (Fig. 5a) and manipulated set size and the range of colour values in the ensemble task, respectively. In Experiments 3 and 4, we evaluated the generalizability of these results for a higher-level shape feature space (Fig. 5b), where we also manipulated set size and varied the range of shapes, respectively. Finally, in Experiment 5, we used a sequential presentation task (Fig. 5c) to test models when memory representations receive different priority.
Fig. 5 |. Colour, shape and sequential memory tasks.
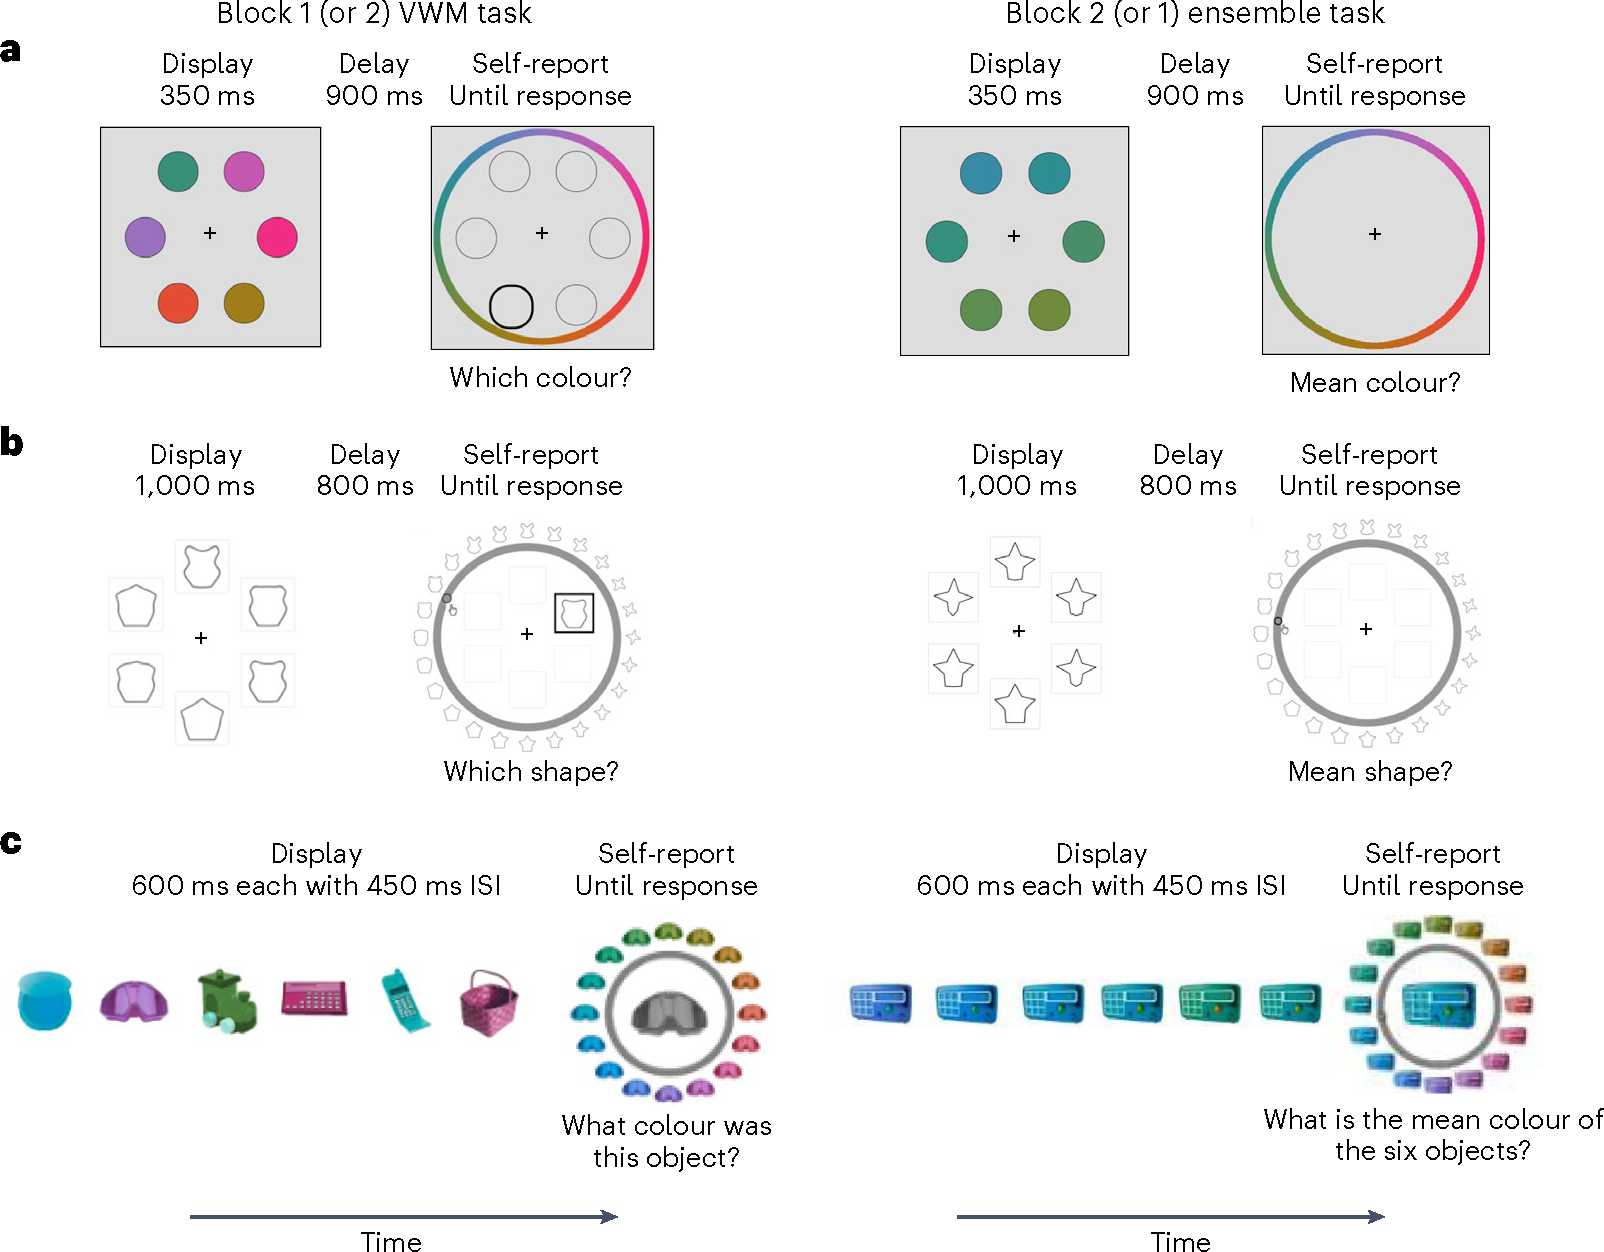
a,b, Example trial sequences used in the visual working memory (VWM) and ensemble tasks with colour (a) and shape (b). In the visual working memory tasks (left), the participants saw a set of colours (a) or shapes (b); then, after a delay, a single location was probed, and the participants had to indicate which colour or shape was in that position. In the ensemble tasks (right), the participants saw a set of colours (a) or shapes (b) and then after a delay were probed on the mean colour or mean shape (for example, a summary of the entire set) rather than on a single individual item. c, An example trial sequence used in the visual working memory and ensemble tasks in Experiment 5. On each trial of the visual working memory task (left), the participants saw a number of coloured real-world objects presented one at a time. Then, a single object appeared at test in greyscale, and the participants had to indicate what colour that particular item had been. In the ensemble task (right), the participants saw a sequence of colours on a single real-world object, and at test they had to indicate the average colour of this object (ISI denotes ‘interstimulus interval’).
Results
Our goal was to evaluate the ability of the Perceptual Summation ensemble model to generalize performance from the visual working memory task to the ensemble task. We formally compared the predictive accuracy of this model with that of other models using the predicted negative log likelihood (PNLL) between it and the contending models. PNLL is a predictive model comparison metric because we assess the models on the basis of their capacity to generalize across tasks—that is, make zero-free-parameter predictions on new data in a different task. However, we do note that all TCC models also yield good fit to the data (R2 ≥ 0.9 across all experiments; Supplementary Information). Because PNLL is a negative log likelihood, lower scores reflect less deviance and better model predictions. PNLL naturally accounts for model complexity because it captures predictive accuracy rather than goodness of fit (for an elaborated discussion of this point, see the Supplementary Information).
For our main analysis with TCC ensemble models, we fit the TCC visual working memory model to the data and substituted estimates from these fits into the ensemble models to predict the ensemble data. To ensure the robustness of our models’ performance, we also implemented a reverse inference analysis in which we fit the ensemble models to the ensemble data and then used the best-fitting parameters from the ensemble task to predict the working memory data (Supplementary Information). We found that our results are robust across these different methods of prediction.
We implemented analyses at the level of individual participants. Specifically, we compared the observed PNLL between each model and the best-performing model using a paired t-test. The data distribution was assumed to be normal, but this was not formally tested. We report the observed effect size (dz) and the lower and upper bounds of a confidence interval for the mean difference (CIL and CIU, respectively). We used a conservative Bonferroni correction63 to control for multiple comparisons. For our main comparisons in Experiments 1–4 and Experiment 5, there were six and eight family-wise comparisons (m), respectively, and the adjusted significance threshold (αA = α/m = 0.05/m) was 0.008 and 0.006, respectively. For our reverse inference comparisons, there were two family-wise comparisons in each experiment, and αA = 0.025. We found that each central comparison was statistically significant when adjusting for multiple comparisons.
Ensemble memory for colour with different set sizes
In Experiment 1, the participants completed a visual working memory and ensemble task that used colour as the stimulus and manipulated set size to assess how each model captures changes as a function of memory load. We found that the Perceptual Summation model was the best-performing model (the PNLL of the Perceptual Summation model was statistically lower than for all alternative models; all P < 0.001). Figure 6 shows the difference in PNLL between the Perceptual Summation and competing models, along with descriptive and inferential statistics. Figure 7 shows the fits of the TCC models to aggregate and example individual data.
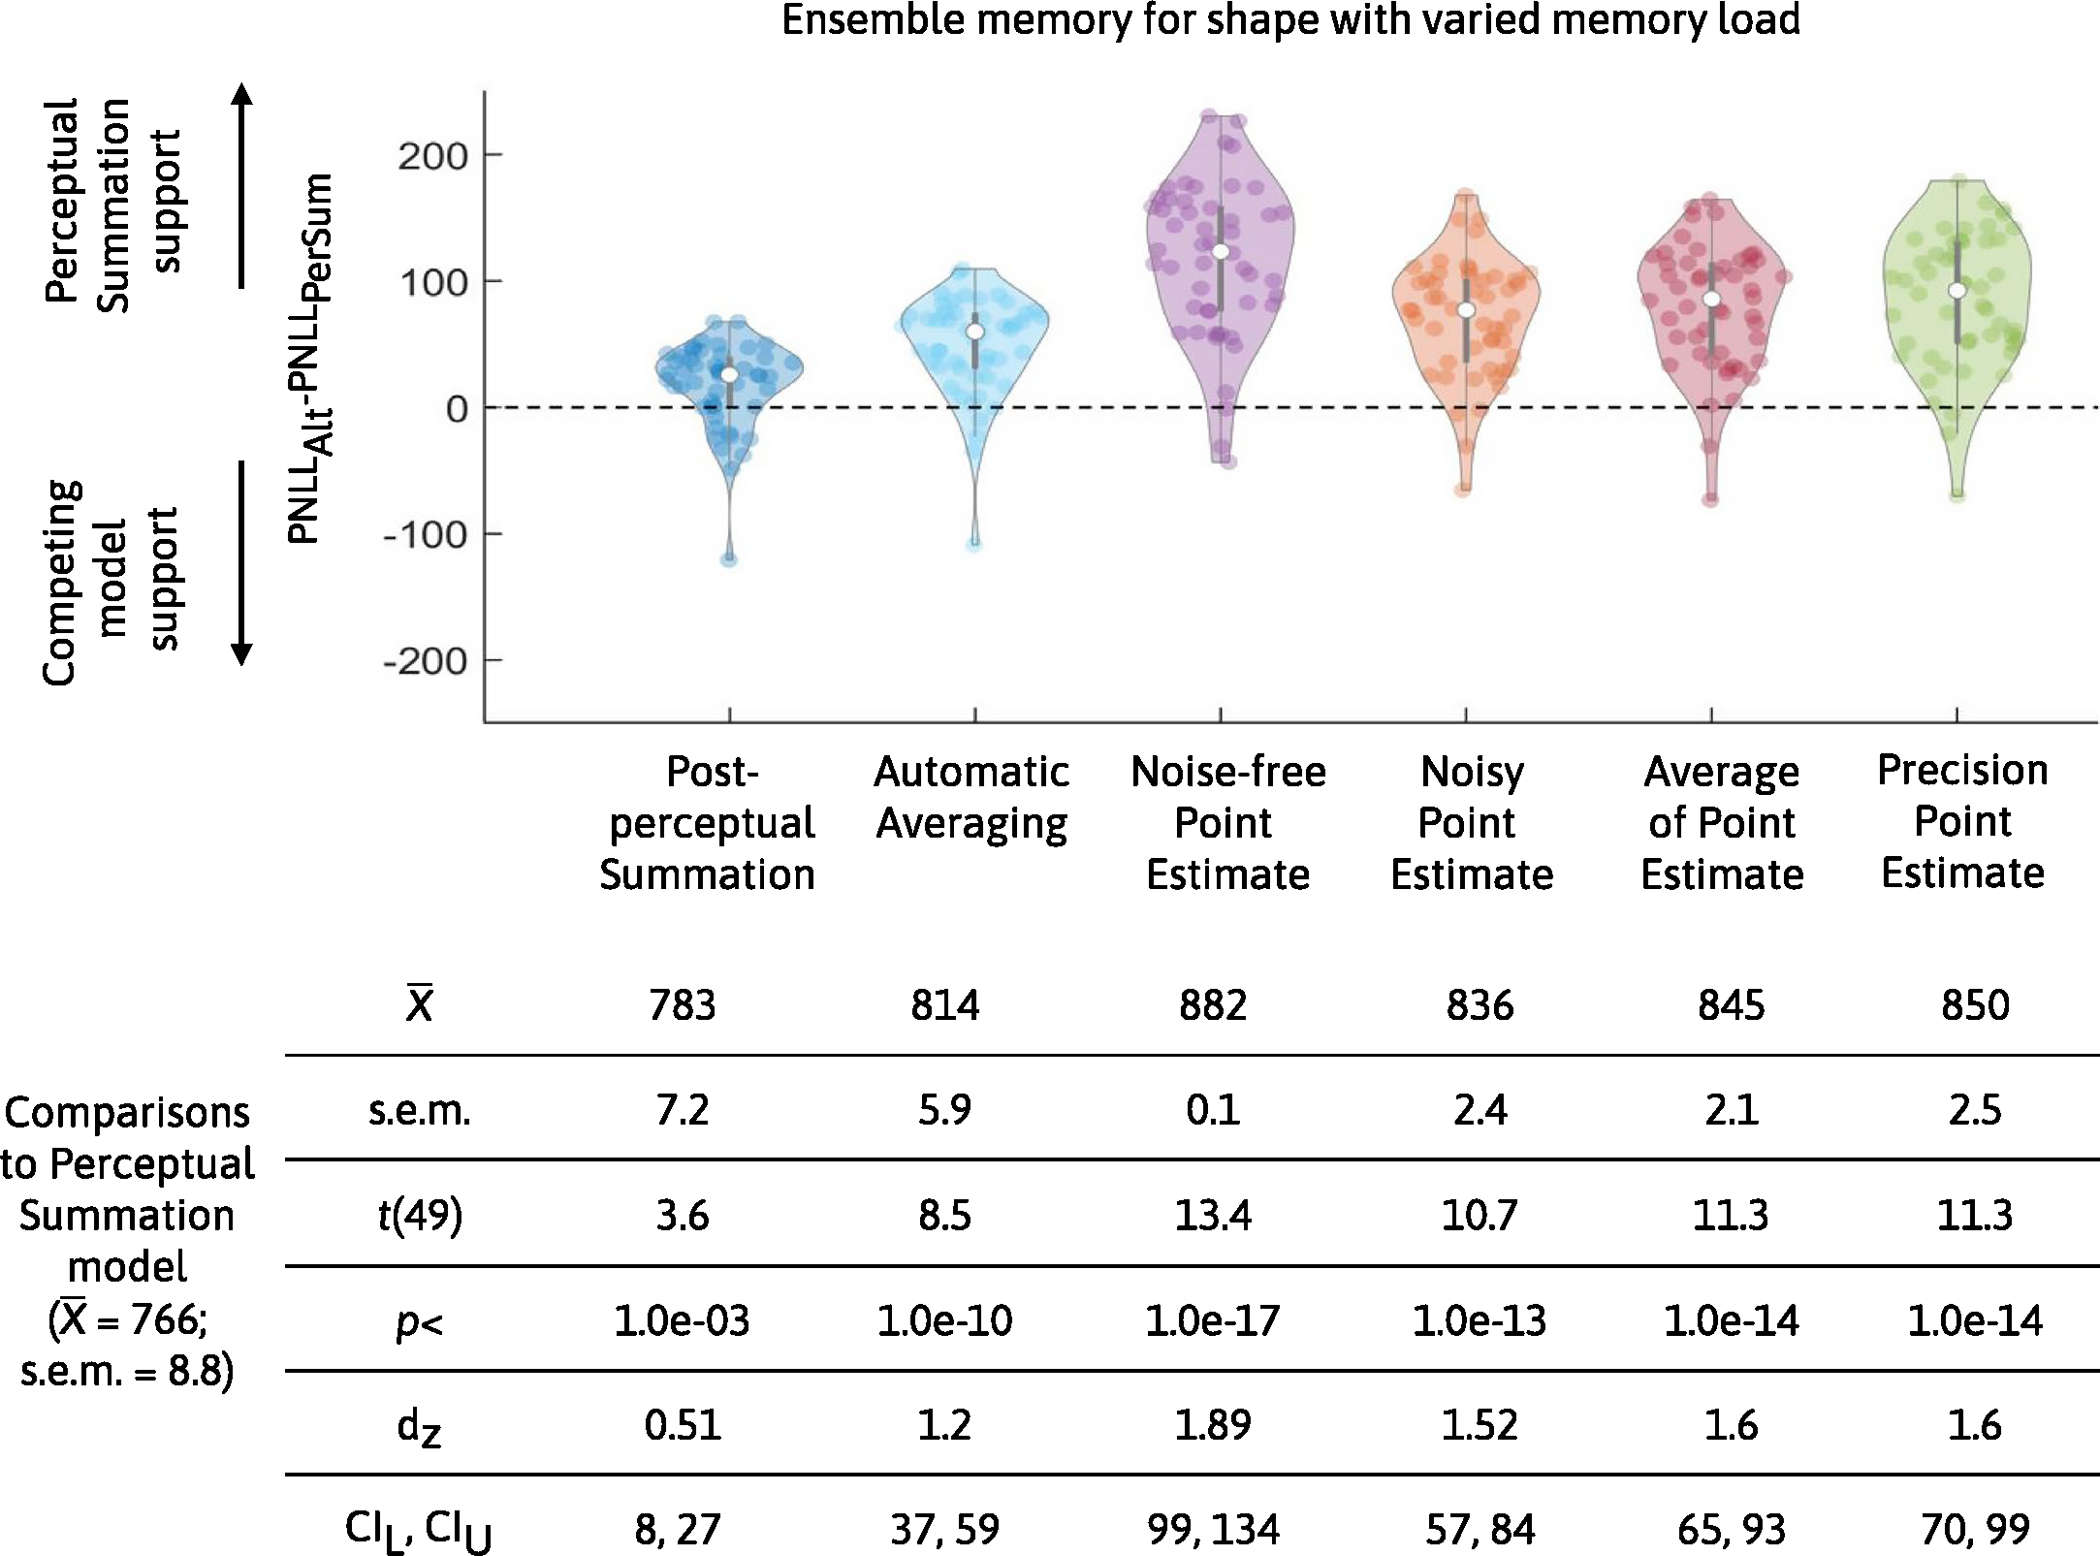
Fig. 6 |. Comparison in predictive accuracy between the Perceptual Summation model and competing models of ensemble memory for colour with set size manipulation.
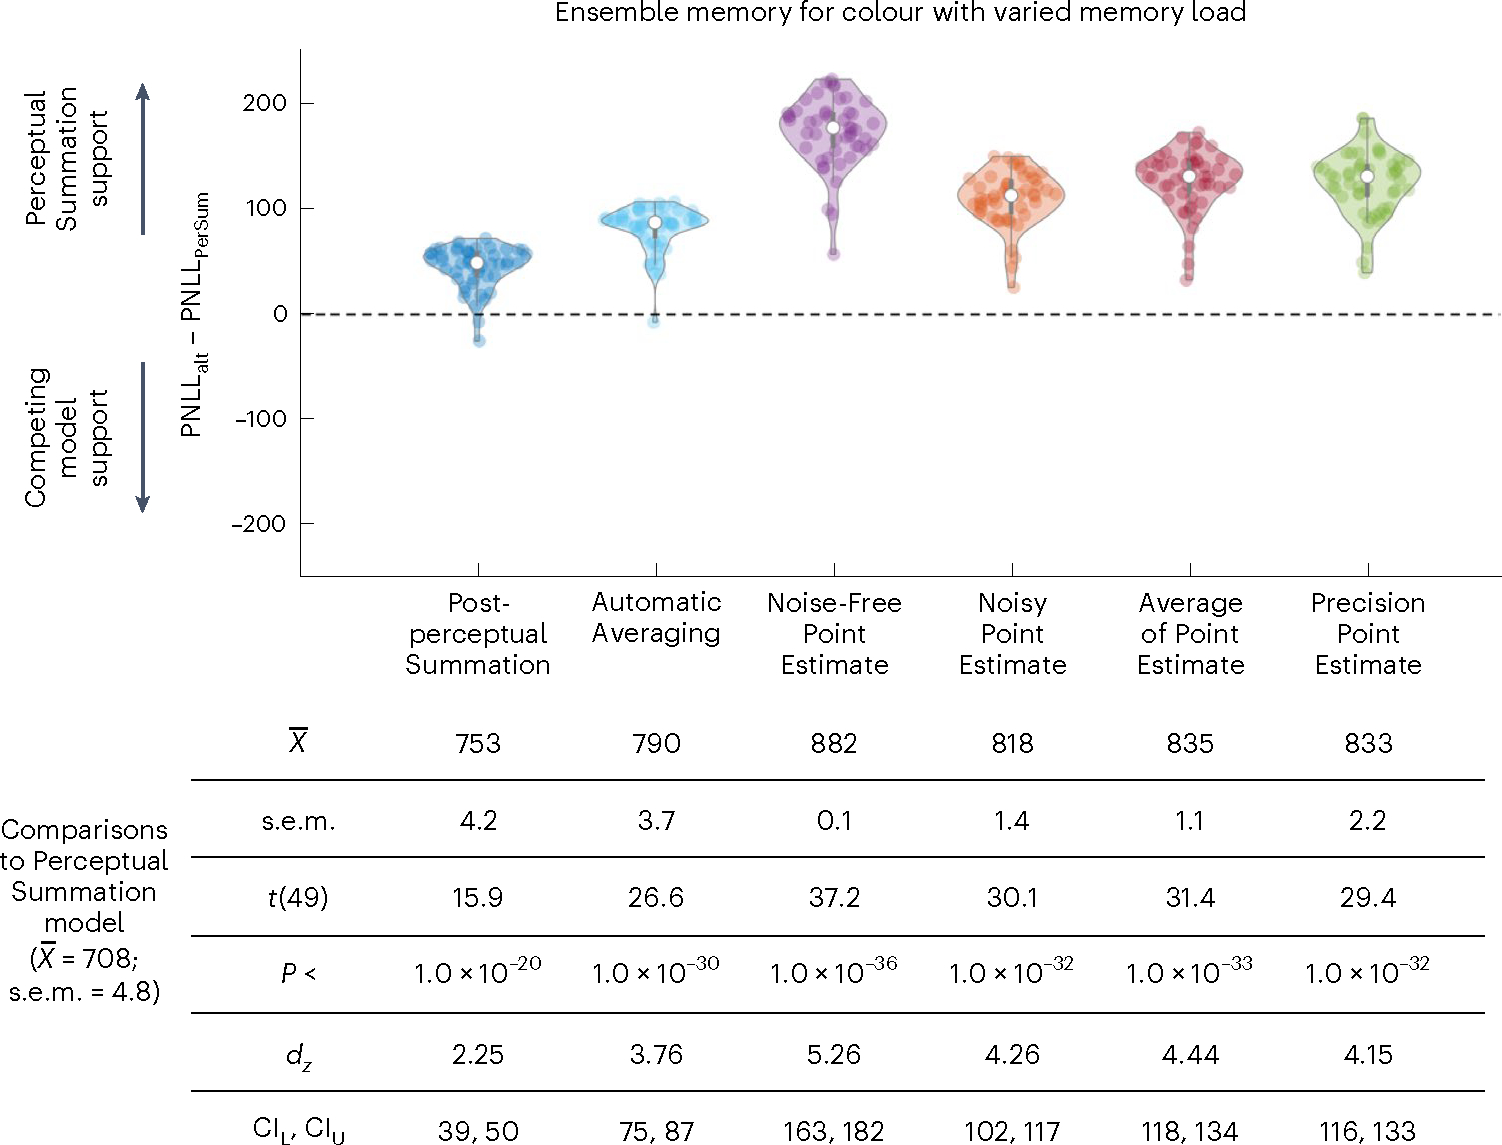
Top, violin plots based on the difference in PNLL scores between each of the six alternative competing models (PNLLalt) and the main Perceptual Summation model (PNLLPerSum) for Experiment 1 (n = 50 participants). Lower PNLL values indicate higher predictive accuracy; therefore, PNLL difference scores higher (or lower) than zero indicate support for the Perceptual Summation (or a competing) model. In both experiments, the vast majority of participants were better predicted by the Perceptual Summation model than by any of the alternatives. Bottom, descriptive and inferential statistics from all comparisons in Experiment 1, including the mean and standard error of the mean across participants. The PNLL values were compared with a paired two-tailed t-test, corrected for multiple comparisons, and all P values were statistically significant (P < 0.001).
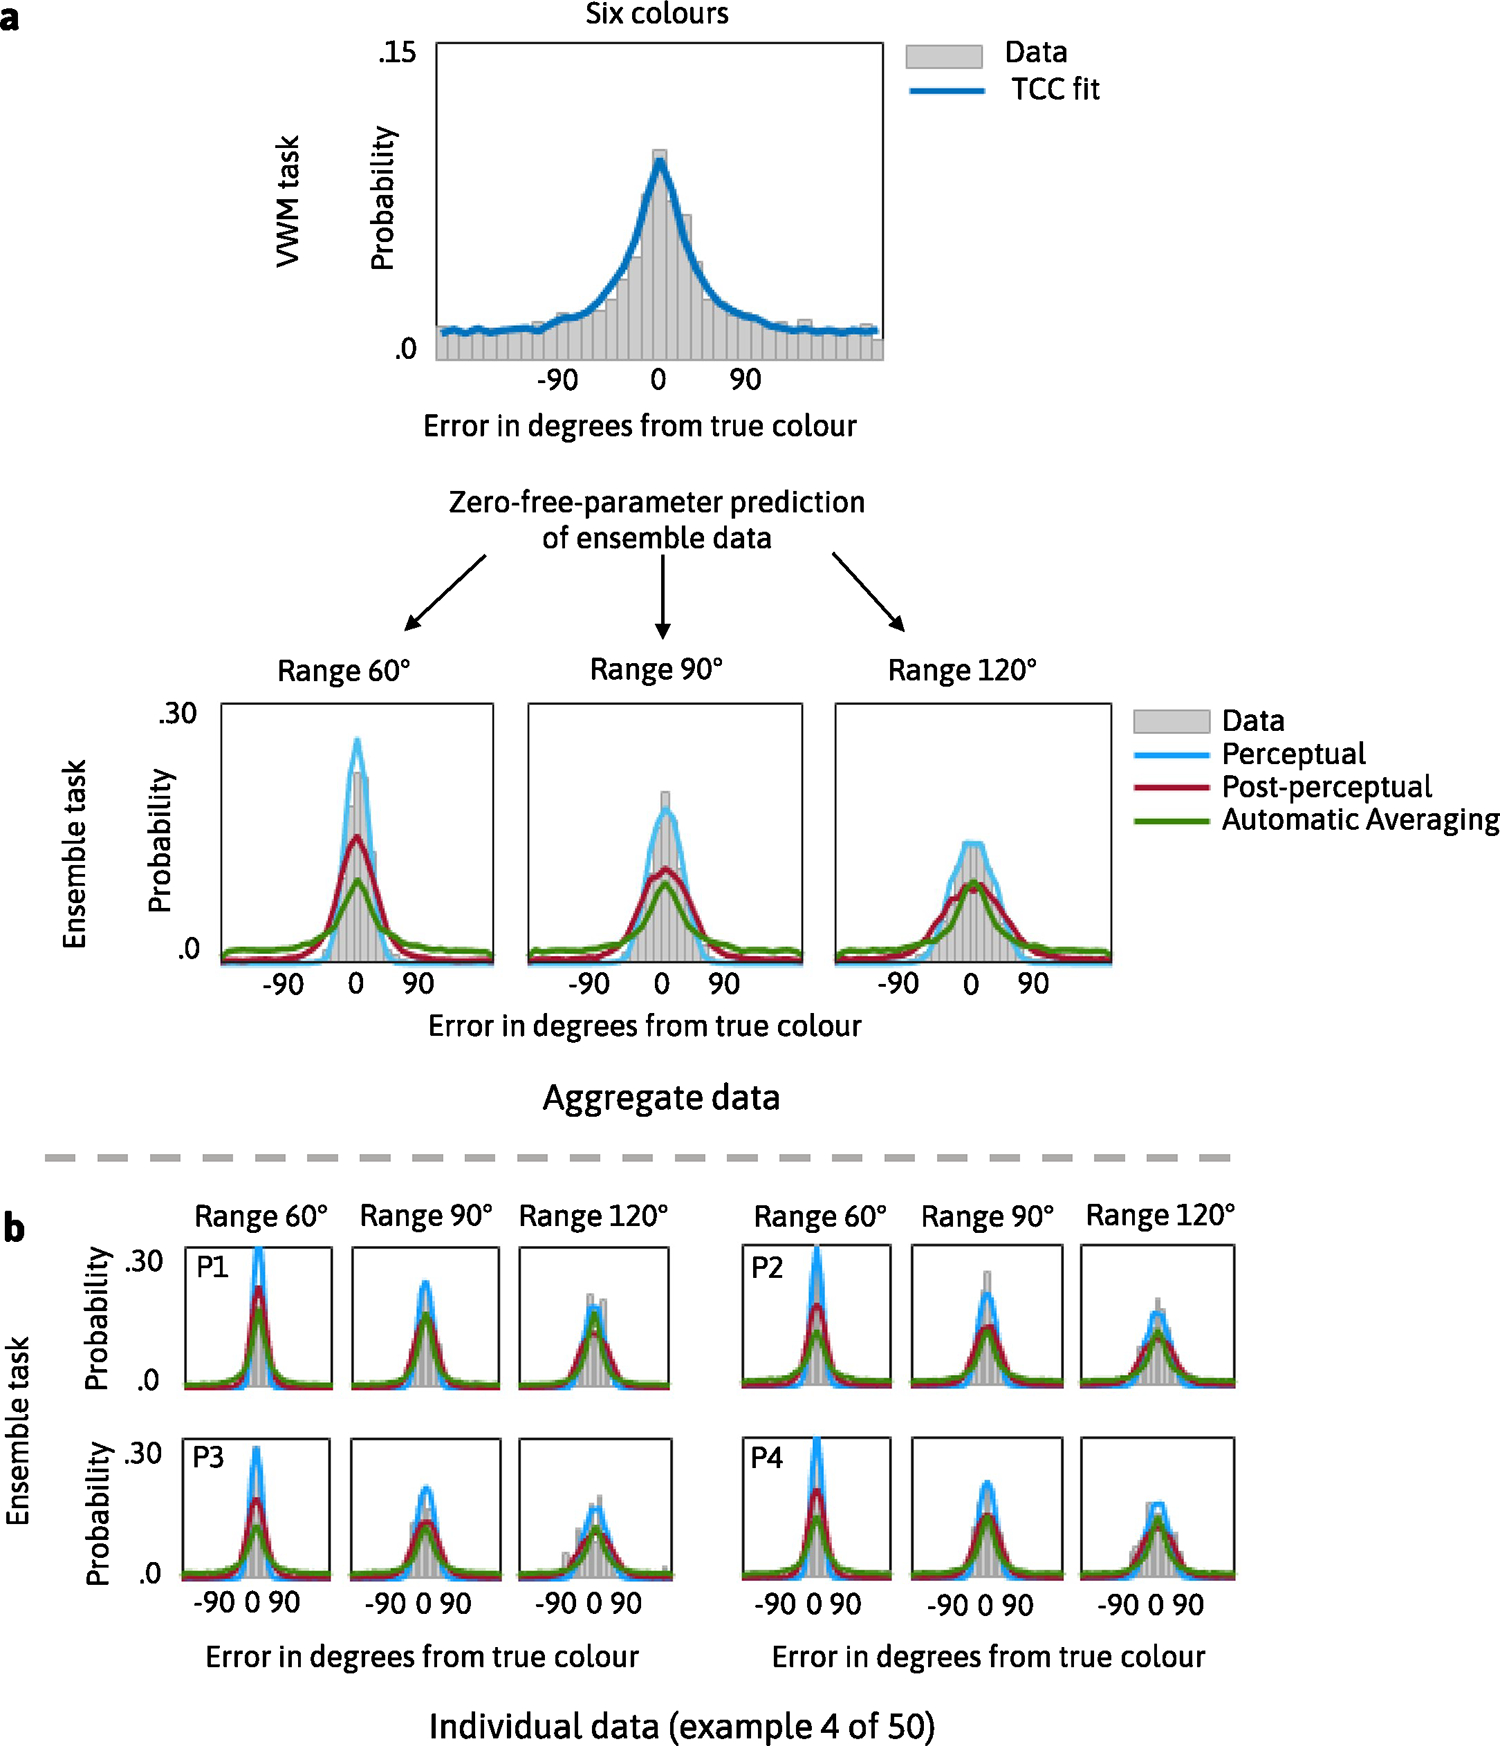
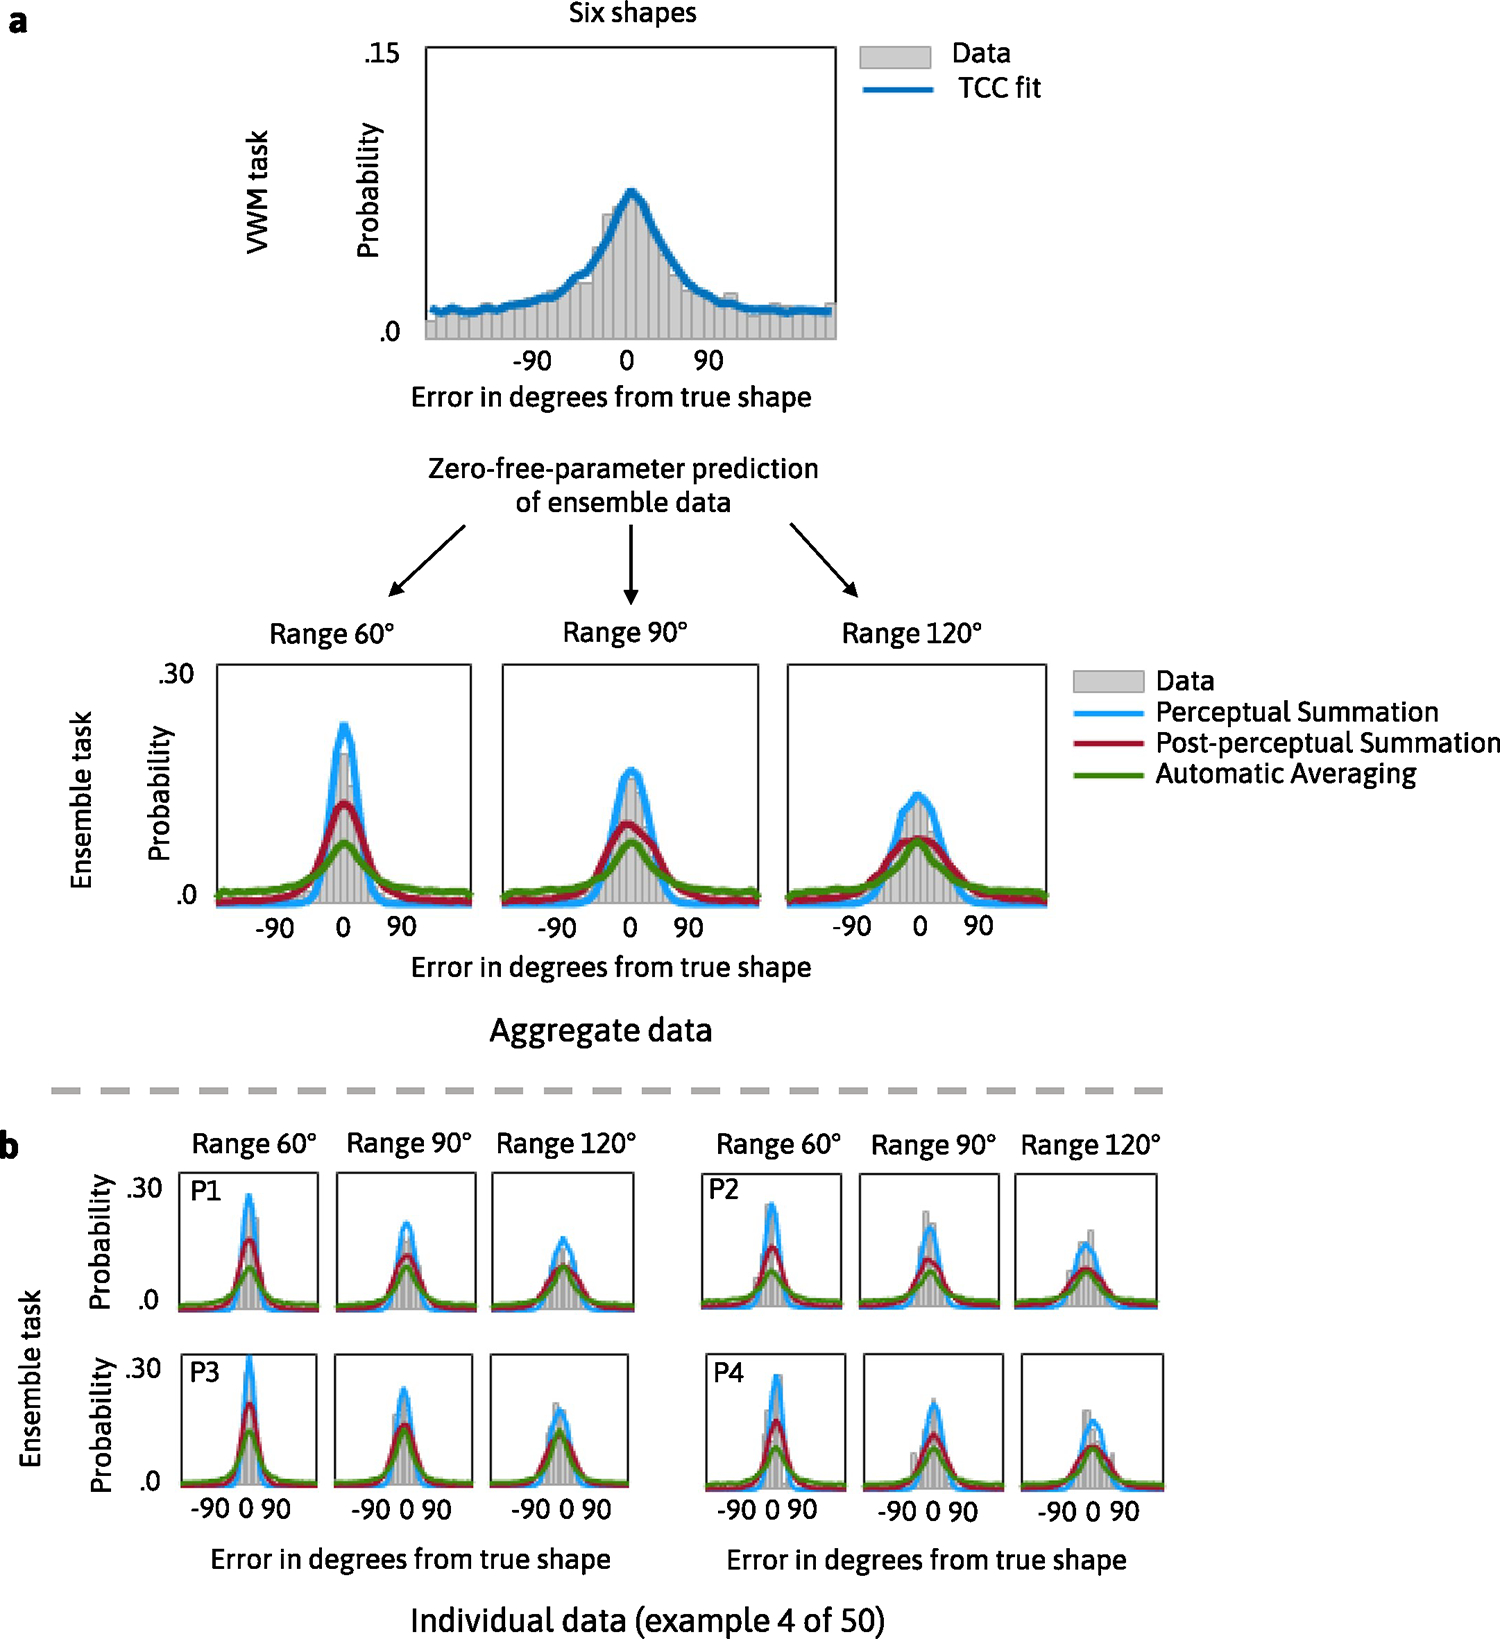
Fig. 7 |. The Perceptual Summation model predicts ensemble memory for colour with set size manipulation.
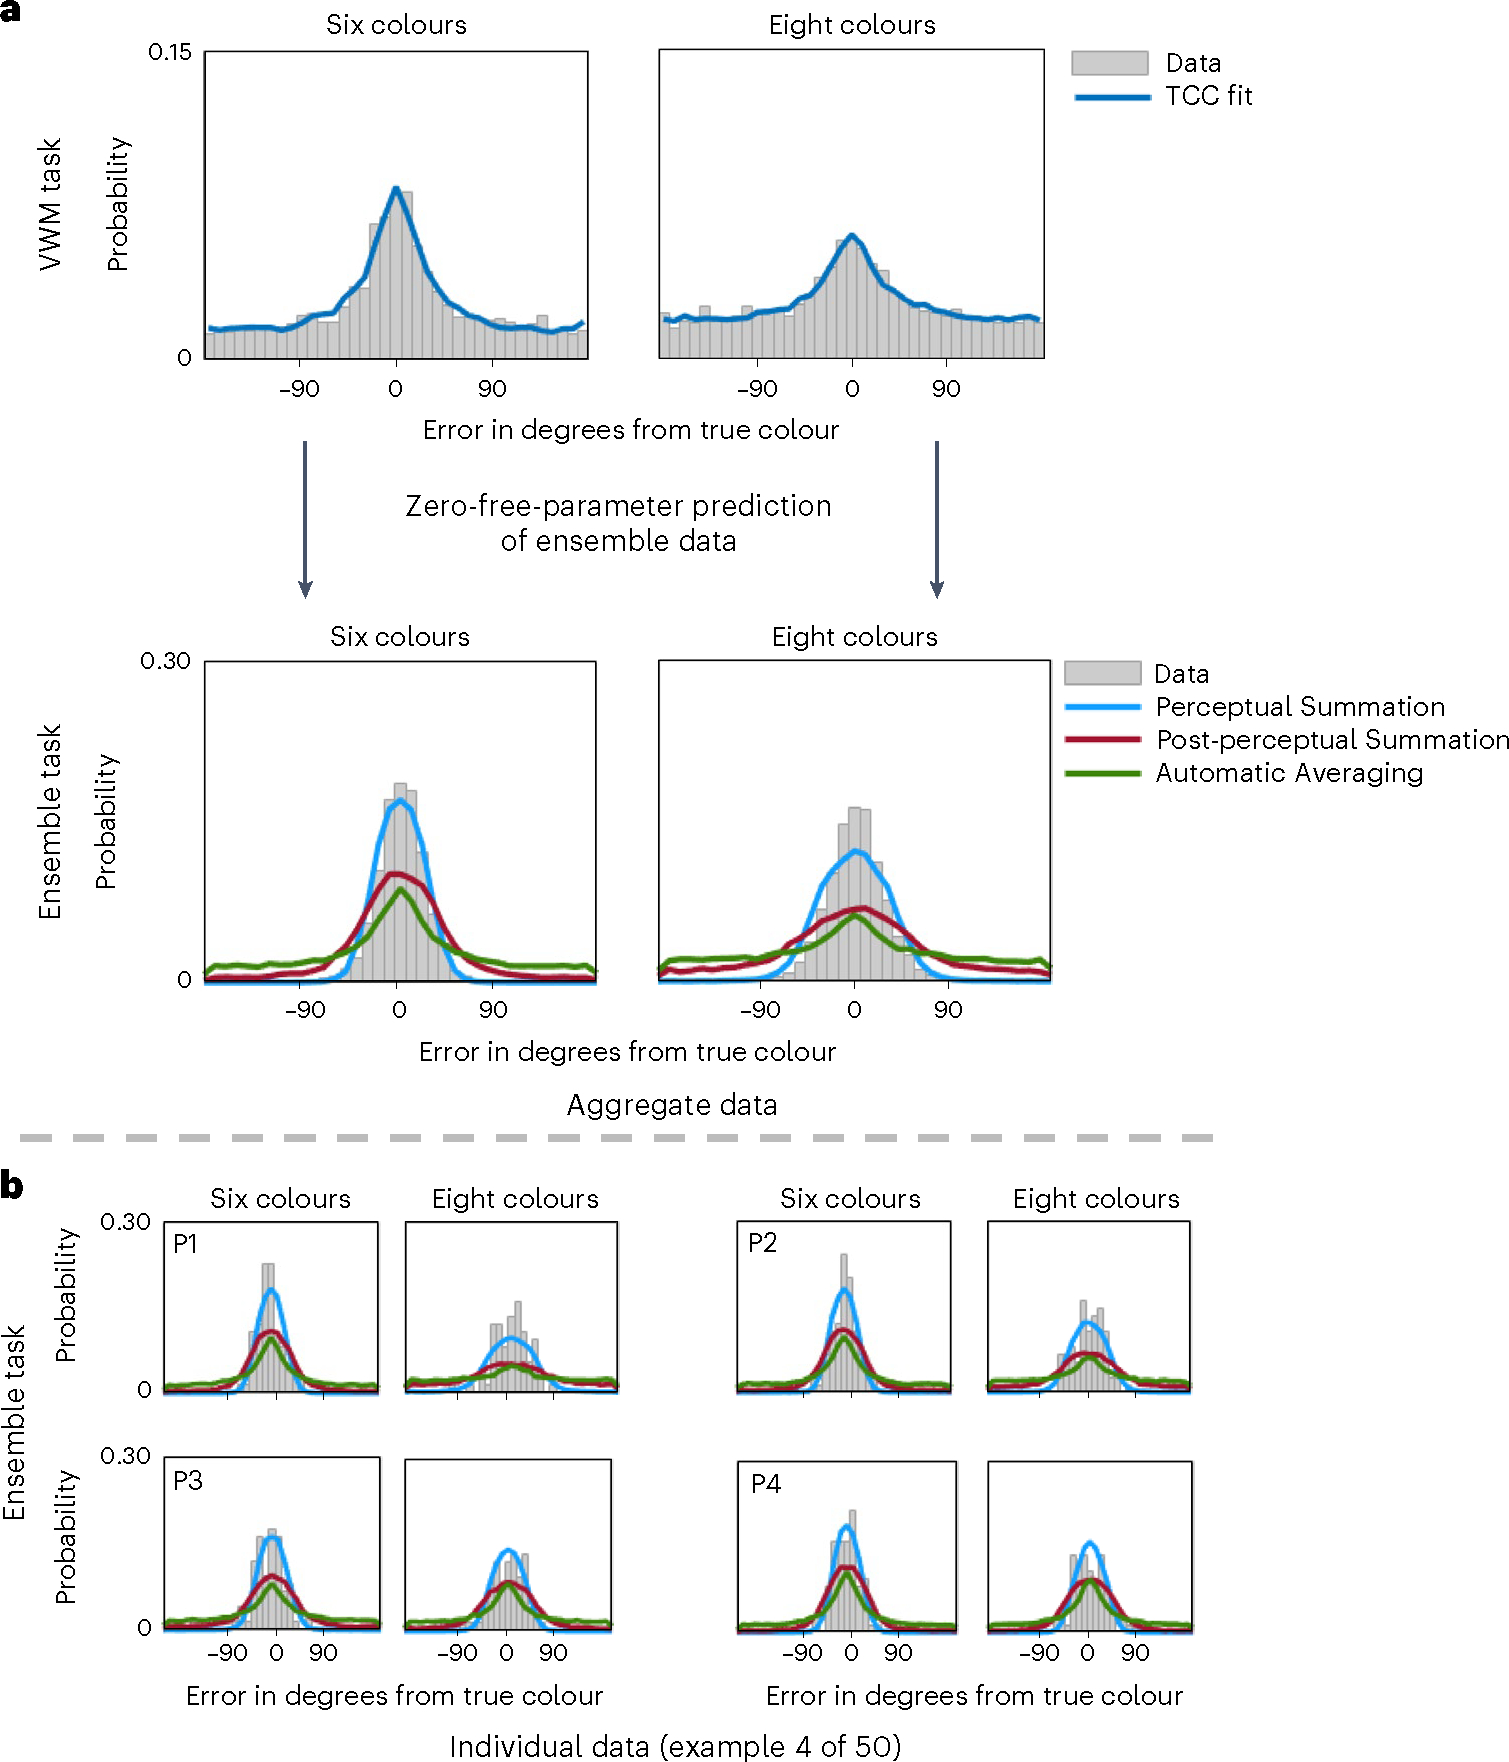
a,b, Graphical representations of the TCC models’ fit and prediction of the data in Experiment 1. In this experiment, the participants had to remember the colours of simultaneously presented circles, and the number of colours was manipulated in the working memory and ensemble tasks. Panel a shows the fits of the TCC model for individual items to aggregate data from the visual working memory task for six and eight items. Estimates of from the visual working memory task were substituted into the TCC Perceptual Summation (blue), Post-perceptual (red) and Automatic Averaging (green) models to predict the ensemble data. Panel b shows model predictions for a few example participants (P1 through P4). We visually show the fits of the TCC model for individual items to the visual working memory data to demonstrate that it provides a reasonable fit to the data (for an extended model comparison between this model and other contending models for individual items based on fit and predictive accuracy, see Schurgin et al.35).
Ensemble memory for colour with different ranges
In Experiment 2, the participants performed a colour task, and we manipulated the range of the colours in the ensemble task—that is, how distinct they were from each other. We found that the Perceptual Summation model was the best-performing model (the PNLL of the Perceptual Summation model was statistically lower than for all alternative models; all P < 0.001). Figure 8 shows the difference in PNLL between the Perceptual Summation and competing models, along with descriptive and inferential statistics. Extended Data Fig. 1 shows the fits of the TCC models to the aggregate and individual data.
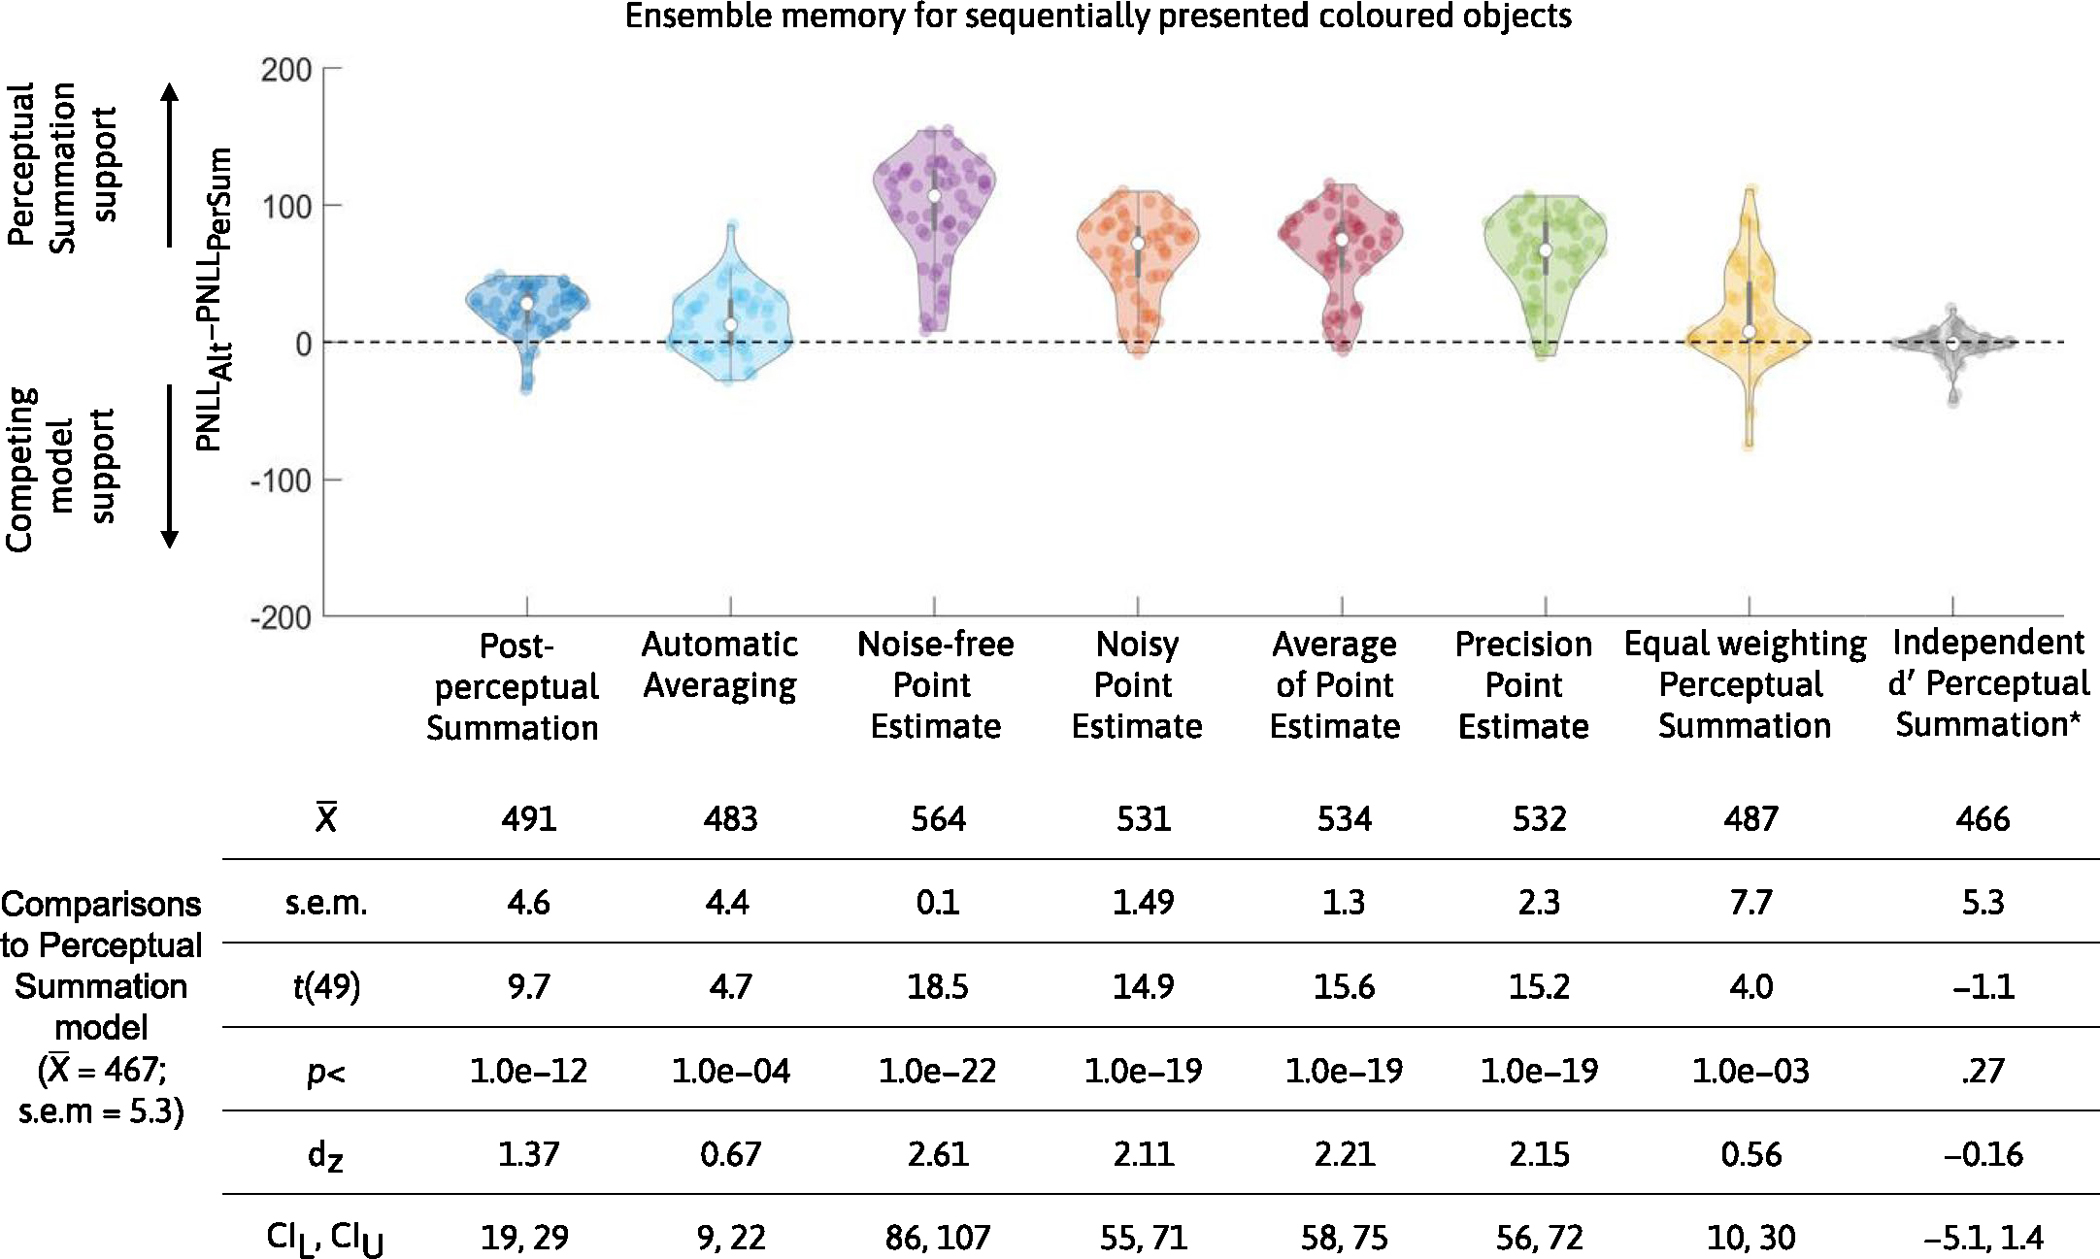
Fig. 8 |. Comparison in predictive accuracy between the Perceptual Summation model and competing models of ensemble memory for colour with colour range manipulation.
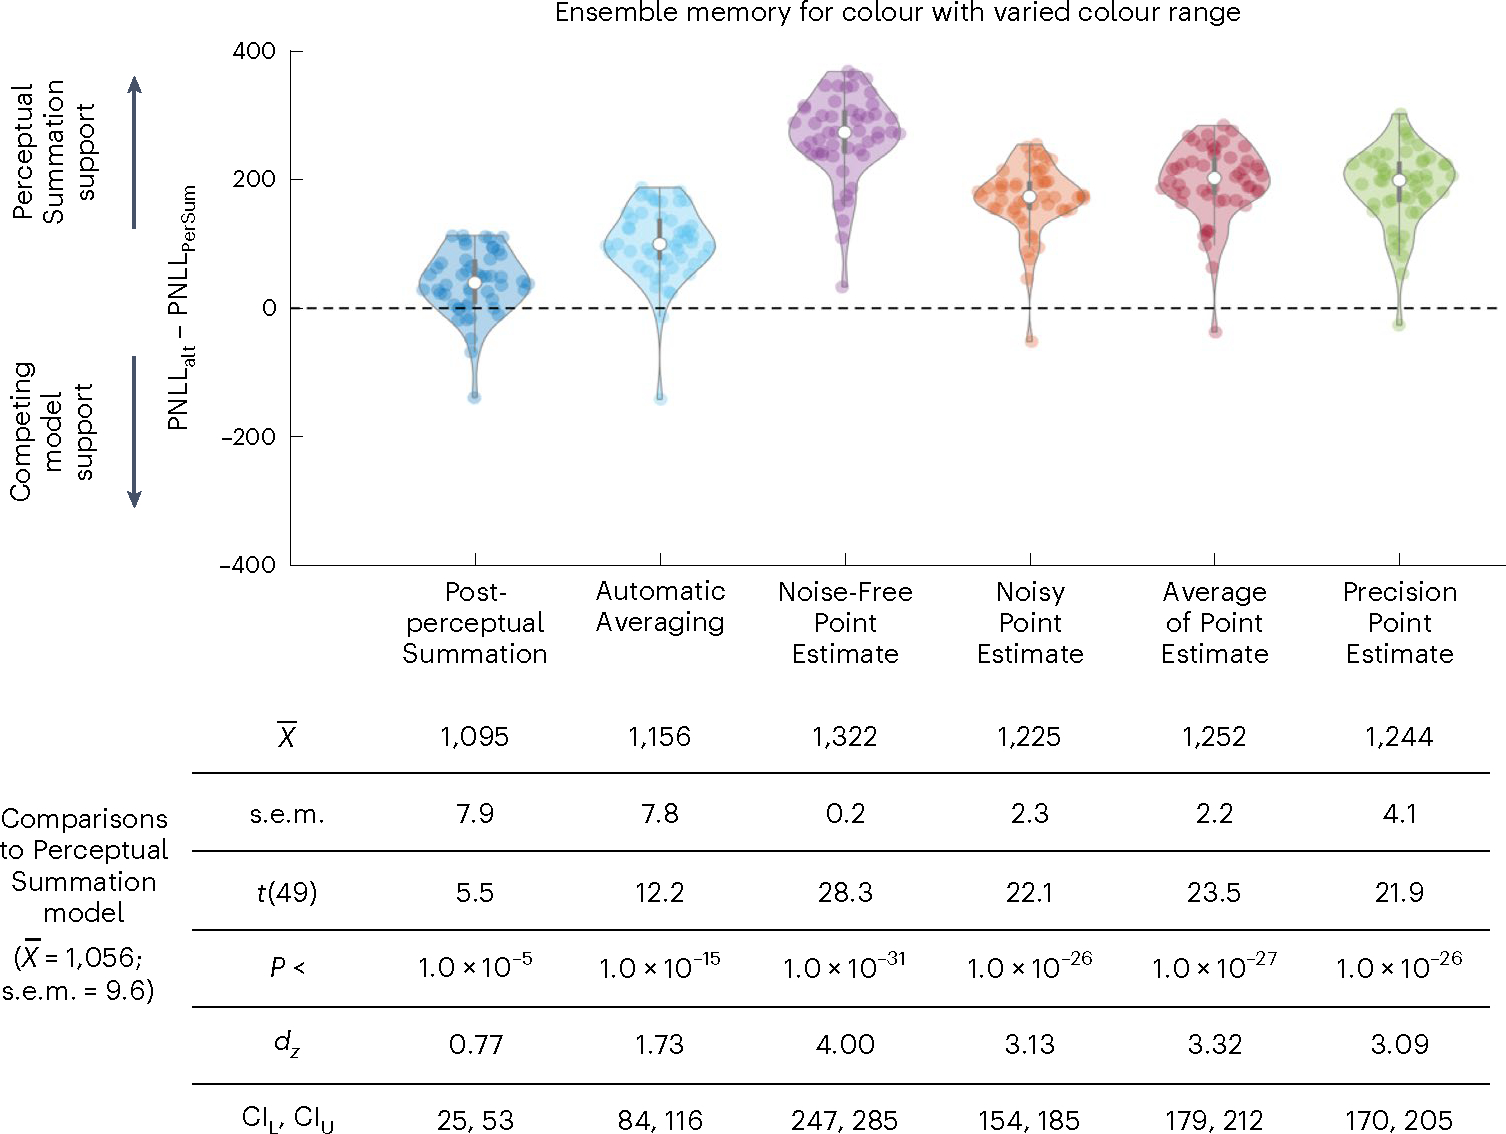
Top, violin plots based on the difference in PNLL scores between each of the six alternative competing models (PNLLalt) and the main Perceptual Summation model (PNLLPerSum) for Experiment 2 (n = 50 participants). Lower PNLL values indicate higher predictive accuracy; therefore, PNLL difference scores higher (or lower) than zero indicate support for the Perceptual Summation (or a competing) model. In both experiments, the vast majority of participants were better predicted by the Perceptual Summation model than by any of the alternatives. Bottom, descriptive and inferential statistics from all comparisons in Experiment 2, including the mean and standard error of the mean across participants. The PNLL values were compared with a paired two-tailed t-test, corrected for multiple comparisons, and all P values were statistically significant (P < 0.001).
Ensemble memory for shapes with different set sizes
In Experiment 3, we manipulated set size and had the participants remember shapes instead of colours. We found that the Perceptual Summation model was the best-performing model (the PNLL of the Perceptual Summation model was statistically lower than for all alternative models; all P < 0.001). Extended Data Fig. 2 shows the difference in PNLL between the Perceptual Summation and competing models, as well as fit statistics. Extended Data Fig. 3 shows the fits of the TCC models to the aggregate and individual data.
Ensemble memory for shapes with different ranges
In Experiment 4, we manipulated the range of shapes in the ensemble task. We found that the Perceptual Summation model was the best-performing model (the PNLL of the Perceptual Summation model was statistically lower than for all alternative models; all P < 0.001). Extended Data Fig. 4 shows the difference in PNLL between the Perceptual Summation and competing models, along with descriptive and inferential statistics. Extended Data Fig. 5 shows the fits of the TCC models to the aggregate and individual data.
Ensemble memory for sequentially presented stimuli
In Experiment 5, we presented stimuli sequentially, introducing variation in the strength of the items. We found that the Recency Perceptual Summation model was the best-performing model (the PNLL of the Perceptual Summation model was statistically lower than for each of the competing models; all P < 0.001). As expected, this model performed comparably to a model where we measured a separate for each item in the sequence. Extended Data Fig. 6 shows the difference in PNLL and statistical comparisons. Extended Data Fig. 7 shows the fits of the TCC models to the aggregate and individual data.
Discussion
Across five experiments, we found support for a Perceptual Summation ensemble model that postulates that ensemble representations are a sum of activations elicited by individual items in the memory array, which are pooled at a relatively early encoding stage of processing. We used the TCC framework to formally link a working memory model for individual items with this ensemble model. The Perceptual Summation model yields zero-free-parameter predictions of the full distribution of errors in ensemble tasks, using parameters obtained from a matched visual working memory task for individual items. It is a general process model of ensembles, developed on the basis of an existing theory of memory for individual items to make predictions for any ensemble task. Our modelling demonstrates that it can make predictions for ensemble tasks that use different stimuli spaces and presentation formats. In the Supplementary Information, we report simulations that demonstrate how the model can be extended to other tasks.
We compared our Perceptual Summation model of ensembles to a suite of contending models to adjudicate between competing hypotheses regarding how ensembles are extracted. The first critical comparison is between the Perceptual and Post-perceptual Summation models, which provides insight into the time course of ensemble extraction. The Perceptual Summation model entails that people pool over individual item representations relatively early at the perceptual/encoding stage of ensemble extraction. In contrast, the Post-perceptual Summation model entails that people pool at a later processing stage, after individual items are encoded and consolidated in working memory28. We found that the Perceptual Summation model outperformed the Post-perceptual Summation model, indicating that ensemble processing in these settings is more akin to a perceptual process rather than a complex deliberate process, in which people calculate a pooled representation using individual memory representations when their ensemble memory is probed.
Second, we found that the Perceptual Summation model outperformed the Automatic Averaging model. The Automatic Averaging model aligns with prior proposals6 that people extract an average without maintaining representations of individual items; it serves as a logical foil to the Perceptual and Post-perceptual Summation models, which both predict that ensembles are constructed from representations of individual items. Across all studies, we found that the Perceptual Summation model outperformed the Automatic Averaging model, suggesting that people use representations of individual items to extract ensembles rather than automatically extracting an average.
We also compared the Perceptual Summation model with four non-TCC models, which elucidates how to characterize ensemble representations. We found that the fully probabilistic TCC models outperform point estimate and partial distribution models. We clarify here that when we refer to representations as ‘probabilistic’ we do not assume that they must conform to classic probability axioms64. Rather, we assume that memory representations preserve uncertainty information for the full distribution of feature values and that performance in memory tasks reflects a readout of these uncertainties over feature values. These results are broadly consistent with neural population coding models of memory, according to which memory representations are grounded in distributed neural patterns of activation across feature values53,65,66.
We conclude this section by noting that, like in all model comparisons, our inferences are qualified by the set of models we consider. For instance, we do not make the strong claim that there are no alternative Automatic Averaging or Point Estimate models that could provide a better account of the data in principle. Our goal was to develop a broad range of alternative models within and outside of the TCC framework, with varying assumptions, and implement them as fairly to each theoretical position as possible. In the Supplementary Information, we discuss how our model connects to and differs from existing models of ensemble processing. We anticipate that future modelling work may provide a new suite of alternatives. We believe it is critical that such work focuses on developing models that can account for performance across a range of ensemble tasks, have the potential to generalize across task structures, and make high-precision predictions of performance.
The Perceptual Summation model has relevance for theories of gist memory. Gist memory is broadly defined as memory for ‘generalities’ across multiple items, as opposed to memory for individual items, and, as such, both gist and ensemble processes involve abstracting regularities from multiple items24,67. Our model of ensembles cannot speak to how memory for gist and memory for individual items interact during short-term or long-term memory retrieval. However, it provides a candidate explanation for how gist memory representations are computed. According to this model, the bottleneck during the encoding of individual items is the same across visual working memory tasks for individual items and the extraction of a pooled representation. Furthermore, the model proposes that memory-based noise accrues in the same way regardless of whether people are instructed to remember a single item or an ensemble. Critically, it postulates that representations are pooled at a relatively early processing stage, prior to post-perceptual noise accrual. Altogether, the Perceptual Summation model provides a parsimonious and precise account of how gist representations may arise from representations of individual items, while still being more robust than representations of individual items.
This model also provides an unambiguous account of how the processing of individual items differs from the processing of gist68. That is, instead of using theoretically underspecified constructs69 (such as focused versus diffuse attention30,70 or preattentive and attentive modes of processing71,72), it describes how different computations over the same representations can give rise to distinct types of memories. We believe that such an approach has great promise for building precise and testable models of gist memory, hierarchical representations and reconstructive memory processes in the visual domain.
We conclude by discussing a few potential limitations and venues for future research. In the current modelling approach, we use a single parameter, , to measure a potentially diverse set of processes. In line with standard signal detection models, quantifies the signal-to-noise ratio of each memory representation, and different processes at encoding, maintenance and retrieval are built into this measure. However, signal-detection-based accounts are fully compatible with the view that processes and memory representations are multidimensional41. Our measure of memory with simply captures how people combine multidimensional processes and memory representations into a single decision variable, which they use to make memory judgements when their memory is probed73. Naturally, this measure can be complemented with other modelling frameworks that unpack these processes. We elaborate and clarify related aspects of signal detection theory, TCC and our generalization approach in the Supplementary Information.
Another limitation is that we did not model all possible phenomena in the ensemble literature. This is because our goal was to formally establish a link between two different processing models, and, to this end, we focused on a set of mainstream ensemble tasks where the patterns of effects are robust. In the Supplementary Information, we report simulations to demonstrate that our model can, in principle, capture both outlier discounting and increased weighting of outliers. We also report simulations to show how the model accounts for differential effects of set size on the fidelity of ensemble representations and for the effects of various distributions of stimuli in the ensemble array. Our overall aim is to lay out a theoretical and methodological framework for future modelling research of ensemble and gist memory.
Methods
The study was completed online through the university’s SONA system and approved by the Institutional Review Board (IRB approval code: 151663; expiration 1 January 2023). All participants were at least 18 years old, provided informed consent and reported normal or corrected-to-normal vision. The participants were from the University of California, San Diego, community and participated in exchange for course credit. The participants were blind to the hypotheses of the study. In each experiment, we collected data until our final sample size was n = 50, which affords 99% power for a medium effect size (dz = 0.5) for a paired t-test at α = 0.05. We did not analyse the data of participants who failed to complete the study. We also excluded data from participants if their estimates in any of the visual working memory task conditions (and for the last item in the sequential presentation task) were more than 1.5 standard deviations below the group mean. All data and code are available in the Open Science Framework repository (osf.io/mt29p/).
Experiment 1: memory for colour with manipulation of set size
The participants completed a block of a visual working memory task and an ensemble task (the order of blocks was randomized across participants). At the beginning of every trial in both the visual working memory and ensemble tasks, the participants were shown a written prompt with the current trial number and the total number of trials in that block (1,000 ms). After the prompt offset, the participants were shown a fixation cross in the centre of the screen and six placeholders (1,000 ms). Next, the participants were briefly presented with the memory array (350 ms). We manipulated memory load (randomly across trials) in the visual working memory and ensemble tasks; thus, the participants were instructed to remember six (50% of trials) or eight items in both tasks. The colour of each circle was randomly sampled from the CIELAB colour space of Schurgin et al.35 with the constraint that each colour had to be at least 30° away from the other colours in the array. In the ensemble block, the memory array also consisted either of six (50% of trials) or eight coloured circles. The step size between colours in the ensemble task was fixed to 15° for both set sizes. There were 150 trials in the visual working memory block and 150 trials in the ensemble block (75 trials per memory load condition in each of the tasks).
The memory array in both blocks was followed by a retention interval (900 ms) and the memory probe. In the visual working memory task, the participants were shown a black outline around one of the placeholders, which cued them to report on the colour of the circle shown in that spatial location. In the ensemble task, the participants were instructed to report on the average colour. In both tasks, the participants reported on the colour using a colour wheel.
Experiment 2: memory for colour with manipulation of range in the ensemble task
The procedure of Experiment 2 was identical to the procedure of Experiment 1 with the following exceptions. First, in both the visual working memory and ensemble memory blocks, the memory array always consisted of six coloured circles. Second, in the ensemble task, the step size between colours in each condition was constrained to be 10° (60° range condition), 15° (90° range condition) or 20° (120° range condition). There were 75 trials of the visual working memory task and 225 trials of the ensemble task (75 trials in each of the three range conditions).
Experiment 3: memory for shape with manipulation of set size
Experiment 3 was identical to Experiment 1, except that the participants were shown shapes instead of colours, and we changed the encoding time to 1,000 ms and the retention interval to 800 ms because the shape task is more difficult than the colour task. The shape stimuli were taken from Li et al.74.
Experiment 4: memory for shape with manipulation of range in the ensemble task
Experiment 4 was identical to Experiment 2, except that the participants were shown shapes instead of colours, and we changed the encoding time to 1,000 ms and the retention interval to 800 ms.
Experiment 5: memory for sequentially presented colours
The goal of Experiment 5 was to model data from a sequential instead of simultaneous presentation paradigm. Therefore, in this experiment the participants were instructed to remember the colours of coloured pictures of real-world objects43. We used pictures of real-world objects instead of uniform stimuli (for example, circles) because this allowed us to easily probe an item’s serial position in the sequential visual working memory task for individual items by showing the participants a greyscale photo of one of the objects in the sequence and probing them on that object’s colour.
As before, all participants completed a block of the visual working memory and ensemble tasks. In both tasks, the participants self-advanced each trial by mouse-clicking on a fixation cross in the centre of the screen. The mouse-click was followed by a brief delay (1,000 ms), after which they were shown a sequence of six objects, each presented one at a time in the centre of the computer screen. In both tasks, each object was presented for 600 ms and followed by a 450 ms interstimulus interval. In the visual working memory task, on each trial, each object in the sequence was unique, and the colour of each object was constrained to be at least 30° away from the colours of the remaining objects. In the ensemble task, on each trial, each object in the sequence was the same (though different objects were presented across trials), and the step size between colours was 20°. To measure the effects of recency in the ensemble task, we adapted a manipulation from prior work62. Specifically, on half of the trials, the first (or last) three objects in the sequence had colours that were counterclockwise from the mean colour, whereas the last (or first) three objects had colours that were clockwise from the mean colour in colour space.
In both tasks, the last object in the sequence was followed by a 900 ms delay. Within the delay period, the participants were shown a dynamic visual mask, which was displayed for 100 ms, 100 ms after the last object offset. The mask was used to reduce potential effects of iconic memory on recency effects in the sequential presentation design. After the retention interval, the participants were probed on their memory with a continuous report. In the visual working memory task, the participants were shown a greyscale version of one of the six objects in the sequence and instructed to adjust its colour to its colour on that trial. In the ensemble task, the participants were shown a greyscale version of the object from that trial and instructed to adjust its colour to the average colour on that trial. There were 120 trials in the visual working memory task, and each object in the sequence was probed equiprobably (on 20 trials) across the experimental block. There were 96 trials in the ensemble task, with 48 trials each in the counterclockwise and clockwise conditions.
Generating predictions from TCC ensemble models
The models were fit separately to each participant’s visual working trial-level memory data. The best-fitting parameter estimates from these fits were used to predict the same person’s data on the ensemble task. In Experiments 1–4, we fit the standard TCC model for single items to the visual working memory data. The formula for this model is given in equation (1). After obtaining a estimate from fitting models to the visual working memory data, we substituted this parameter into equations (2)–(4) of the Perceptual and Post-perceptual Summation and Automatic Averaging models to predict the ensemble data. Note that each equation includes information about the similarity gradient with respect to each item in the ensemble memory array. Therefore, for instance, in experiments where we manipulated the range of colours or shapes, the range of activations elicited by items in the memory array is captured by summing these patterns of activations in the model (if an array has items that are further apart in feature space, this will also spread out the pooled activation function of the ensemble). In Experiment 5, we fit the sequential version of the visual working memory model (equation (5)) and substituted both the and rate parameters into equations (6) and (7) to predict the ensemble data using the Recency variants of the Perceptual and Post-perceptual Summation models for ensembles, respectively. As noted, the Automatic Averaging model postulates that people extract a single representation of the mean without building it up from representations of individual items; therefore, for this model we used only a single estimate to make predictions.
Generating predictions from non-TCC ensemble models
The first alternative non-TCC ensemble model is the Noise-Free Point Estimate model, according to which people automatically extract a noise-free point estimate of the mean feature, which is corrupted by motor noise only. In other words, the Noise-Free Point Estimate model simply predicts that self-reports on the ensemble task are the true mean. This model is unlikely to perform well since it cannot capture the full distribution of errors in a delayed estimation task, but we include it because it serves as a logical reference point against which to compare the assumptions of TCC ensemble models (such as that ensemble representations are probabilistic).
To generate predictions from the Noise-Free Point Estimate model, we calculated an equally weighted average value of the ensemble (like in the Automatic Averaging model). We then added a small amount of jitter to this estimate to simulate small effects of motor noise. To simulate motor noise, we used the built-in randn function in MATLAB, which generates random samples from a standard Gaussian distribution.
The second non-TCC model is the Noisy Point Estimate model, a more plausible extension of the Noise-Free Point Estimate model. According to this model, people automatically extract a point estimate of the mean feature along with an uncertainty interval around this value. More precisely, we make the simplifying assumption that people represent a fixed uniform uncertainty interval around the true mean value64. This model provides a simple way of capturing the idea that people represent a noisy representation of the ensemble. To generate predictions from the Noisy Point Estimate model, we drew random samples of data from a uniform distribution, which had a range of 60° and was centred on the true value of the average—that is, the samples were drawn from −30° to 30° around the mean value. The assumption behind this model is that people represent a uniform uncertainty interval around the true mean value; thus, the number of samples was based on the number of trials in each ensemble condition.
So far, neither of the first two Point Estimate models formally links memory for individual items to memory for ensembles. We therefore considered two additional models, which do link processing across the working memory and ensemble tasks and make more tenable assumptions about processing on ensemble tasks. The first of these models we refer to as the Average Item Point Estimate model, according to which people compute ensembles by averaging over point estimates of individual item representations, a model closely related to the averaging view6,10,24.
The second of these models is the Precision Ensemble model, according to which people maintain a point estimate of the mean, which has a Gaussian rather than uniform uncertainty interval around it. Rather than using a fixed interval for all subjects as we did for the Noisy Point Estimate model, we calibrated this interval for each individual by obtaining a standard deviation estimate from their working memory data using the popular standard mixture model (inspired by Zhang and Luck75). Therefore, this model also inherits a fundamentally different processing assumption about memory than the TCC ensemble models, which is that there are true ‘guessing states’ in memory, such that there is no evidence that can be used to report on memory. To generate predictions for the Average Item Point Estimate model, we used people’s working memory data to sample n point estimates (measured in degrees of error) for each item in the array and then averaged across these estimates. For instance, if people had to remember six items on the visual working memory and ensemble tasks, we drew (with replacement) six samples of their self-report data (converted to error in degrees) on the visual working memory task and averaged across these. This was repeated for each trial to generate the predicted distribution of errors on the ensemble task.
To summarize, neither the Noise-Free Point Estimate nor the Item Average Point Estimate model postulates probabilistic representations. The Noisy Point Estimate and Precision Ensemble models postulate partially probabilistic representations because there is an uncertainty interval around the mean, but not a full probability distribution over feature values64. Note that we do not presume that these point-estimate models capture all possible ways in which point-estimate or partially probabilistic models could account for the data. However, in the absence of other quantitative models in the literature that can apply to such ensemble perception tasks, we created models that spanned a wide range of plausible assumptions regarding the nature of ensemble extraction and the properties of ensemble representations. We also address this point in the Discussion.
The Precision Ensemble model was implemented by fitting a standard mixture model75 to each individual’s visual working memory data and using the standard deviation estimate from this model to compute an uncertainty interval around the true average. The latter was implemented by sampling random samples of data (based on the number of trials in the ensemble task), from a normal distribution with mean zero and the standard deviation set to the standard deviation (inverse of precision) estimate from the mixture model.
Recency TCC ensemble models
The Recency TCC model quantifies recency weights using an exponential function (without base ) over the serial position of each stimulus in the sequence. The recency model for individual items is given by the following equation:
| (5) |
where all terms are identical to those given in equation (1), except a second parameter, rate, which has the item position of item in the exponent (where is the most recent item in the sequence). The rate parameter is a free parameter bounded between 0 and 1 that captures the effects of memory decay on memory, with smaller values (of the parameter) indicating stronger decay effects and therefore relatively higher weighting of more recent items in the ensemble (and relatively better performance for them in the visual working memory task). The equations for the Perceptual and Post-perceptual Summation ensemble models are extended in a similar way, as shown below (equations (6) and (7), respectively):
| (6) |
| (7) |
Note that the Automatic Averaging model is unchanged because it postulates that people automatically extract a single representation of the mean without building up this representation from individual items. We treat this model as being conceptually equivalent to a prototype model that entails an equally weighted average76.
Model fitting
All models were fit to visual working memory trial-level data (that is, the full distribution of memory errors on each trial) in MATLAB 2021b using maximum likelihood estimation by minimizing the negative log likelihood. Minimization was implemented with the fmincon algorithm in the Optimization Toolbox as well as basic iterative search. The predictive accuracy of each model was measured using the PNLL. For the main analyses, we substituted the best-fitting parameters from the visual working memory task into equations for each of the ensemble models to predict the data on the ensemble task, and we calculated the PNLL using data from the ensemble task conditions.
Psychophysical similarity function and perceptual noise
The psychophysical similarity functions in our colour experiments were estimated in prior work using a Likert task and verified using a ‘triad’ task, a mainstream method for obtaining psychophysically scaled similarity data35. Perceptual noise was measured with a perceptual matching task, also a mainstream task for quantifying perceptual confusability of visual stimuli. In this task, the participants were shown a colour and asked to match it to one of 60 colours (6° apart) presented simultaneously on the computer screen. This task provides insight into how perceptual noise affects the perceptual confusability of stimuli. These perceptual matching data were converted to a covariance matrix, which was convolved with the psychophysical similarity function35. We note that the resulting psychophysical similarity signal detection model is a simulation-based approximation of a correlated noise signal detection model77.
The same tasks were applied to the shape data. The shape wheel was created and validated as a circular space in prior work74. We collected Likert similarity data and perceptual confusion data for this wheel using the same methods as used for the colour data.
Extended Data
Extended Data Fig. 1 |. The Perceptual Summation model predicts ensemble memory for color with a range manipulation.
Graphical representation of TCC models’ fit and prediction of data in Experiment 2. In this experiment participants had to remember colors of simultaneously presented circles, and the range of colors was manipulated in the ensemble task. The top row of panel A shows the fits of the TCC model for individual items to aggregate data from the visual working memory task for six items. The bottom row of panel A shows results from the predictive analysis in which d’ estimates from the visual working memory task were substituted into the TCC Perceptual Summation (blue), Post-perceptual (red) and Automatic Averaging (green) models to predict the ensemble data. The bottom panel (B) shows model predictions for a few example participants. Schurgin et al.35).
Extended Data Fig. 2 |. Comparison in predictive accuracy between Perceptual Summation model and competing models of ensemble memory for shape with the set size manipulation.
The top panel shows violin plots for the difference in predicted negative log likelihood scores between each of the six alternative competing models (PNLLAlt) and the main Perceptual Summation model (PNLLPerSum) for Experiment 3 (n = 50 participants). Lower values of PNLL indicate higher predictive accuracy, therefore, PNLL difference scores higher (or lower) than zero indicate support for the Perceptual Summation (or a competing) model. In both experiments, the vast majority of participants are better predicted by the Perceptual Summation model than any of the alternatives. The bottom panel shows a table with a summary of descriptive and inferential statistics from all comparisons in Experiment 3, including the mean and standard error of the mean across participants. PNLL values were compared with a paired two-tailed t-test, corrected for multiple comparisons and all p-values were statistically significant (p < 0.001).
Extended Data Fig. 3 |. The Perceptual Summation model predicts ensemble memory for shape with a set size manipulation.
Graphical representation of the TCC models’ fit and prediction of data in Experiment 3. In this experiment participants had to remember different shapes, and the number of shapes was manipulated in the working memory and ensemble task. The top row of panel A shows the fits of the TCC model for individual items to aggregate data from the visual working memory task for six items and the second row of panel A shows results from the predictive analysis in which d’ estimates from the visual working memory task were substituted into the TCC Perceptual Summation (blue), Post-perceptual (red) and Automatic Averaging (green) models to predict the ensemble data. Panel B shows data and model predictions for a few example participants.
Extended Data Fig. 4 |. Comparison in predictive accuracy between Perceptual Summation model and competing models of ensemble memory for shape with the range manipulation.
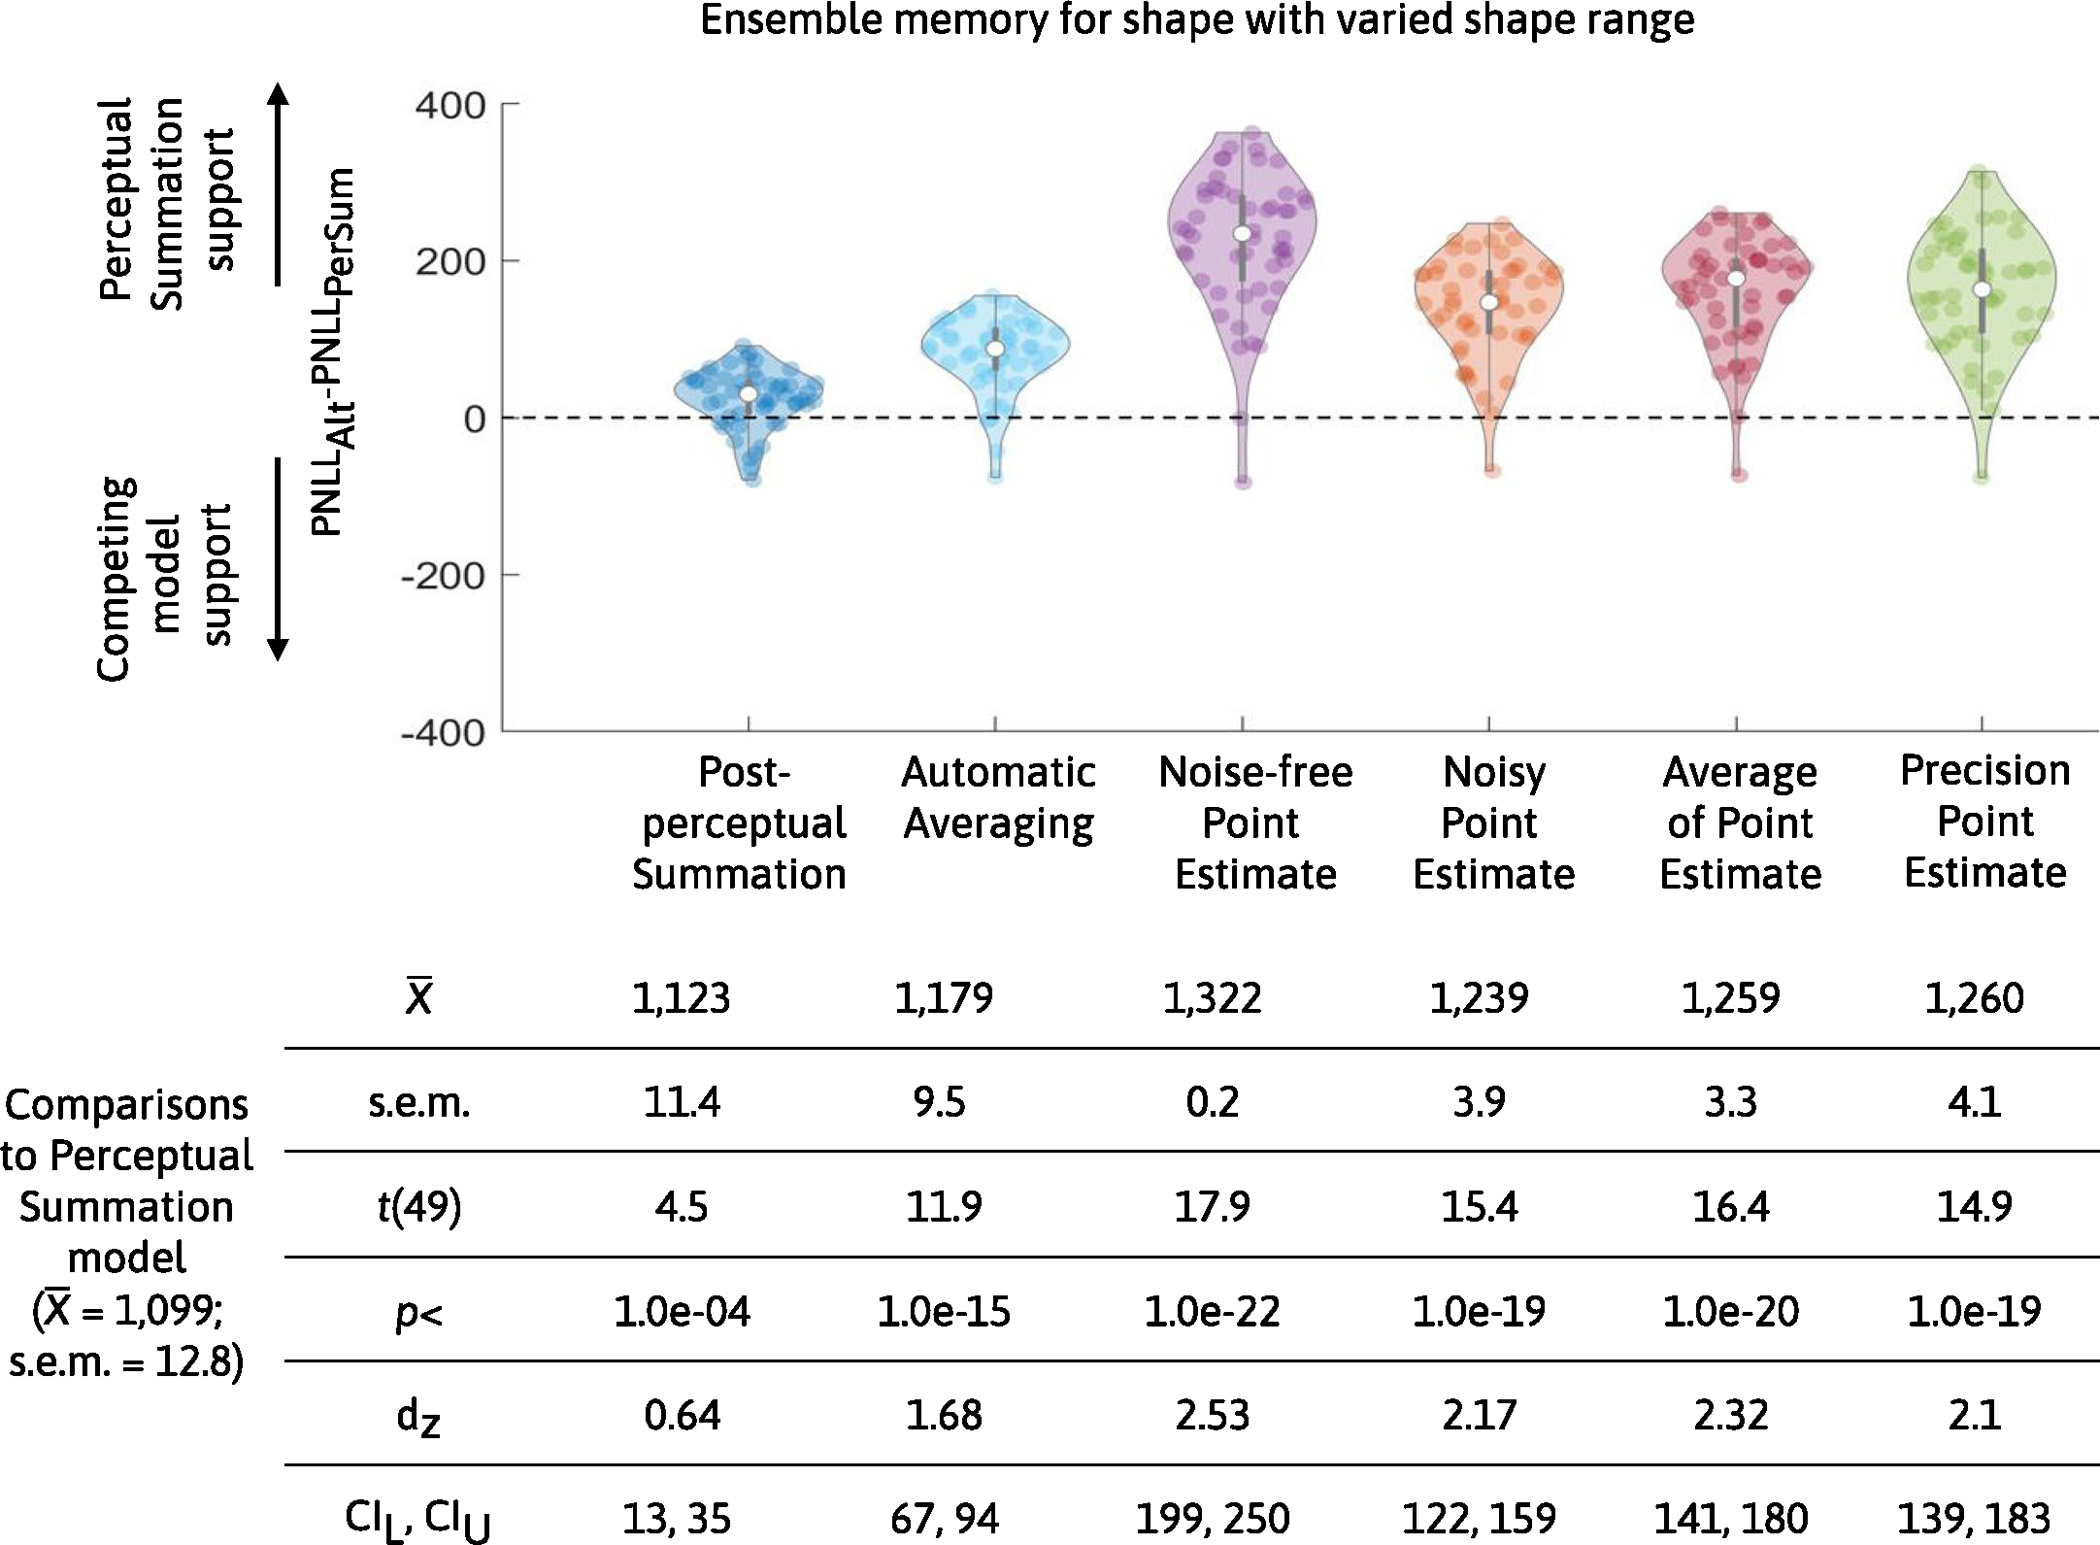
The top panel shows violin plots with the difference in predicted negative log likelihood scores between each of the six alternative competing models (PNLLAlt) and the main Perceptual Summation model (PNLLPerSum) for Experiment 4 (n = 50 participants). Lower values of PNLL indicate higher predictive accuracy, therefore, PNLL difference scores higher (or lower) than zero indicate support for the Perceptual Summation (or a competing) model. In both experiments, the vast majority of participants are better predicted by the Perceptual Summation model than any of the alternatives. The bottom panel shows a table with a summary of descriptive and inferential statistics from all comparisons in Experiment 4, including the mean and standard error of the mean across participants. PNLL values were compared with a paired two-tailed t-test, corrected for multiple comparisons and all p-values were statistically significant (p < 0.001).
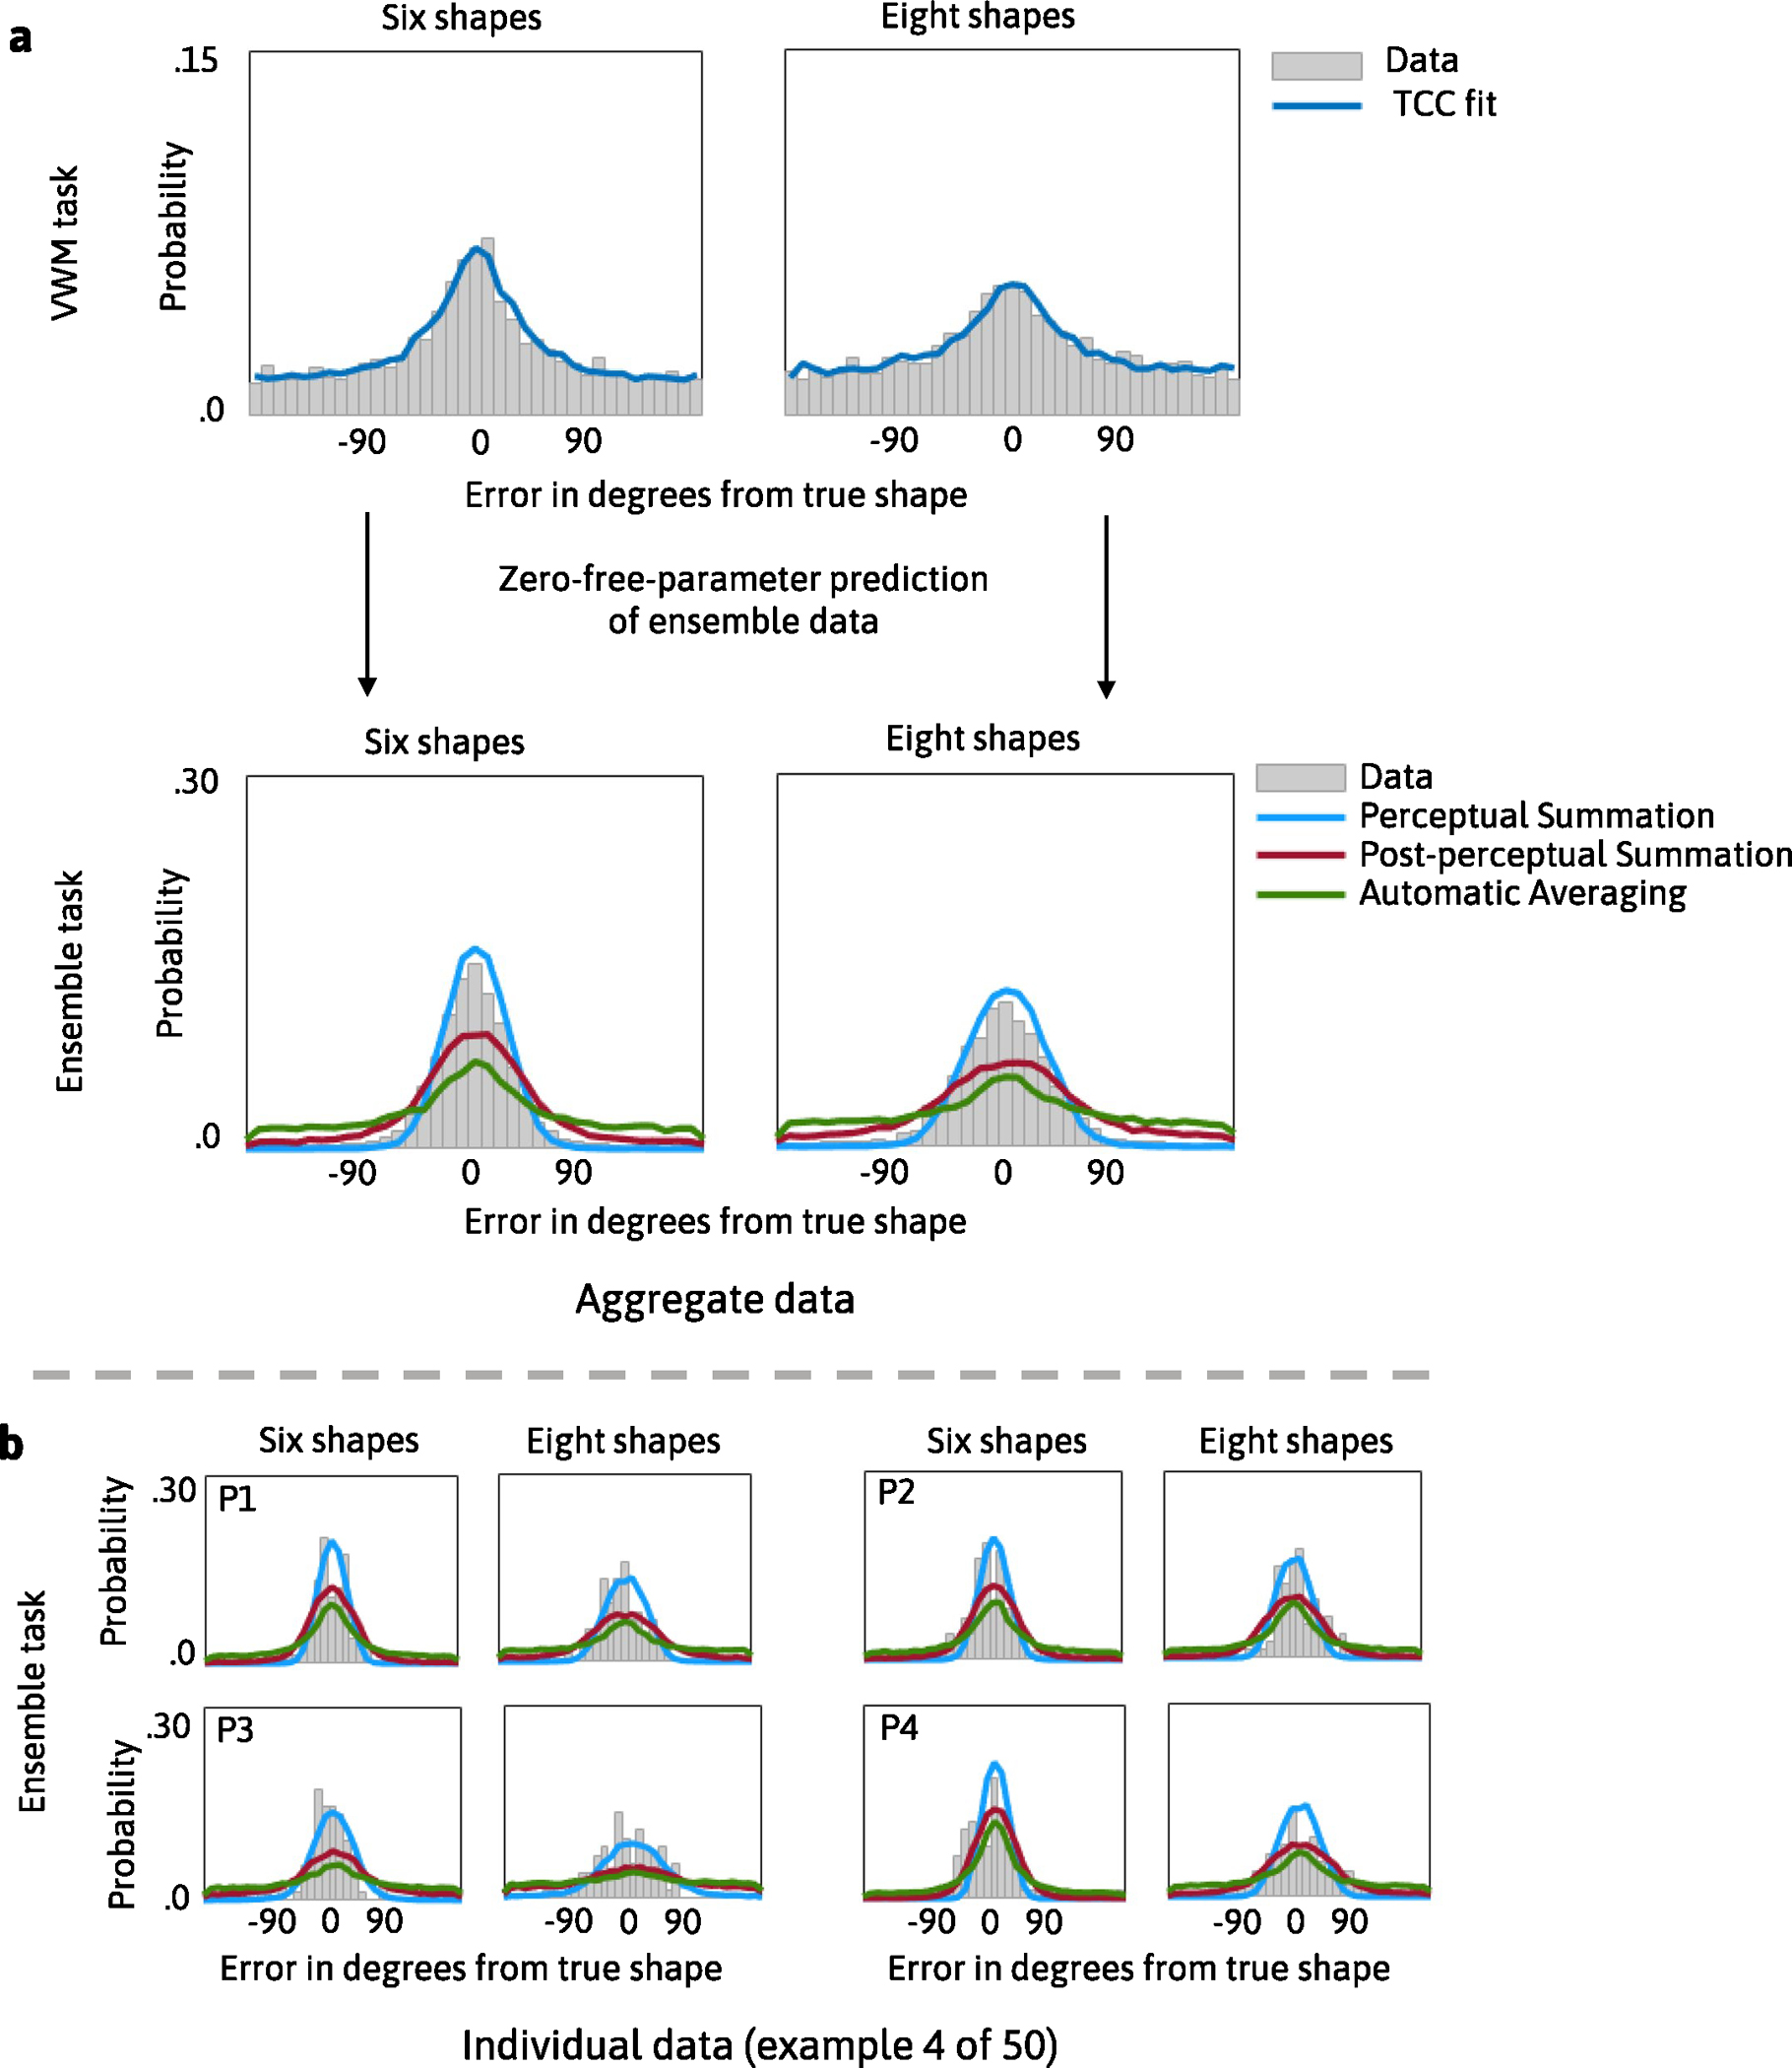
Extended Data Fig. 5 |. The Perceptual Summation model predicts ensemble memory for shape with a range manipulation.
Graphical representation of TCC model’s fit and prediction of data in Experiment 4. In this experiment participants had to remember simultaneously presented shapes, and the range of shapes was manipulated in the ensemble task. The top row of panel A shows the fits of the TCC model for individual items to aggregate data from the visual working memory task for six items, and the second row of panel A shows results from the predictive analysis in which d’ estimates from the visual working memory task were substituted into the TCC Perceptual Summation (blue), Post-perceptual (red) and Automatic Averaging (green) models to predict the ensemble data. Panel B shows data and model predictions for a few example participants.
Extended Data Fig. 6 |. Comparison in predictive accuracy between Sequential Perceptual Summation model and competing models of ensemble memory for sequentially presented stimuli.
The top panel shows violin plots of the difference in predicted negative log likelihood scores between each of the eight alternative competing models (PNLLAlt) and the main Sequential Perceptual Summation model (PNLLPerSum) (n = 50 participants). Lower values of PNLL indicate higher predictive accuracy, therefore, PNLL difference scores higher (or lower) than zero indicate support for the Sequential Perceptual Summation (or a competing) model. The vast majority of participants are better predicted by the Sequential Perceptual Summation model than any of the alternatives. Note that the baseline here is the Sequential Perceptual Summation model that relies on fitting a decay rate. The independent d’ Perceptual Summation model, the last model above, is the same model but without this parametric assumption about how d’ changes across the items in the working memory task. This independent model is instead one in which we used separate d’ estimates to quantify familiarity of items as a function of serial position, rather than a single d’ and rate parameter. This model is marked with an * because it is also a version of the Sequential Perceptual Summation model and so shows comparable predictive accuracy to the main Sequential Perceptual Summation model we use, as expected. The bottom panel shows a table with a summary of descriptive and inferential statistics from all comparisons in Experiment 5, including the mean and standard error of the mean across participants. PNLL values were compared with a paired two-tailed t-test, corrected for multiple comparisons and for all comparisons between competing models p-values were statistically significant (p < 0.001).
Extended Data Fig. 7 |. The Perceptual Summation model predicts ensemble memory for sequentially presented stimuli.
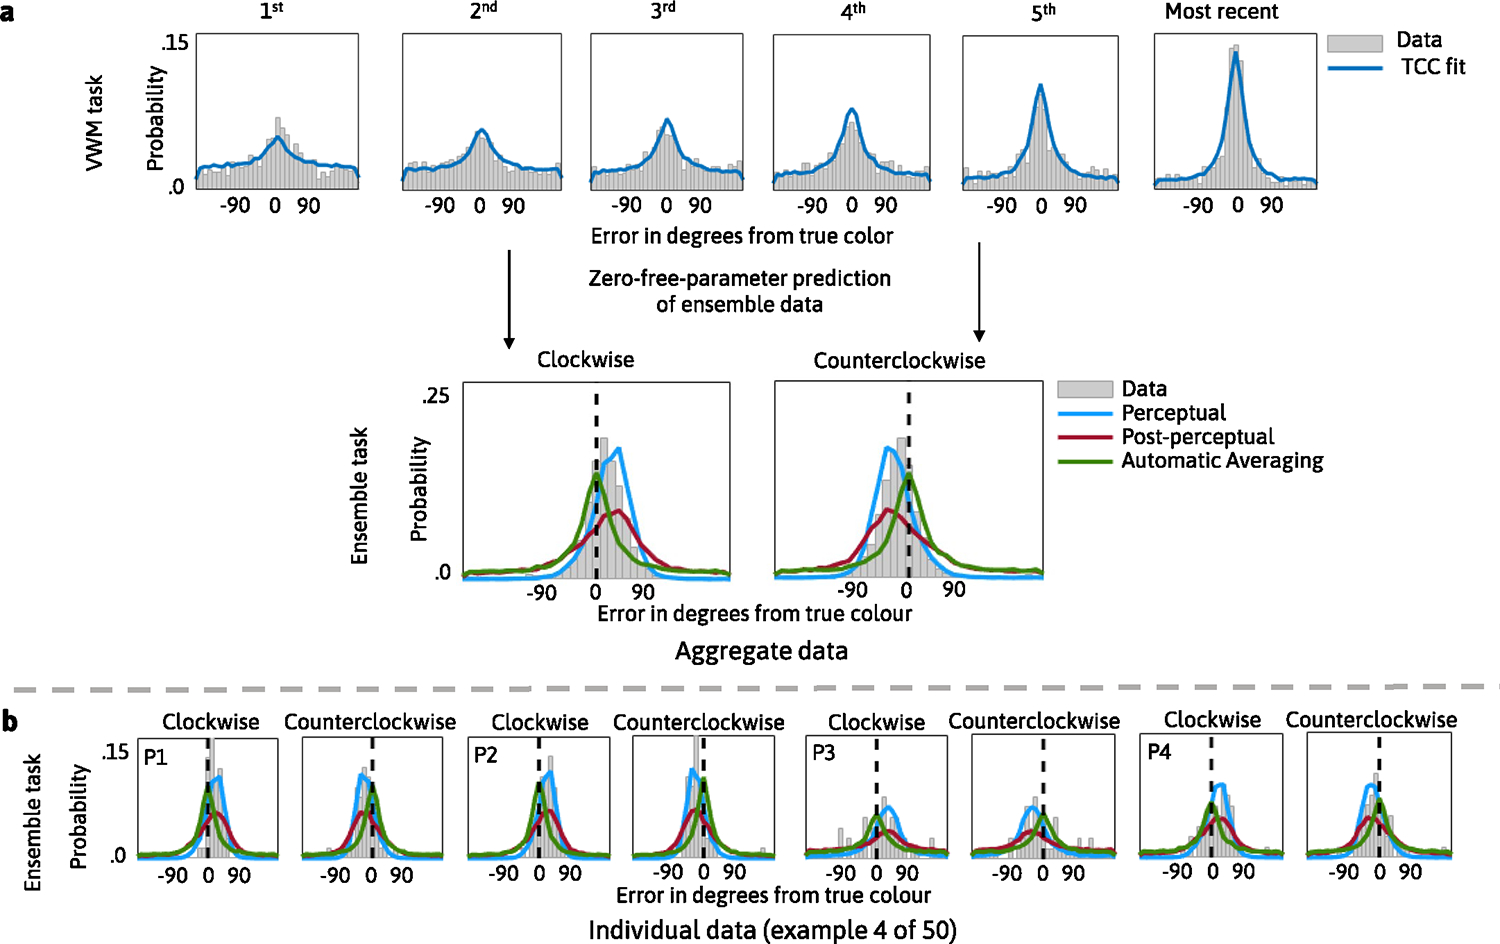
Summary of results from Experiment 5, in which participants had to remember colors of sequentially presented real-world objects. The top row of panel A shows the fits of the Sequential TCC model to individual data and the second row of panel A shows the TCC Sequential Perceptual Summation (blue), Post-perceptual (red) and Automatic Averaging (green) models’ predictions of the ensemble data in two conditions. In the clockwise (counterclockwise) condition the most recently shown items were from the clockwise (counterclockwise) direction from the mean color, producing a clockwise (counterclockwise) bias. Panel B shows data and model predictions for a few example participants.
Supplementary Material
Acknowledgements
We acknowledge funding from the National Institutes of Health (National Research Service Award Fellowship No. 1F32MH127823–01 to M.M.R.) and the National Science Foundation (grant nos. BCS-1653457 and BCS-2146988 to T.F.B.). The funders had no role in study design, data collection and analysis, decision to publish or preparation of the manuscript.
Footnotes
Competing interests
The authors declare no competing interests.
Additional information
Extended data is available for this paper at https://doi.org/10.1038/s41562-023-01602-z.
Supplementary information The online version contains supplementary material available at https://doi.org/10.1038/s41562-023-01602-z.
Peer review information Nature Human Behaviour thanks Bernhard Spitzer, Eddie Ester and the other, anonymous, reviewer(s) for their contribution to the peer review of this work.
Reprints and permissions information is available at www.nature.com/reprints.
Reporting summary
Further information on research design is available in the Nature Portfolio Reporting Summary linked to this article.
Code availability
The code is publicly available on OSF (https://osf.io/mt29p/).
Data availability
The data are publicly available at the following OSF link: https://osf.io/mt29p/.
References
- 1.Baddeley A Working memory. Science 255, 556–559 (1992). [DOI] [PubMed] [Google Scholar]
- 2.Miller GA The magical number seven, plus or minus two: some limits on our capacity for processing information. Psychol. Rev. 63, 81–97 (1956). [PubMed] [Google Scholar]
- 3.Pashler H Processing stages in overlapping tasks: evidence for a central bottleneck. J. Exp. Psychol. Hum. Percept. Perform. 10, 358–377 (1984). [DOI] [PubMed] [Google Scholar]
- 4.Simon HA Invariants of human behavior. Annu. Rev. Psychol. 41, 1–20 (1990). [DOI] [PubMed] [Google Scholar]
- 5.Kahneman D A psychological perspective on economics. Am. Econ. Rev. 93, 162–168 (2003). [Google Scholar]
- 6.Ariely D Seeing sets: representation by statistical properties. Psychol. Sci. 12, 157–162 (2001). [DOI] [PubMed] [Google Scholar]
- 7.Brady TF & Oliva A Statistical learning using real-world scenes. Psychol. Sci. 19, 678–685 (2008). [DOI] [PMC free article] [PubMed] [Google Scholar]
- 8.Goldstein MH et al. General cognitive principles for learning structure in time and space. Trends Cogn. Sci. 14, 249–258 (2010). [DOI] [PMC free article] [PubMed] [Google Scholar]
- 9.Whitney D & Yamanashi Leib A Ensemble perception. Annu. Rev. Psychol. 69, 105–129 (2018). [DOI] [PubMed] [Google Scholar]
- 10.Alvarez GA & Oliva A The representation of simple ensemble visual features outside the focus of attention. Psychol. Sci. 19, 392–398 (2008). [DOI] [PMC free article] [PubMed] [Google Scholar]
- 11.Brady TF, Shafer-Skelton A & Alvarez GA Global ensemble texture representations are critical to rapid scene perception. J. Exp. Psychol. Hum. Percept. Perform. 43, 1160–1176 (2017). [DOI] [PubMed] [Google Scholar]
- 12.Utochkin I Ensemble summary statistics as a basis for visual categorization. J. Vis. 15, 8 (2015). [DOI] [PubMed] [Google Scholar]
- 13.Balas B, Nakano L & Rosenholtz R A summary-statistic representation in peripheral vision explains visual crowding. J. Vis. 9, 13 (2009). [DOI] [PMC free article] [PubMed] [Google Scholar]
- 14.Block N Perceptual consciousness overflows cognitive access. Trends Cogn. Sci. 15, 567–575 (2011). [DOI] [PubMed] [Google Scholar]
- 15.Cohen MA, Dennett DC & Kanwisher N What is the bandwidth of perceptual experience? Trends Cogn. Sci. 20, 324–335 (2016). [DOI] [PMC free article] [PubMed] [Google Scholar]
- 16.Grahek I, Schaller M & Tackett JL Anatomy of a psychological theory: integrating construct-validation and computational-modeling methods to advance theorizing. Perspect. Psychol. Sci. 16, 803–815 (2021). [DOI] [PubMed] [Google Scholar]
- 17.Guest O & Martin AE How computational modeling can force theory building in psychological science. Perspect. Psychol. Sci. 16, 789–802 (2021). [DOI] [PubMed] [Google Scholar]
- 18.Navarro DJ If mathematical psychology did not exist we might need to invent it: a comment on theory building in psychology. Perspect. Psychol. Sci. 16, 707–716 (2021). [DOI] [PubMed] [Google Scholar]
- 19.Oberauer K & Lewandowsky S Addressing the theory crisis in psychology. Psychon. Bull. Rev. 26, 1596–1618 (2019). [DOI] [PubMed] [Google Scholar]
- 20.Busemeyer JR & Wang YM Model comparisons and model selections based on generalization criterion methodology. J. Math. Psychol. 44, 171–189 (2000). [DOI] [PubMed] [Google Scholar]
- 21.Lee MD How cognitive modeling can benefit from hierarchical Bayesian models. J. Math. Psychol. 55, 1–7 (2011). [Google Scholar]
- 22.Yarkoni T The generalizability crisis. Behav. Brain Sci. 45, e1 (2021). [DOI] [PMC free article] [PubMed] [Google Scholar]
- 23.Rust NC in The Cognitive Neurosciences 5th edn (eds Gazzaniga MS & Mangun GR) 337–348 (MIT Press, 2014). [Google Scholar]
- 24.Alvarez GA Representing multiple objects as an ensemble enhances visual cognition. Trends Cogn. Sci. 15, 122–131 (2011). [DOI] [PubMed] [Google Scholar]
- 25.Ward EJ, Bear A & Scholl BJ Can you perceive ensembles without perceiving individuals? The role of statistical perception in determining whether awareness overflows access. Cognition 152, 78–86 (2016). [DOI] [PubMed] [Google Scholar]
- 26.Oriet C, Giesinger C & Stewart KM Can change detection succeed when change localization fails? J. Exp. Psychol. Hum. Percept. Perform. 46, 1127–1147 (2020). [DOI] [PubMed] [Google Scholar]
- 27.Haberman J & Whitney D Efficient summary statistical representation when change localization fails. Psychon. Bull. Rev. 18, 855–859 (2011). [DOI] [PMC free article] [PubMed] [Google Scholar]
- 28.Marchant AP, Simons DJ & de Fockert JW Ensemble representations: effects of set size and item heterogeneity on average size perception. Acta Psychol. 142, 245–250 (2013). [DOI] [PubMed] [Google Scholar]
- 29.Šetić M, Švegar D & Domijan D Modelling the statistical processing of visual information. Neurocomputing 70, 1808–1812 (2007). [Google Scholar]
- 30.Baek J & Chong SC Ensemble perception and focused attention: two different modes of visual processing to cope with limited capacity. Psychon. Bull. Rev. 27, 602–606 (2020). [DOI] [PubMed] [Google Scholar]
- 31.Solomon JA Five dichotomies in the psychophysics of ensemble perception. Atten. Percept. Psychophys. 83, 904–910 (2021). [DOI] [PMC free article] [PubMed] [Google Scholar]
- 32.Chetverikov A, Campana G & Kristjánsson R Building ensemble representations: how the shape of preceding distractor distributions affects visual search. Cognition 153, 196–210 (2016). [DOI] [PubMed] [Google Scholar]
- 33.Hansmann-Roth S, Thorsteinsdóttir S, Geng J & Kristjánsson R Temporal integration of feature probability distributions in visual working memory. J. Vis. 21, 1969 (2021). [Google Scholar]
- 34.van Rooij I & Baggio G Theory before the test: how to build high-verisimilitude explanatory theories in psychological science. Perspect. Psychol. Sci. 16, 682–697 (2021). [DOI] [PMC free article] [PubMed] [Google Scholar]
- 35.Schurgin MW, Wixted JT & Brady TF Psychophysical scaling reveals a unified theory of visual memory strength. Nat. Hum. Behav. 4, 1156–1172 (2020). [DOI] [PubMed] [Google Scholar]
- 36.Thurstone LL A law of comparative judgment. Psychol. Rev. 34, 273–286 (1927). [Google Scholar]
- 37.Swets JA Form of empirical ROCs in discrimination and diagnostic tasks: implications for theory and measurement of performance. Psychol. Bull. 99, 181–198 (1986). [PubMed] [Google Scholar]
- 38.Luce RD & Galanter E Psychophysical scaling. Handb. Math. Psychol. 1, 245–307 (1963). [Google Scholar]
- 39.Shepard RN Toward a universal law of generalization for psychological science. Science 237, 1317–1323 (1987). [DOI] [PubMed] [Google Scholar]
- 40.Stevens SS A scale for the measurement of a psychological magnitude: loudness. Psychol. Rev. 43, 405–416 (1936). [Google Scholar]
- 41.Wickens TD Elementary Signal Detection Theory (Oxford Univ. Press, 2001). [Google Scholar]
- 42.Wixted JT The forgotten history of signal detection theory. J. Exp. Psychol. Learn. Mem. Cogn. 46, 201–233 (2020). [DOI] [PubMed] [Google Scholar]
- 43.Brady TF, Schacter DL & Alvarez G The adaptive nature of false memories is revealed by gist-based distortion of true memories. Preprint at PsyArXiv 10.31234/osf.io/zeg95 (2018). [DOI] [Google Scholar]
- 44.Chater N, Tenenbaum JB & Yuille A Probabilistic models of cognition: where next. Trends Cogn. Sci. 10, 292–293 (2006). [DOI] [PubMed] [Google Scholar]
- 45.Hemmer P & Steyvers M A Bayesian account of reconstructive memory. Top. Cogn. Sci. 1, 189–202 (2009). [DOI] [PubMed] [Google Scholar]
- 46.McCarley JS & Benjamin AS in The Oxford Handbook of Cognitive Engineering (eds Lee JD & Kirlik A) 465–475 (Oxford Univ. Press, 2013). [Google Scholar]
- 47.Hintzman DL ‘Schema abstraction’ in a multiple-trace memory model. Psychol. Rev. 93, 411–428 (1986). [Google Scholar]
- 48.Howard MW & Kahana MJ A distributed representation of temporal context. J. Math. Psychol. 46, 269–299 (2002). [Google Scholar]
- 49.Murdock BB A theory for the storage and retrieval of item and associative information. Psychol. Rev. 89, 609–626 (1982). [DOI] [PubMed] [Google Scholar]
- 50.Reder LM et al. A mechanistic account of the mirror effect for word frequency: a computational model of remember–know judgments in a continuous recognition paradigm. J. Exp. Psychol. Learn. Mem. Cogn. 26, 294–320 (2000). [DOI] [PubMed] [Google Scholar]
- 51.Shiffrin RM & Steyvers M A model for recognition memory: REM—retrieving effectively from memory. Psychon. Bull. Rev. 4, 145–166 (1997). [DOI] [PubMed] [Google Scholar]
- 52.Kriegeskorte N & Wei XX Neural tuning and representational geometry. Nat. Rev. Neurosci. 22, 703–718 (2021). [DOI] [PubMed] [Google Scholar]
- 53.Xiong HD & Wei XX Optimal encoding of prior information in noisy working memory systems. In Conference on Computational Cognitive Neuroscience (CCN, 2022). [Google Scholar]
- 54.Nosofsky RM Attention and learning processes in the identification and categorization of integral stimuli. J. Exp. Psychol. Learn. Mem. Cogn. 13, 87–108 (1987). [DOI] [PubMed] [Google Scholar]
- 55.Tenenbaum JB Bayesian modeling of human concept learning. Adv. Neural Inf. Process. Syst. 11, 59–68 (1999). [Google Scholar]
- 56.Shamir M Emerging principles of population coding: in search for the neural code. Curr. Opin. Neurobiol. 25, 140–148 (2014). [DOI] [PubMed] [Google Scholar]
- 57.Averbeck BB, Latham PE & Pouget A Neural correlations, population coding and computation. Nat. Rev. Neurosci. 7, 358–366 (2006). [DOI] [PubMed] [Google Scholar]
- 58.Bartolo R, Saunders RC, Mitz AR & Averbeck BB Information-limiting correlations in large neural populations. J. Neurosci. 40, 1668–1678 (2020). [DOI] [PMC free article] [PubMed] [Google Scholar]
- 59.Kohn A, Coen-Cagli R, Kanitscheider I & Pouget A Correlations and neuronal population information. Annu. Rev. Neurosci. 39, 237–256 (2016). [DOI] [PMC free article] [PubMed] [Google Scholar]
- 60.Williams JR, Robinson MM, Schurgin MW, Wixted JT & Brady TF You can’t ‘count’ how many items people remember in working memory: the importance of signal detection-based measures for understanding change detection performance. J. Exp. Psychol. Hum. Percept. Perform. 48, 1390–1409 (2022). [DOI] [PMC free article] [PubMed] [Google Scholar]
- 61.Robinson MM, Benjamin AS & Irwin DE Is there a K in capacity? Assessing the structure of visual short-term memory. Cogn. Psychol. 121, 101305 (2020). [DOI] [PubMed] [Google Scholar]
- 62.Tong K, Dubé C & Sekuler R What makes a prototype a prototype? Averaging visual features in a sequence. Atten. Percept. Psychophys. 81, 1962–1978 (2019). [DOI] [PubMed] [Google Scholar]
- 63.VanderWeele TJ & Mathur MB Some desirable properties of the Bonferroni correction: is the Bonferroni correction really so bad? Am. J. Epidemiol. 188, 617–618 (2019). [DOI] [PMC free article] [PubMed] [Google Scholar]
- 64.Rahnev D, Block N, Denison RN & Jehee J Is perception probabilistic? Clarifying the definitions. Preprint at PsyArXiv https://psyarxiv.com/f8v5r/ (2021). [Google Scholar]
- 65.Eckstein MP Probabilistic computations for attention, eye movements, and search. Annu. Rev. Vis. Sci. 3, 319–342 (2017). [DOI] [PubMed] [Google Scholar]
- 66.Ma WJ Organizing probabilistic models of perception. Trends Cogn. Sci. 16, 511–518 (2012). [DOI] [PubMed] [Google Scholar]
- 67.Zeng T, Tompary A, Schapiro AC & Thompson-Schill SL Tracking the relation between gist and item memory over the course of long-term memory consolidation. eLife 10.7554/elife.65588 (2021). [DOI] [PMC free article] [PubMed] [Google Scholar]
- 68.Rosenbaum D & Bowman H Extraction of gist without encoding of individual items in RSVP of numerical sequences. Preprint at OSF; https://osf.io/n2rcj (2021). [Google Scholar]
- 69.Hommel B et al. No one knows what attention is. Atten. Percept. Psychophys. 81, 2288–2303 (2019). [DOI] [PMC free article] [PubMed] [Google Scholar]
- 70.Greene NR & Naveh-Benjamin M The effects of divided attention at encoding on specific and gist-based associative episodic memory. Mem. Cogn. 50, 59–76 (2021). [DOI] [PMC free article] [PubMed] [Google Scholar]
- 71.Chen Z, Zhuang R, Wang X, Ren Y & Abrams RA Ensemble perception without attention depends upon attentional control settings. Atten. Percept. Psychophys. 83, 1240–1250 (2021). [DOI] [PubMed] [Google Scholar]
- 72.Zepp J, Dubé C & Melcher D A direct comparison of central tendency recall and temporal integration in the successive field iconic memory task. Atten. Percept. Psychophys. 83, 1337–1356 (2021). [DOI] [PMC free article] [PubMed] [Google Scholar]
- 73.Gershman SJ in The Oxford Handbook of Human Memory (eds Kahana M & Wagner A) (Oxford Univ. Press, 2021). [Google Scholar]
- 74.Li AY, Liang JC, Lee AC & Barense MD The validated circular shape space: quantifying the visual similarity of shape. J. Exp. Psychol. Gen. 149, 949–966 (2020). [DOI] [PubMed] [Google Scholar]
- 75.Zhang W & Luck SJ Discrete fixed-resolution representations in visual working memory. Nature 453, 233–235 (2008). [DOI] [PMC free article] [PubMed] [Google Scholar]
- 76.Smith JD & Minda JP Prototypes in the mist: the early epochs of category learning. J. Exp. Psychol. Learn. Mem. Cogn. 24, 1411–1436 (1998). [Google Scholar]
- 77.Nadarajah S, Afuecheta E & Chan S On the distribution of maximum of multivariate normal random vectors. Commun. Stat. Theory Methods 48, 2425–2445 (2019). [Google Scholar]
Associated Data
This section collects any data citations, data availability statements, or supplementary materials included in this article.
Supplementary Materials
Data Availability Statement
The data are publicly available at the following OSF link: https://osf.io/mt29p/.