Abstract
Simultaneous study of magnetic and electrocatalytic properties of cobaltites under extreme conditions expands the understanding of physical and chemical processes proceeding in them with the possibility of their further practical application. Therefore, La0.6Sr0.4CoO3 (LSCO) nanopowders were synthesized at different annealing temperatures tann = 850–900 °C, and their multifunctional properties were studied comprehensively. As tann increases, the rhombohedral perovskite structure of the LSCO becomes more single-phase, whereas the average particle size and dispersion grow. Co3+ and Co4+ are the major components. It has been found that LSCO-900 shows two main Curie temperatures, TC1 and TC2, associated with a particle size distribution. As pressure P increases, average ⟨TC1⟩ and ⟨TC2⟩ increase from 253 and 175 K under ambient pressure to 268 and 180 K under P = 0.8 GPa, respectively. The increment of ⟨dTC/dP⟩ for the smaller and bigger particles is sufficiently high and equals 10 and 13 K/GPa, respectively. The magnetocaloric effect in the LSCO-900 nanopowder demonstrates an extremely wide peak δTfwhm > 50 K that can be used as one of the composite components, expanding its working temperature window. Moreover, all LSCO samples showed excellent electrocatalytic performance for the oxygen evolution reaction (OER) process (overpotentials of only 265–285 mV at a current density of 10 mA cm–2) with minimal η10 for LSCO-900. Based on the experimental data, it was concluded that the formation of a dense amorphous layer on the surface of the particles ensures high stability as a catalyst (at least 24 h) during electrolysis in 1 M KOH electrolyte.
Keywords: cobaltites, nanopowder, high pressure magnetic studies, OER, electrochemistry
1. Introduction
Interest in lanthanum-doped strontium La1–xSrxCoO3 cobaltites constantly increases due to their physical and chemical multifunctionality.1 They demonstrate unique magnetic and transport properties2 as well as charge, spin, and orbital ordering;3 spin-state transition;4 electromagnetic phase separation;5 and metal–insulator transition6 with strong mutual spin, orbital, charge, and lattice coupling. It makes them ferromagnetic (FM), ferroelectric, and electrocatalytically active with high electrode performance and a giant magnetoresistance effect.7 Moreover, they show high ionic and electronic conductivity, good catalytic properties, and high stability,8 mainly because of the low mobility of Sr on the crystal surface and the formation of Co4+ ions and oxygen vacancies. Besides that, the excellent properties of cobaltites can be changed by external perturbations such as pressure and annealing process, i.e., “core–shell” ratio. All these attract great scientific interest to cobaltites and make them promising candidates for practical application as electrode materials for high-temperature solid oxide fuel cells, catalysts, current and magnetic field sensors, gas sensors, etc.9,10 For studying the electrocatalytic and magnetic properties, applying the nanoparticle materials is a very useful tool, because the influence of the surface-dependent reasons is dominant in both cases. However, there still needs to be clarified and unstudied physical and chemical processes as surface-dependent reasons for obtaining high electrode performance. A simultaneous study of physical and chemical properties is relevant to improving the catalytic properties of such electrodes. The possibilities of changing the size of cobaltite particles and their effect on electrocatalytic and magnetic properties are of great interest. Moreover, the contactless heating and cooling of cobaltites as electrodes, using the magnetocaloric effect (MCE), should influence their reaction rate.11 In this regard, studying the MCE or the effect of heating under an alternating electromagnetic field is particularly interesting. Additionally, as shown recently in our previous work,12 the perovskite ceramics, after electrocatalysis, exhibited a decrease in its magnetic moment, making it possible to control the depletion of the electrodes and predict their working time and performance.
Original LaCoO3 has an antiferromagnetic (AFM) order and dilution with divalent Sr2+ up to x = 0.4 enhance its FM order making this La0.6Sr0.4CoO3 compound fully FM with the highest Curie temperature TC ≈ 230 K and the closest to the room temperature among other La1–xSrxCoO3 compositions.6 However, the TC can significantly differ and be 246 K13 or even 321 K14 for the same x = 0.4. Moreover, besides classical FM double-exchange (DE) between Co3+ and Co4+ ions, the AFM superexchange interactions Co3+–Co3+ and Co4+–Co4+, and phase separation can coexist15 that makes this La0.6Sr0.4CoO3 system more complicated along with the sophisticated spin states distribution. Additionally, there is no data about particle size distribution’s influence on the magnetic properties, Curie temperature, and MCE of the La0.6Sr0.4CoO3 nanopowders. The effect of high hydrostatic pressure on the functional properties is of particular interest. External pressure should modify the Co–O distance and Co–O–Co angle and, as a result, change exchange interactions, phase transition temperatures, degree of magnetic uniformity, and MCE parameters. All of these issues and unspecified moments need to be clarified.
Among the various functional properties of perovskite-based materials containing 3d-metals, a good electrocatalytic activity for oxygen release should also be noted.16 Such electrocatalysts are extremely important for energy conversion and storage, ecologically clean fuel (hydrogen) generation, and highly efficient current sources. However, a significant problem remains, such as the large overpotential and sluggish kinetics in the electrochemical reactions of the oxygen evolution reaction (OER) and oxygen reduction reaction, which slow the adoption of new technologies and commercial developments. From this perspective, one of the critical issues is the replacement of existing industrially expensive Ir/Ru-based catalysts with cheaper catalysts with similar characteristics. The leading search for such catalysts is quite successfully carried out among many compounds of transition metals or their combinations (borides, carbides, nitrides, phosphides, chalcogenides, oxides, or hydroxides, etc.). In addition, these multicomponent systems and composite materials containing carbon nanosheets or nanotubes have been actively studied in recent years as electrocatalysts for Zn-air batteries and water splitting.17,18 It fully applies to Ln- and Co-containing complex oxides of the ABO3-type, where for perovskites, A-positions usually correspond to a rare-earth or alkaline earth element, and B is commonly a transition metal or a combination thereof.19−28 In general, it is considered that both types of metal influence the oxygen-catalytic activity of perovskites in the A- and B-sites.29 However, the high electrocatalytic activity of perovskites for OER in an alkaline medium is primarily the result of the redox behavior of the hybridization of transition metal 3d and oxygen 2p orbits.30 Numerical studies of perovskites as electrocatalysts revealed that, in addition to the chemical composition, activity in oxygen electrocatalysis reactions is also affected by a significant number of factors, namely, method and conditions of preparation of the material (annealing at different temperatures and in a controlled atmosphere can cause different types of defects on the surface);22,31 particle size, porosity, and shape (affects active surface area);20−22,32 doping;19,23,25,33,34 and amorphization of the surface.35
It should be noted that, as demonstrated by Mefford et al.,36 for LSCO catalysts, oxygen vacancy defects are a crucial parameter in improving the electrocatalysis of oxygen on metal oxide surfaces, due to which they can control the physical parameters of the ion diffusion rate and reflect the basic electronic structure of the catalyst. Moreover, due to electrochemical processes or an aggressive alkaline electrolyte, complex oxides, including perovskites,37,38 can be transformed in situ to other compounds,11,12,39 directly affecting the electrocatalytic activity during long-term electrolysis. Interestingly, although many perovskites remain crystalline during OER in alkaline media, some highly active compounds become amorphous.38 As a result, it has been suggested that dynamic surface self-reconstruction is the key to highly active perovskite electrocatalysts for water splitting,40 and later atomistic insights into activation and degradation of LSCO electrocatalysts under oxygen evolution conditions were considered.41 For these reasons, when studying perovskites as electrocatalysts for the OER, evaluating their primary activity and conducting research after electrochemical testing is crucial.
Additionally, studying electrochemical activity and physical properties directly on the same samples is very important since the obtained data supplement each other and allow us to make more correct conclusions. Moreover, knowledge of the behavior of other physical properties, such as temperature changes of magnetic phase transitions and magnetoactive phenomena (MCE or magnetoresistance effect) under changing internal and external factors is essential as well when it is necessary to change the conditions of electrocatalytic applications.
Thus, in this paper, the cobaltite La0.6Sr0.4CoO3 nanopowders have been obtained under different annealing temperatures tann = 850, 875, and 900 °C and their structure, morphology, particle size distribution, and magnetic, magnetocaloric, and electrocatalytic properties have been studied comprehensively. The most single-phase La0.6Sr0.4CoO3 nanopowder with tann = 900 °C has been selected to study the phase transitions and magnetic properties under high hydrostatic pressure up to P ≈ 0.8 GPa. The same sample showed excellent electrocatalytic activity and high stability for the OER in alkaline electrolytes.
2. Experimental Section
2.1. Sample Preparation
Cobaltite La0.6Sr0.4CoO3 (LSCO) nanopowders were obtained using the sol–gel method from the initial La(NO3)3·6H2O (99.9% trace metals basis, Sigma–Aldrich), Sr(NO3)2 (ACS reagent, ≥ 99.0%, Sigma–Aldrich) and Co(NO3)2·6H2O (reagent grade, 98%, Sigma-Aldrich) reagents. The calculated amounts of nitrates and citric acid (the ratio of the molar sum of metals and H3Cit·H2O was 1:1) were dissolved in deionized water. The solution was evaporated to form a homogeneous gel, dehydrated, and heated from 200 to 500 °C (the heating rate equals 50 °C h–1). The obtained powder was ground in an agate mortar and annealed at temperatures of tann = 850, 875, and 900 °C for 10 h at each temperature. Finally, three samples obtained at different tann values were named LSCO-850, LSCO-875, and LSCO-900 for further investigation.
2.2. Characterization
The phase composition and size of coherent scattering regions of the samples were examined using the X-ray diffraction (XRD) method on a Shimadzu LabX XRD-6000 diffractometer in CuKα1-radiation (λ = 0.15406 nm) before electrocatalysis and X-ray diffractometer MicroMax-007 HF (Rigaku, Japan) in Mo-Kα radiation (λ = 0.071146 nm) after electrocatalysis, both at room temperature. The JCPDS PDF-2 database was used for defining the phase composition. The refinement of crystal structures was carried out with Rietveld analysis42 using FullProf software.43
The morphology and size of particles were determined using the transmitting electron microscopy (TEM) method on a JEM-2200FS Transmission Electron Microscope and scanning electron microscopy (SEM) method on a FEI MAGELLAN 400 and Bruker XFlash 6|60 in the Hitachi Regulus 8100. The distribution function of nanoparticle size was obtained by analyzing SEM and TEM images using Nano Measure 1.2.5 software.11 Additionally, the chemical composition of the samples was clarified using energy-dispersive X-ray spectroscopy (EDS) mode.
X-ray photoelectron spectroscopy (XPS) measurements were performed on an ESCALAB 250 X-ray photoelectron spectrometer. The XPS spectra were fitted and analyzed by using OriginPro 2018 software. The background of the X-ray photoelectronic lines was cut by using the Shirley method. The spectra were excited by using monochromatized Al–Kα radiation. The state of the surfaces was monitored through the C 1s line, allowing calibration of the energy scales for all spectra. The C 1s line binding energy was approximately 285 eV.
Magnetic measurements were carried out using a Quantum Design SQUID MPMS 3 instrument in a temperature range from 2 to 300 K and in a magnetic field up to 30 kOe. The temperature dependences of magnetization M(T) under H = 50 Oe were carried out in two regimes: zero-field cooling (ZFC) and field cooling (FC). The heating and cooling of the samples were carried out with a constant rate of 1 K min–1. The MCE was determined using magnetization isotherms M(H) near the Curie temperature TC with a ΔT = 2 K step. Each isotherm M(H) was measured with an increase in the magnetic field H from 0 to 10 kOe with a step of ΔH = 100 Oe. Before each measurement of the isotherms, the magnetic nanopowder was demagnetized. Additionally, magnetic measurements under high pressure up to P ≈ 0.8 GPa were performed using a piston-type pressure cell made of Ni–Cr–Al alloy.44,45 Silicon oil with a low viscosity was used as a pressure-transmitting medium. The pressure inside was measured by using the pressure dependence of the superconducting transition temperature of high-purity lead.
2.3. Electrode Fabrication and Electrochemical Measurements
To fabricate the working electrodes, mixtures of LSCO samples, Super P (conductive carbon black), and PVDF (poly(vinylidene fluoride)) were prepared in a weight ratio of 85:10:5, respectively. Next, NMP (N-methylpyrrolidone) was added to the mixture. After that, the liquid suspension was applied onto a carbon fiber (HCP331N) with a working area of 1 cm2 and dried at 60 °C for 24 h in a vacuum oven. Each electrode contained approximately 30 mg of electroactive material. The benchmark RuO2/C electrode for investigating OER was made using a similar preparation procedure.
The electrochemical tests were conducted using an electrochemical workstation (CHI 760E, Shanghai, China). A typical three-electrode setup included an LSCO working electrode, a commercial Hg/HgO reference electrode, and a platinum foil counter electrode in 1 M KOH (pH 14). The linear sweep voltammetry (LSV) curves were collected at a scan rate of 1 mV s–1 with iR-compensation. Electrochemical impedance spectroscopy (EIS) was obtained in the frequency range from 0.1 to 100 kHz with an amplitude of 5 mV at the open circuit potential. Chronopotentiometry (CP) was carried out under a constant current density of 10 mA cm–2 for 24 h. All the potentials versus Hg/HgO were converted to versus reversible hydrogen electrode (RHE): (ERHE = EHg/HgO + 0.098 + 0.059pH).
3. Results and Discussion
3.1. Structural Properties
XRD patterns of the LSCO nanopowders are presented in Figure 1. The main crystalline phase is a perovskite crystal structure with a rhombohedral R3̅c space group. Some of the second phase was also detected as SrCo0.78O2.48, which decreases with increasing tann from 17.4% for LSCO-850 to 14.8% for LSCO-875 and 8% for LSCO-900. It should be noted that this impurity with increased content of cationic Co0.78 and anionic O2.48 vacancies does not influence the magnetic properties of the main LSCO phase near its high Curie temperature TC ≈ 250 K (see the following Section 3.2.) because the closest SrCoO2.5 composition to our impurity is AFM with high Néel temperature TN = 570 K.46 Moreover, the less content of oxygen and cobalt, the much lower TC compared with our TC ≈ 250 K and much weaker FM interactions.3,47,48 The main lattice parameters are listed in Table 1 and are consistent with other literature data.13,49 With increasing tann, a unit cell volume V is increased nonmonotonically, indicating the successive replacement of smaller La3+ cation (rLa3+ = 0.136 nm) by bigger Sr2+ cation (rSr2+ = 0.144 nm) in 12-fold oxygen coordination.50 At the same time, the average size of coherent scattering regions DXRD, determined via the Scherrer equation,51 increases with increasing tann from 48 nm for the LSCO-850 to 54 nm for the LSCO-875 and 60 nm for the LSCO-900 (Table 2 and Supporting Information SI 1).
Figure 1.
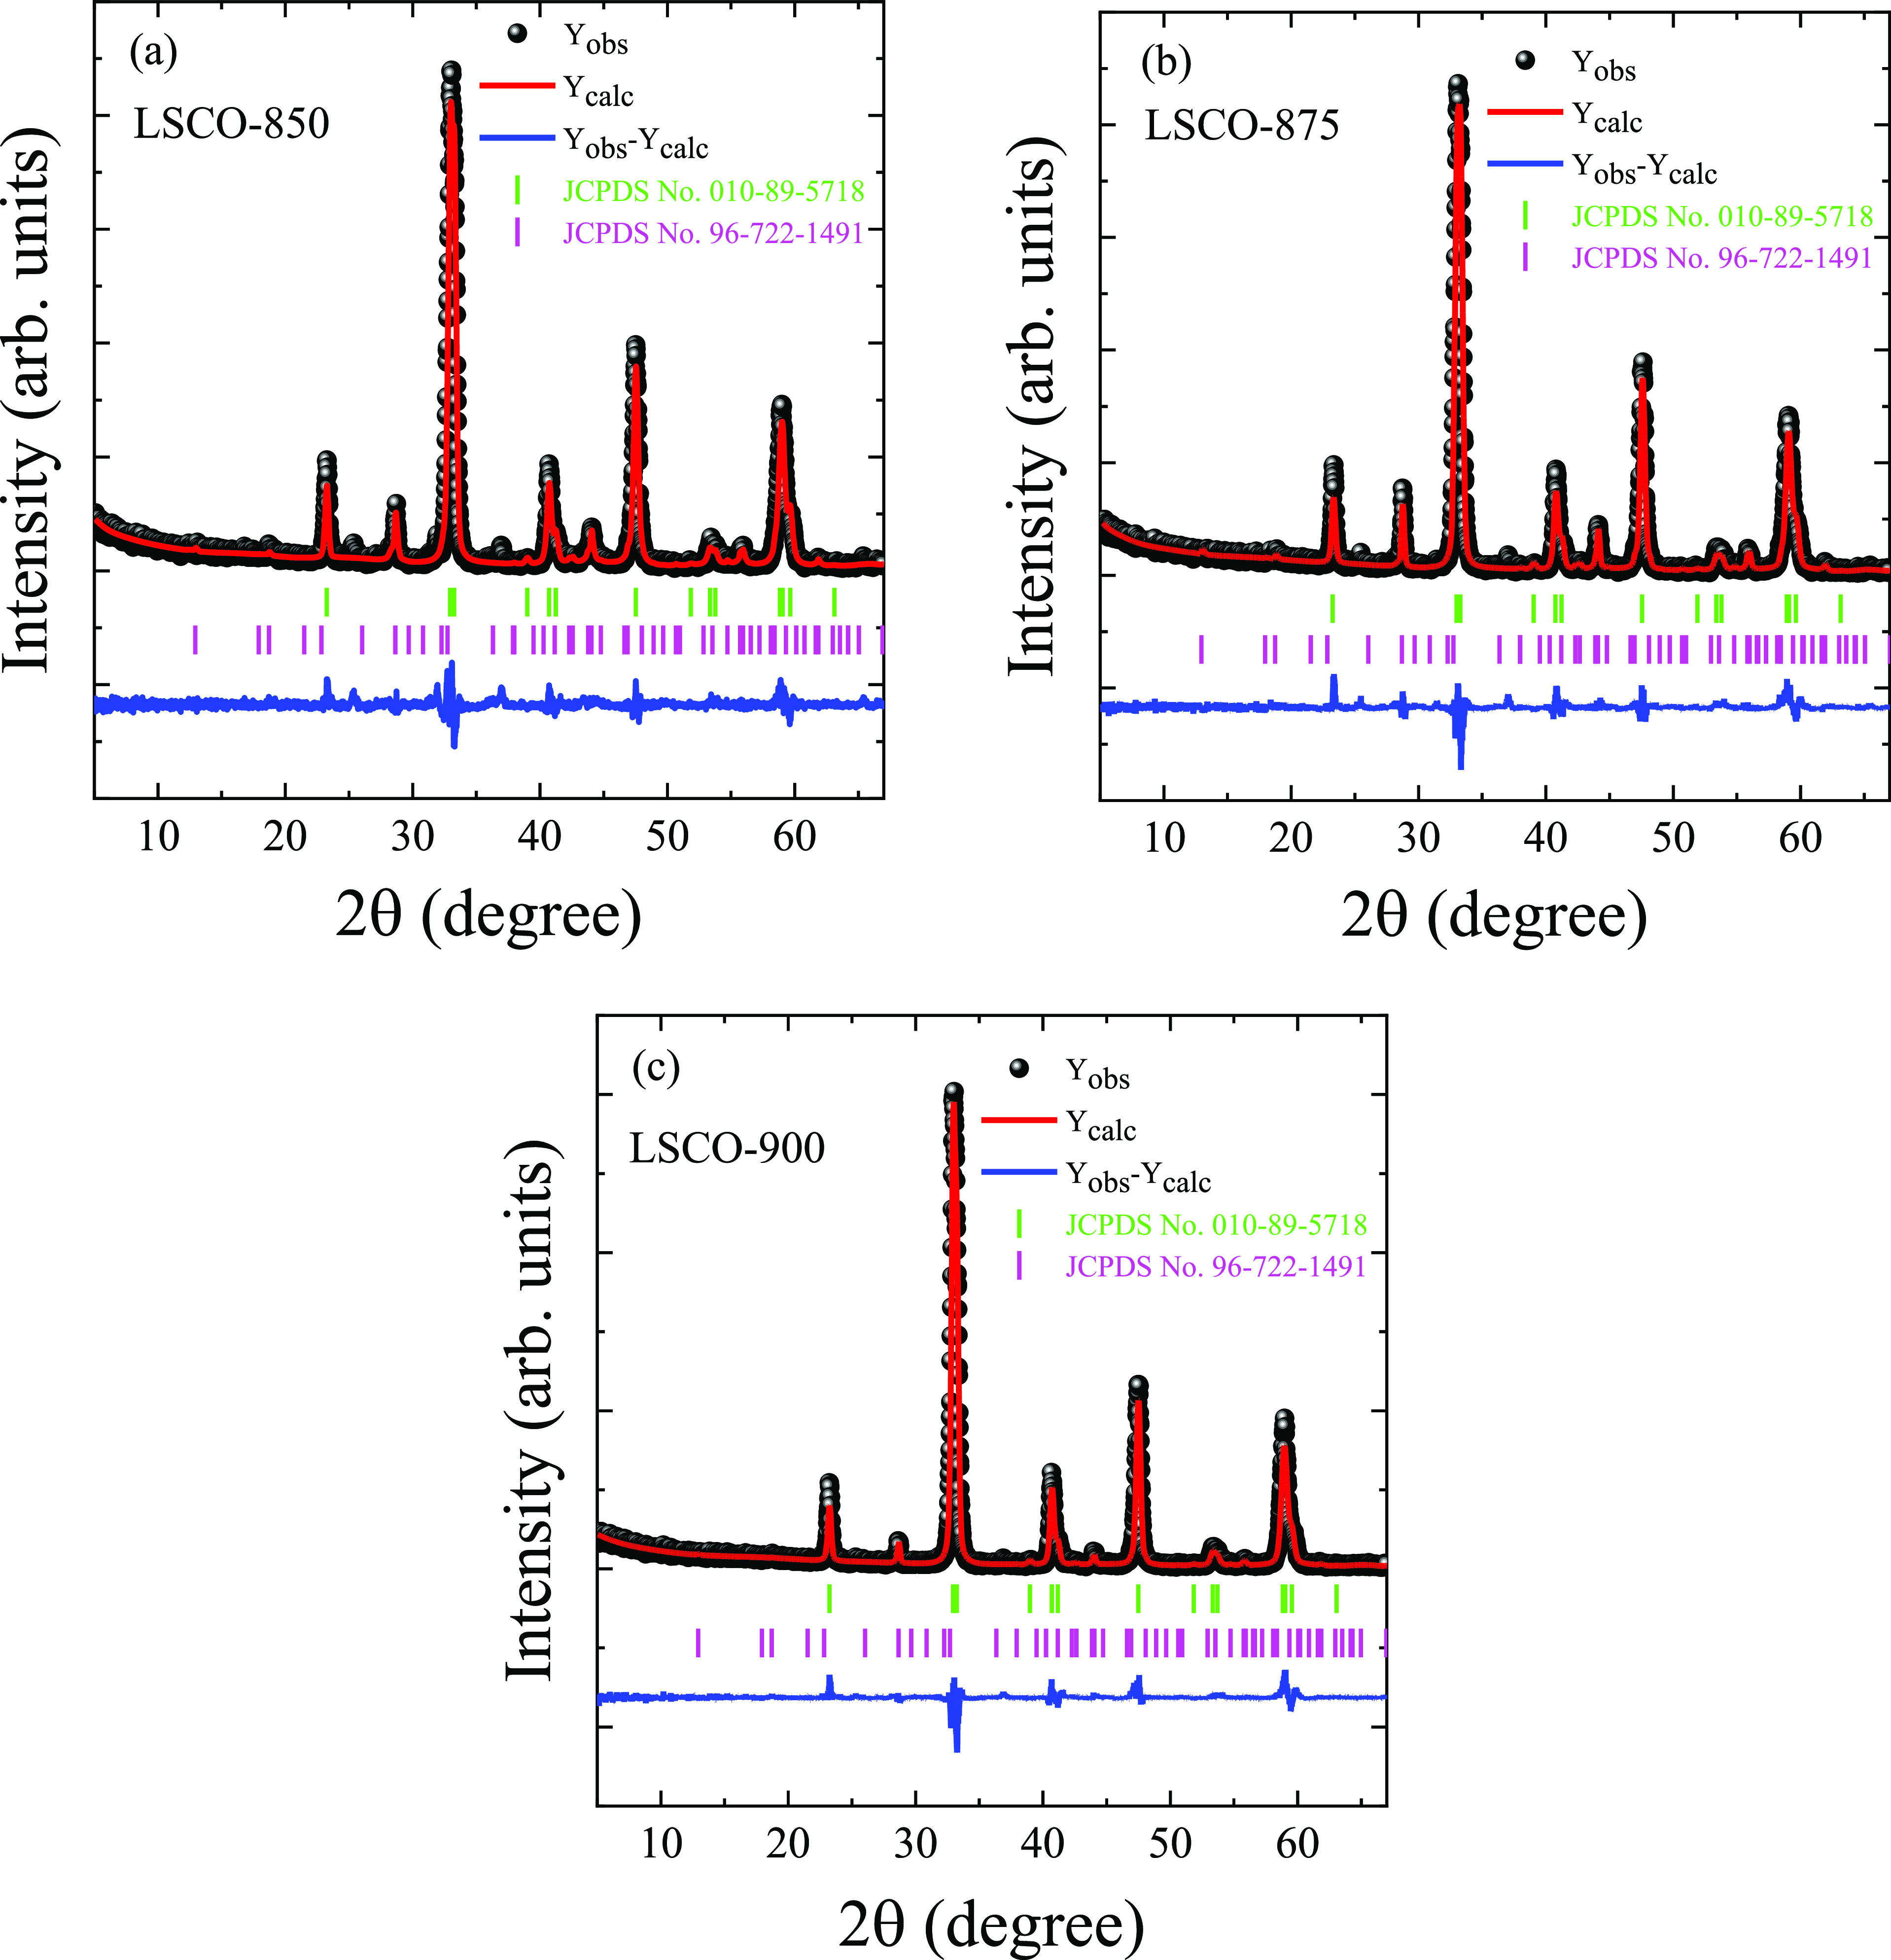
XRD patterns of the LSCO measured at room temperature and fitted by the Rietveld method. The experimental (black cycles) and calculated (red up curve) values and a difference curve (blue bottom line) normalized to a statistical error are presented. Vertical bars are the calculated positions of diffraction peaks corresponding to the main rhombohedral R3̅c perovskite structure and rhombohedral R32 impurity SrCo0.78O2.48 in (a) LSCO-850, (b) LSCO-875, and (c) LSCO-900.
Table 1. Rietveld Refinement Crystallographic Parameters of the LSCO Nanopowders at Different tann.
| phase
composition at tann (°C) |
||||||
|---|---|---|---|---|---|---|
| 850 |
875 |
900 |
||||
| La0.6Sr0.4CoO3 82.6% | SrCo0.78O2.48 17.4% | La0.6Sr0.4CoO3 85.2% | SrCo0.78O2.48 14.8% | La0.6Sr0.4CoO3 92.0% | SrCo0.78O2.48 8.0% | |
| space group | R3̅c (No. 167) | R32 (No. 155) | R3̅c (No. 167) | R32 (No. 155) | R3̅c (No. 167) | R32 (No. 155) |
| a (Å) | 5.43171(24) | 9.46930(176) | 5.42651(22) | 9.46644(123) | 5.43219(17) | 9.47809(280) |
| b (Å) | 5.43171(24) | 9.46930(176) | 5.42651(22) | 9.46644(123) | 5.43219(17) | 9.47809(280) |
| c (Å) | 13.12327(97) | 12.39900(378) | 13.12711(86) | 12.36905(277) | 13.14732(83) | 12.37605(411) |
| V (Å3) | 335.310(32) | 962.837(387) | 334.766(29) | 959.931(278) | 335.984(26) | 962.840(514) |
| Z | 6 | 18 | 6 | 18 | 6 | 18 |
| ρ (g/cm3) | 6.695 | 5.379 | 6.708 | 5.395 | 6.676 | 5.379 |
| Rp (%) | 10.9 | 10.4 | 10.3 | |||
| Rwp (%) | 15.2 | 14.1 | 13.6 | |||
| Rexp (%) | 9.76 | 10.05 | 9.94 | |||
| χ2 (%) | 2.43 | 1.98 | 1.87 | |||
Table 2. Particle Size Distribution Based on the XRD, SEM, and TEM Data for LSCO at Different tann.
| XRD | SEM |
TEM |
|||||||
|---|---|---|---|---|---|---|---|---|---|
| tann(°C) | DXRD(nm) | DSEM(nm) | function | σ | R2 | DTEM(nm) | function | σ | R2 |
| 850 | 48 ± 1 | 74 ± 3 | Lorentz | 28 ± 9 | 0.62297 | 39 ± 2 | LogNormal | 32 ± 6 | 0.87573 |
| 875 | 54 ± 1 | 75 ± 2 | Gaussian | 54 ± 5 | 0.96482 | 44 ± 1 | LogNormal | 28 ± 2 | 0.98392 |
| 900 | 60 ± 1 | 79 ± 1 | Gaussian | 63 ± 3 | 0.98155 | 47 ± 1 | LogNormal | 13 ± 2 | 0.97304 |
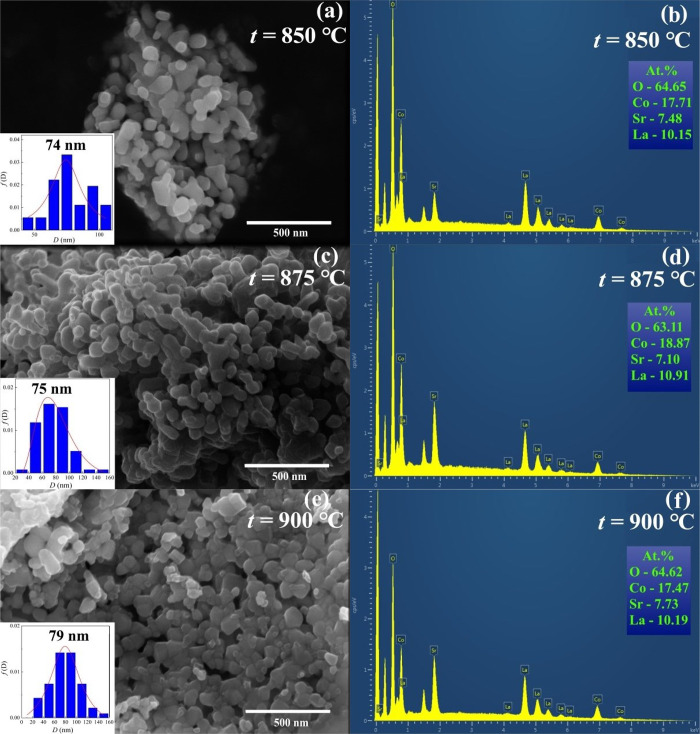
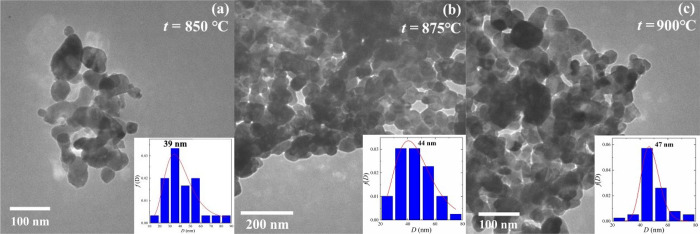
The morphology and particle size distribution of the LSCO were studied using SEM and TEM data (see Figures 2 and 3). All LSCO nanopowders demonstrate a well-developed structural nature with a spherical-like shape of nanoparticles. An average particle size D and their distribution (see Table 2) were defined using a detailed approach described in our previous work.11 With increasing tann, the particle size is increased from DSEM = 74 nm and DTEM = 39 nm for LSCO-850 to 75 and 44 nm for LSCO-875 and 79 and 47 nm for LSCO-900, which correlates with the XRD data. The differences between SEM and TEM data are possible because of insufficient data sets by size and a more accurate determination approach of the average particle size based on the TEM method using a smaller 100–200 nm scale and having less error with a higher coefficient of determination R2 (see Table 2). It should be noted that dispersion σ is relatively high, indicating the existence of particles with a big difference in their sizes. Additionally, the chemical composition of all LSCO is approximately confirmed as 0.6:0.4:1 according to the EDS data (see Figure 2b, d, f).
Figure 2.
SEM and EDS images of the LSCO compositions obtained at tann = (a, b) 850, (c, d) 875, and (e, f) 900 °C. Insets show particles’ distribution with an average particle size DSEM.
Figure 3.
TEM images of the LSCO nanopowders obtained at tann = (a) 850, (b) 875, and (c) 900 °C. Insets show particles’ distribution with an average particle size DTEM.
3.2. Magnetic Properties
The field dependences of magnetization M(H) for LSCO-900 at 2, 77, and 300 K are presented in Figure 4. The LSCO-900 is in FM at 2 and 77 K and PM at 300 K states. At 2 K, the spontaneous magnetization MS achieves 10.5 emu/g, and there is no saturation even under magnetic field 3 T that indicates competing between FM DE Co3+–Co4+ and AFM superexchange Co3+–Co3+ and Co4+–Co4+ interactions.52 At the same time, Co ions can be in high-spin (HS), low-spin (LS), and/or even intermediate-spin (IS) states.52 Based on the experimentally defined FM moment μFMexp = 0.42 μB and other data,2,6,47 it can be concluded that the most probable spin state for Co3+ and Co4+ ions are HS (t2g4eg2) with S = 4/2 and LS (t2g5eg0) with S = 1/2 states, respectively. Theoretical calculations give μFMtheor = 2.8 μB. The big difference between theoretical and experimental data may be associated with competing for different magnetic interactions and the presence of oxygen vacancies.44,53,54 The main magnetic parameters are given in Table 3. It should be noted that LSCO-900 is a ferromagnet with a strong coercivity HC = 4.3 kOe and residual magnetization Mr = 7.2 emu/g at 2 K (see the inset of Figure 4).
Figure 4.
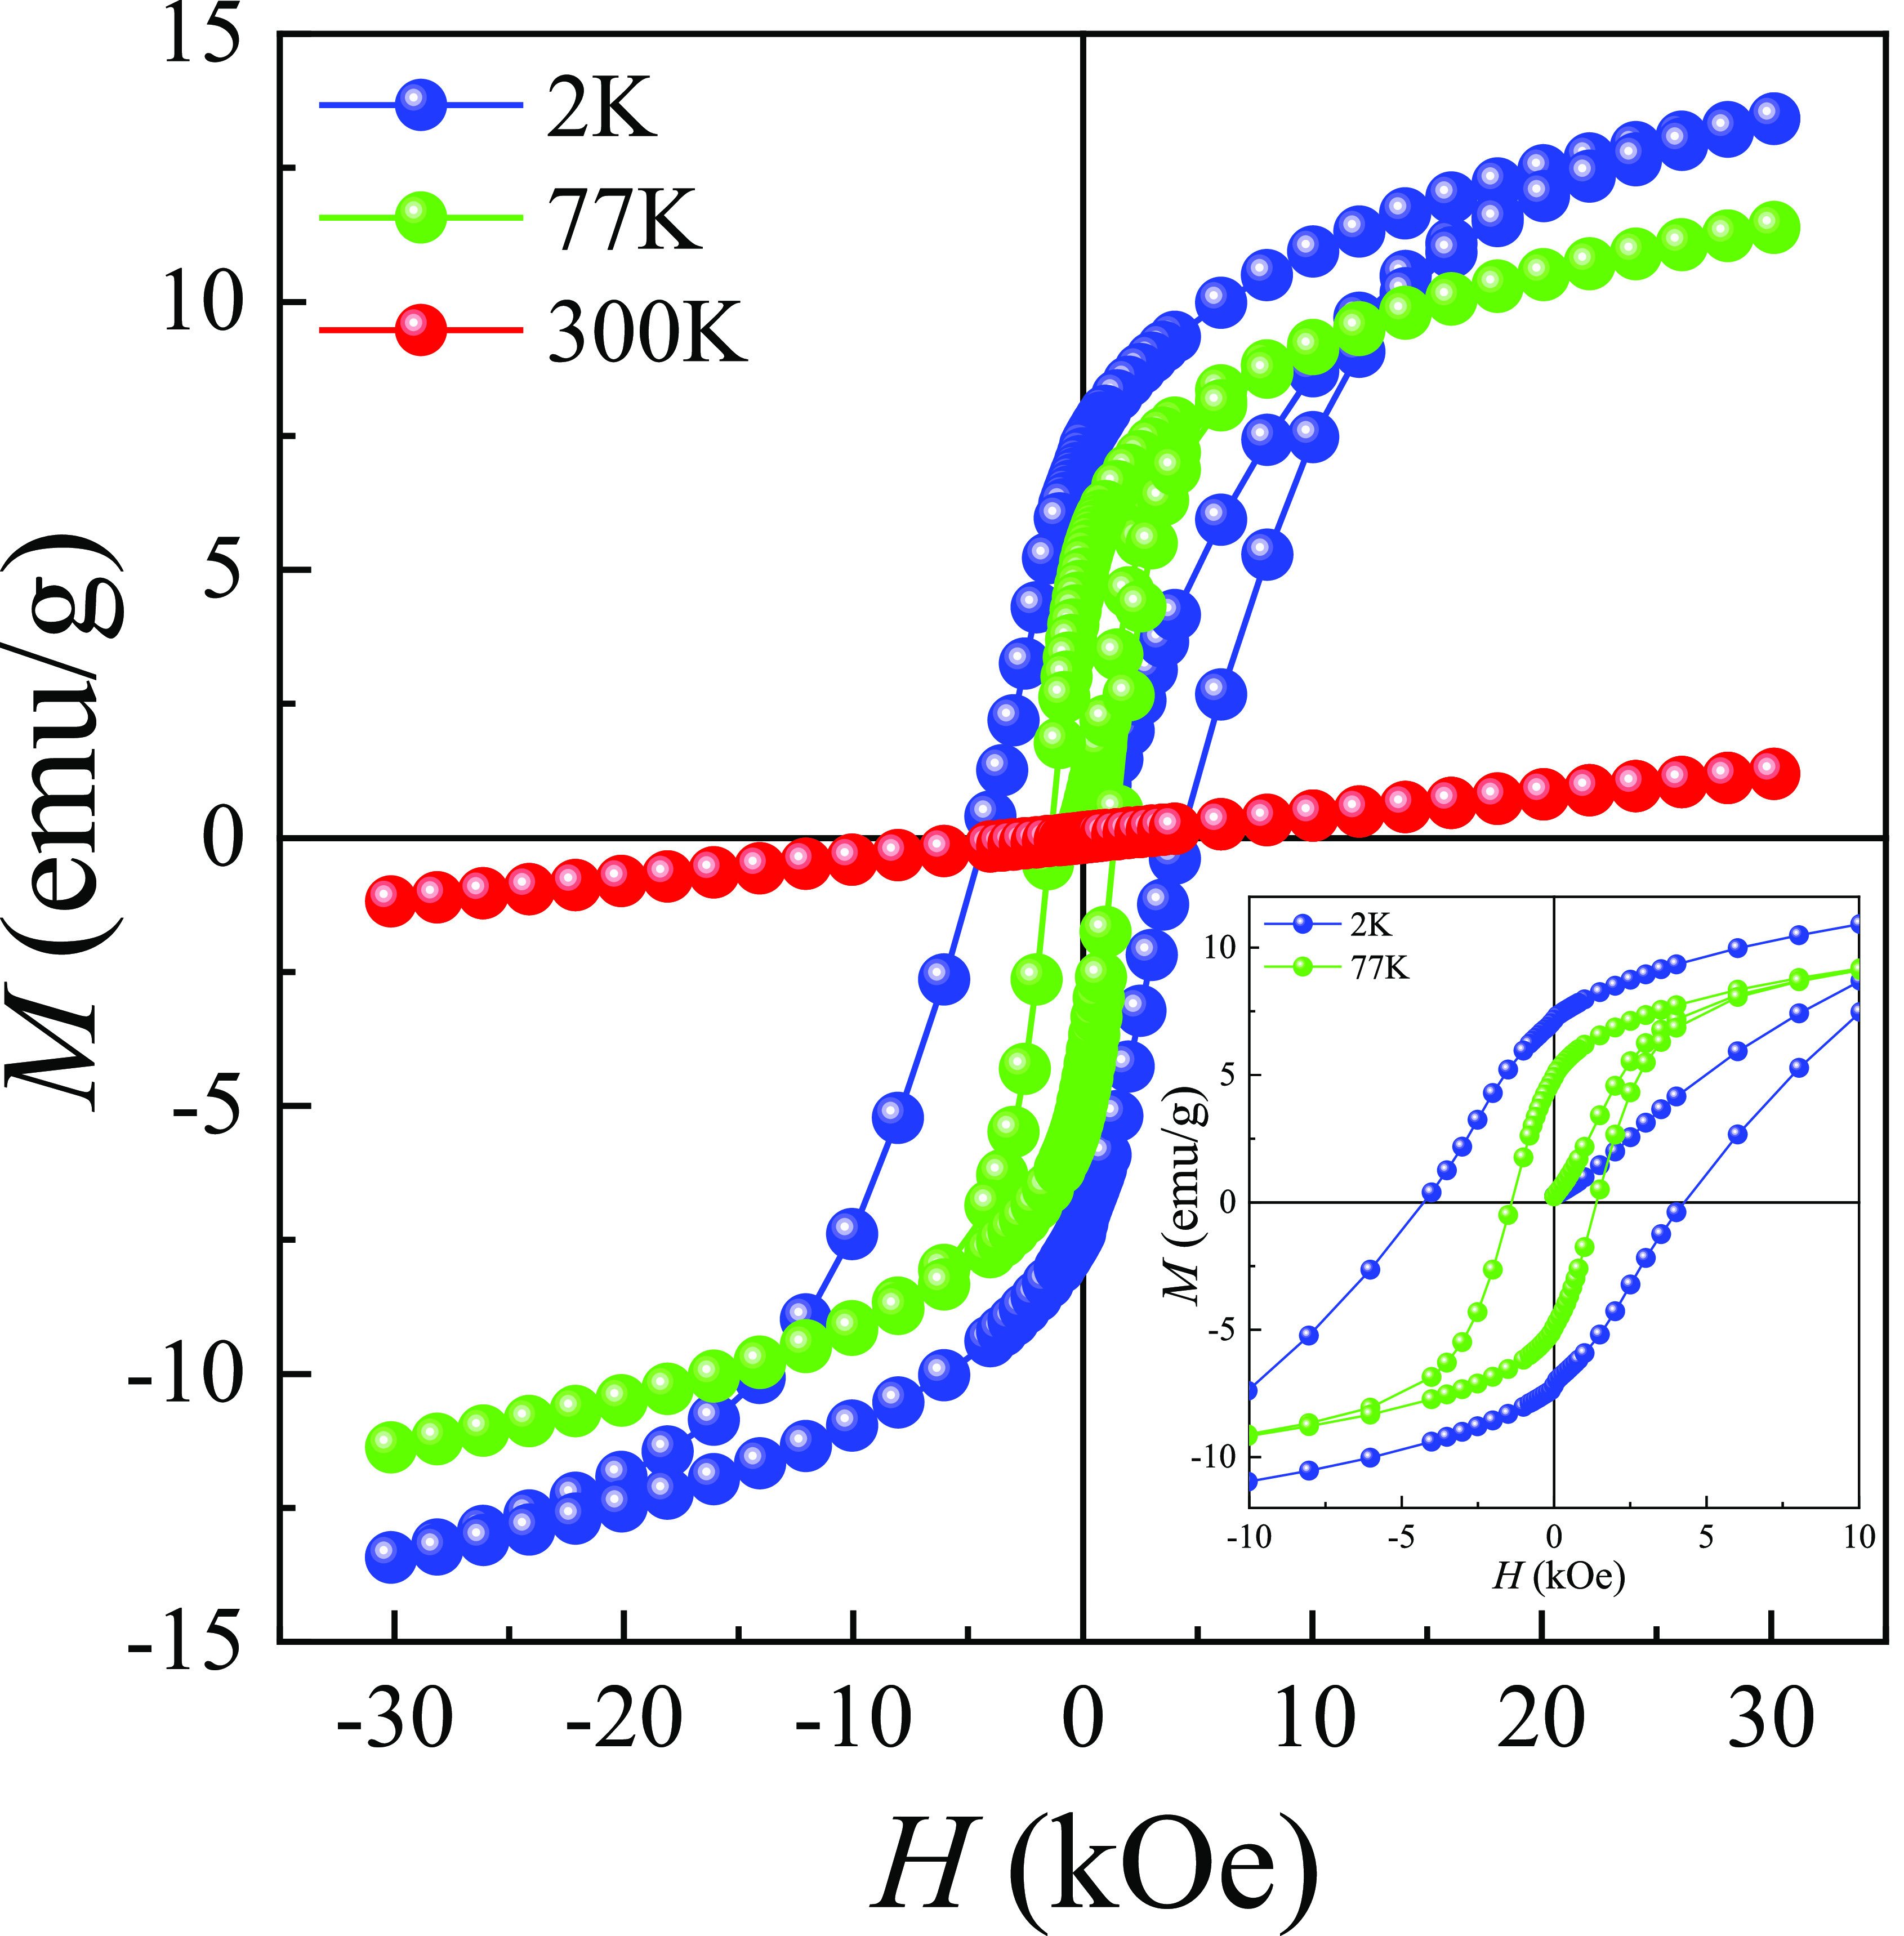
Field dependences of magnetization M(H) at 2, 77, and 300 K for the LSCO-900. The inset shows an enlarged area of the M(H).
Table 3. Main Magnetic Parameters: Spontaneous Magnetization MS, Residual Magnetization Mr, Coercivity HC, Characteristic Curie Temperatures TC1, TC2, TC3, TC4, AFM Transition Temperature Tt, and Blocking Temperature TB under Different Pressures P for LSCO-900.
| FM |
near
phase transitions |
|||||||||||
|---|---|---|---|---|---|---|---|---|---|---|---|---|
|
MS(emu/g) |
Mr(emu/g) |
HC(kOe) |
FC | ZFC | FC | ZFC |
||||||
| P(GPa) | 2 K | 77 K | 2 K | 77 K | 2 K | 77 K | TC1(K) | TC2(K) | TC3(K) | TC4(K) | TAFM(K) | TB(K) |
| 0 | 10.5 | 8.7 | 7.2 | 4.9 | 4.3 | 1.4 | 251 | 255 | 163 | 187 | 145 | 169 |
| 0.16 | – | – | – | – | – | – | 259 | 261 | 161 | 186 | 150 | 164 |
| 0.43 | – | – | – | – | – | – | 260 | 263 | 162 | 190 | 153 | 168 |
| 0.64 | – | – | – | – | – | – | 265 | 267 | 165 | 191 | 156 | 170 |
| 0.76 | – | – | – | – | – | – | 266 | 269 | 166 | 194 | 158 | 170 |
The temperature dependences of magnetization MZFC(T) and MFC(T) for the LSCO-900 under different pressures P and in the magnetic field H = 50 Oe (Figure 5) correspond to a typical behavior of the nanoparticles with FM and AFM inclusions, as well as with randomly oriented uniaxial magnetic anisotropy.55 From the temperature dependences of the extremum of the derivative of magnetic susceptibility d(M/H)/dT, where χ = M/H (see the insets in Figure 5), several characteristic phase transition temperatures were determined (Table 3). Noteworthy, four characteristic Curie temperatures TC1 = 251 K and TC3 = 163 K from FC and TC2 = 255 K and TC4 = 187 K from ZFC curves were defined as an example for the LSCO-900 without pressure P = 0 (see the insets in Figure 5). The observed difference between ZFC and FC Curie temperatures is associated with “pinning” magnetic moments on the magnetic inhomogeneities and structural defects, as well as the competing different magnetic exchange interactions.10,12,53,56 The obtained average ZFC and FC Curie temperatures 175 and 253 K indicate the presence of smaller and bigger nanoparticles in the LSCO-900.11,57 The highest Curie temperature, 253 K (P = 0), complies with other literature data 230 and 246 K for the same ceramic bulk composition.6 An additional contribution to the ZFC and FC curves at T < 187 K is due to the magnetization from smaller particles. As shown,11,57 a change in the Curie temperature TC value is caused by the particle size distribution. In our case, the change of the average Curie temperatures ∼ 1.4 times corresponds to the existence of bigger DXRD ≈ 60 nm (see Table 2) with TC = 253 K and smaller DXRD ≈ 43 nm with TC = 175 K nanoparticles. Moreover, the blocking temperature TB = 169 K, determined from the maximum temperature on the MZFC(T) curve, is observed for LSCO-900 (P = 0). At T < TB, the magnetic nanoparticles are in a blocked state. At TB ≤ T ≤ TC2, the thermal fluctuations of the magnetization exceed the difference in the spin states between two energy minima, and the magnetic nanoparticles are in an unblocked state. At T > TC2, the magnetic nanoparticles pass into the PM state. Additionally, an abnormal decreasing magnetization MZFC(T) at an AFM transition temperature TAFM is observed (Figure 5b) that is caused by AFM contribution of nanoparticles’ “dead” skin.53
Figure 5.
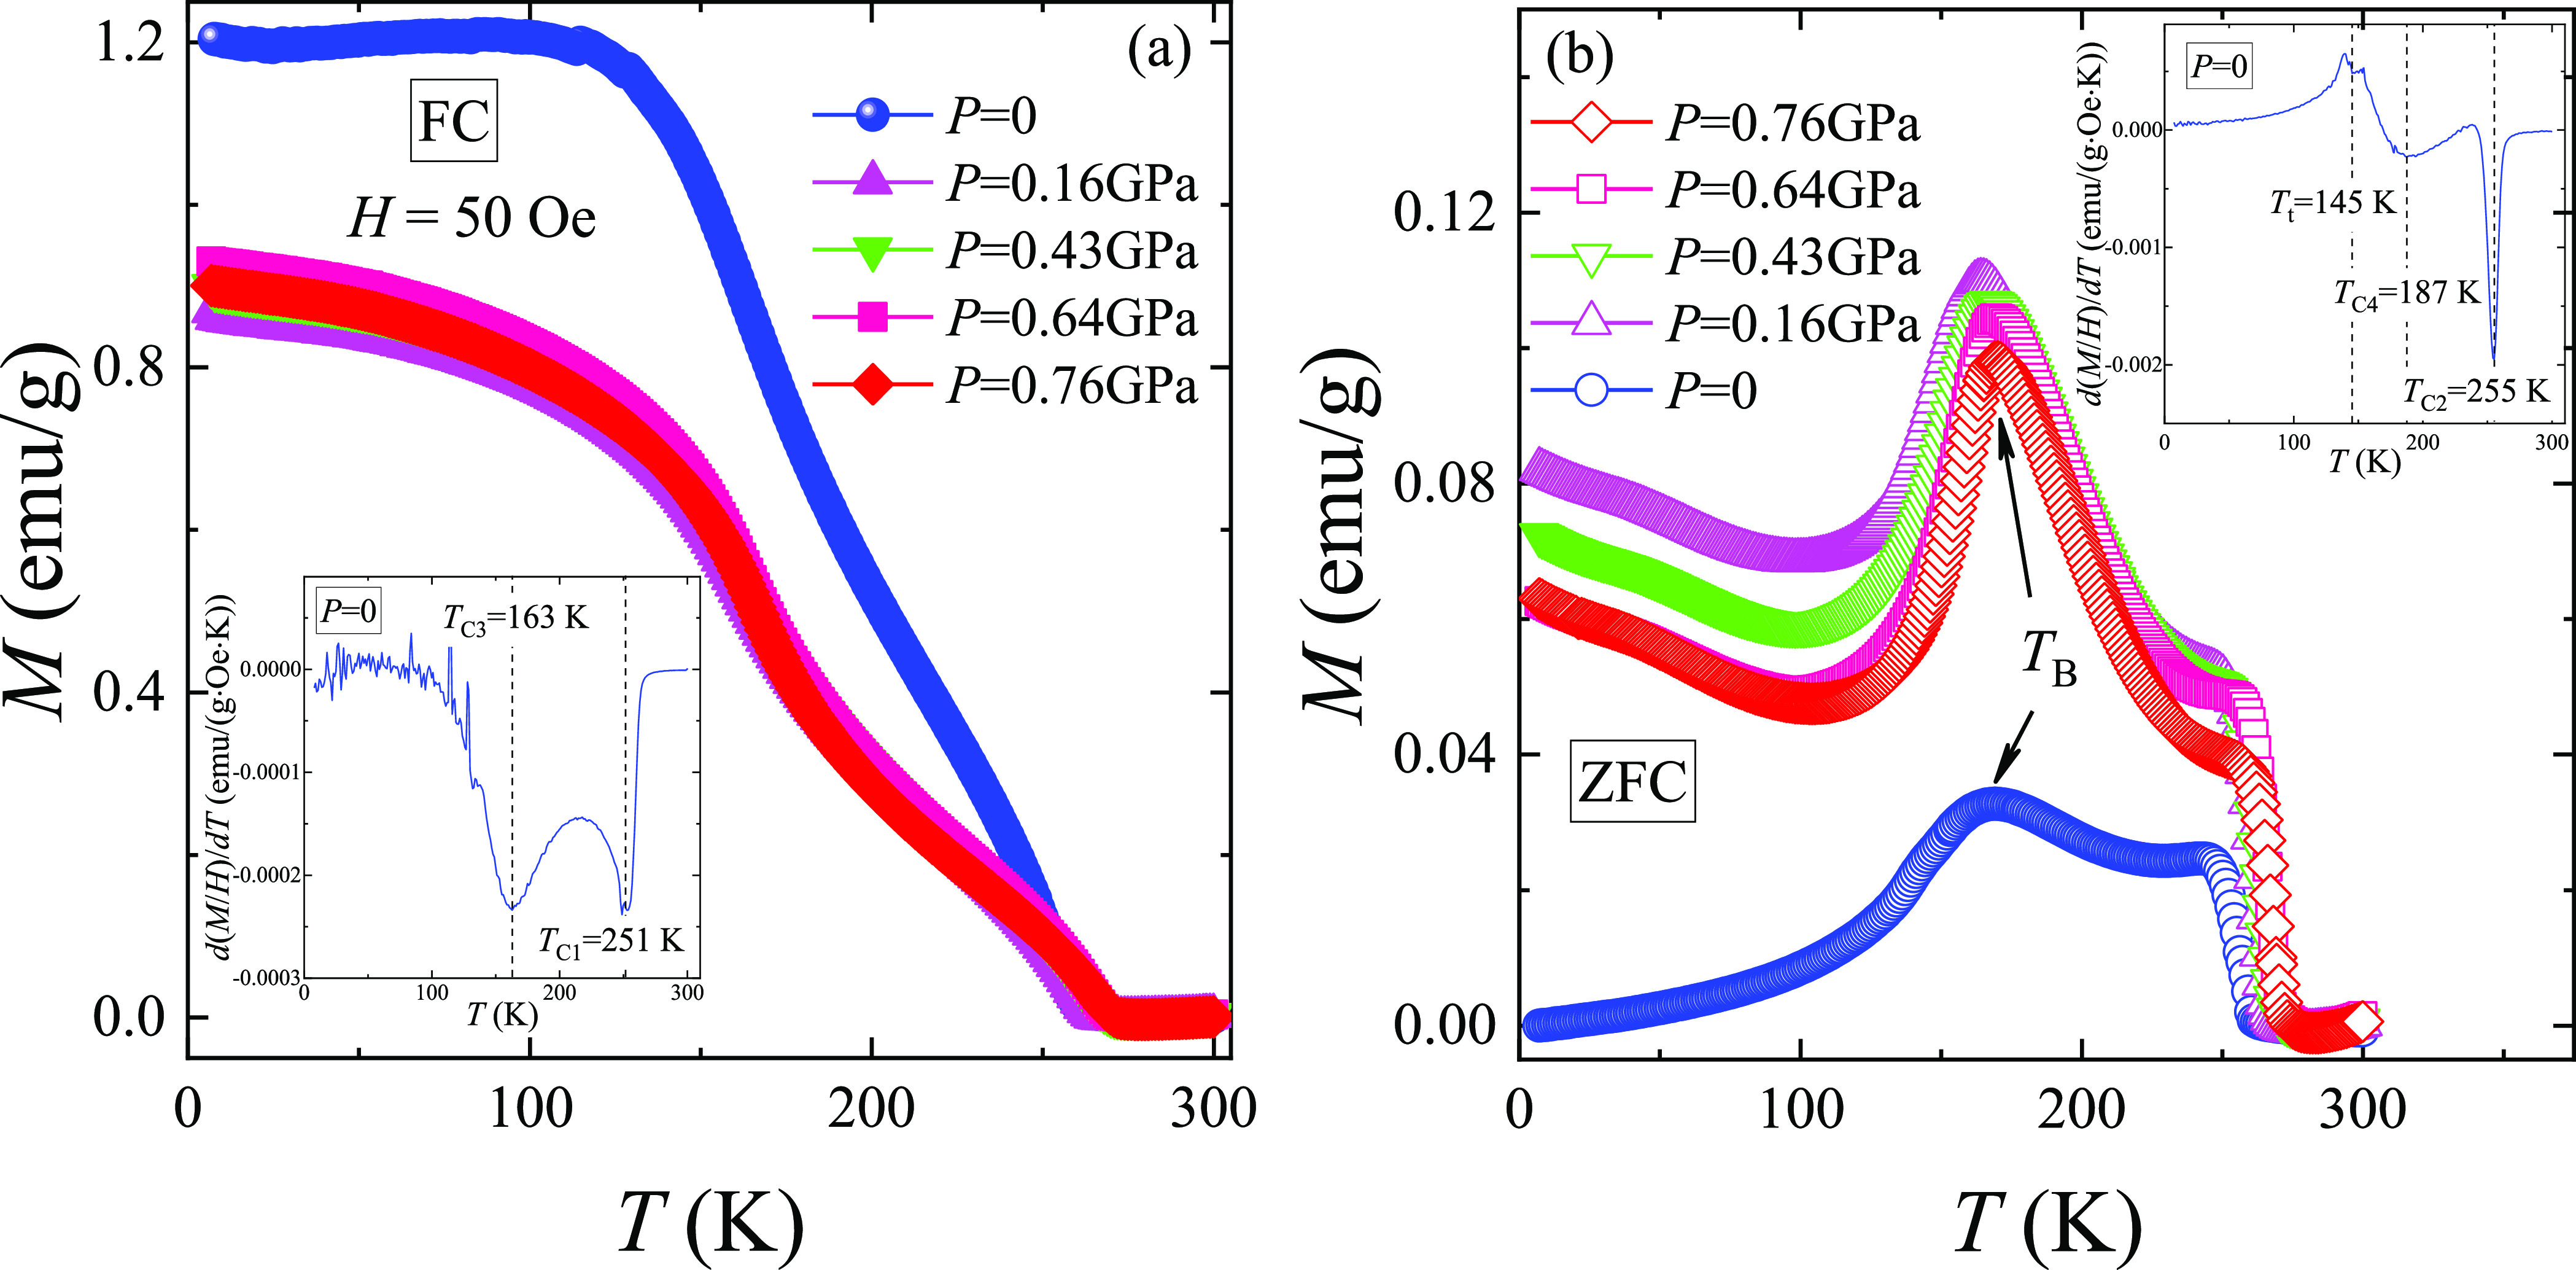
Temperature dependences of the magnetization (a) MFC(T) and (b) MZFC(T) for LSCO-900 under different pressures P and in the field of H = 50 Oe. The insets show the defined characteristic Curie temperatures (a) TC1 and TC3 and (b) TC2 and TC4, as well as (b) AFM transition temperature TAFM and blocking temperature TB.
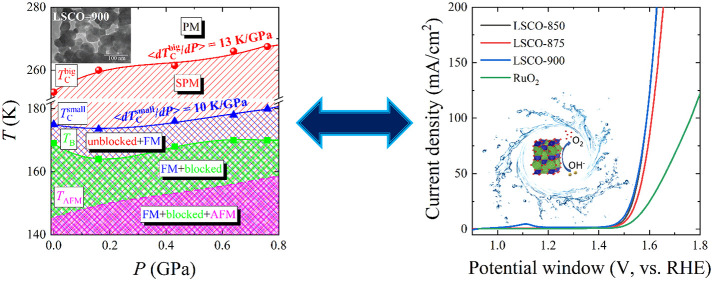
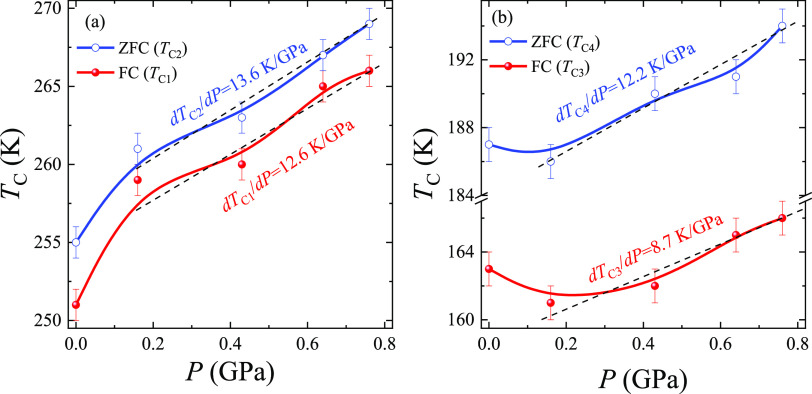
As pressure P increases, the FM and AFM subsystems become more magnetically homogeneous. The characteristic Curie temperatures TC1 and TC2 for bigger and TC3 and TC4 for smaller nanoparticles increase with a pressure rise (Table 3), indicating the strengthening of the FM DE Co3+–O2––Co4+. At the same time, the TAFM also increases, demonstrating the improvement of the AFM superexchanges Co3+–O2––Co3+ and Co4+–O2––Co4+, whereas the blocking temperature TB increases slightly (Table 3). The characteristic Curie temperatures show linear-like behavior versus pressure (Figure 6). It allows us to define an average ⟨dTC/dP⟩ ratio for smaller and bigger nanoparticles, 10 and 13 K/GPa, respectively. The obtained values show that larger nanoparticles are more sensitive to the external pressure P, and their magnetic parameters can be easily controlled.
Figure 6.
Pressure dependences of characteristic Curie temperatures (a) TC1 and TC2 and (b) TC3 and TC4 defined from the ZFC-FC curves for the LSCO-900. The dashed lines show linear behavior TC versus P.
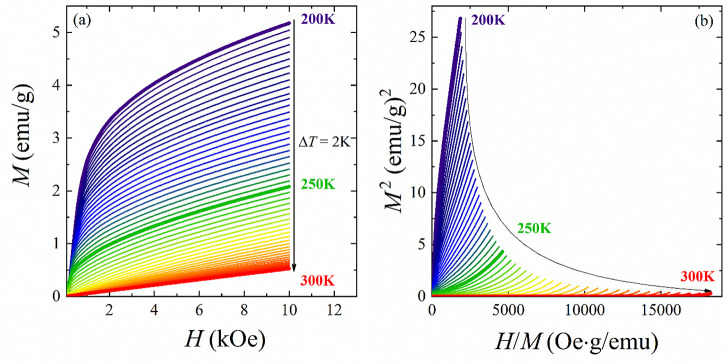
The isothermal magnetization curves M(H) around TC in a wide temperature range from 200 to 300 K with a ΔT = 2 K step for LSCO-900 are shown in Figure 7a. At T > TC, the magnetization increases linearly with an applied magnetic field, indicating the PM state of the sample. At T < TC, the linear isothermal magnetization behavior turns to a curve, which indicates passing to the FM state. At the same time, the magnetization cannot be saturated even at lower temperatures and higher magnetic fields, probably because of AFM phase contribution.58 According to the Banerjee criterion,59 the positive slope of Arrott’s curves M2(H/M) (see Figure 7b) near the Curie temperature is observed, which indicates a second-order magnetic phase transition for the LSCO-900.
Figure 7.
(a) Isotherms of magnetization M(H) and (b) Arrott’s plots M2(H/M) within 200–300 K with a ΔT = 2 K step for the LSCO-900.
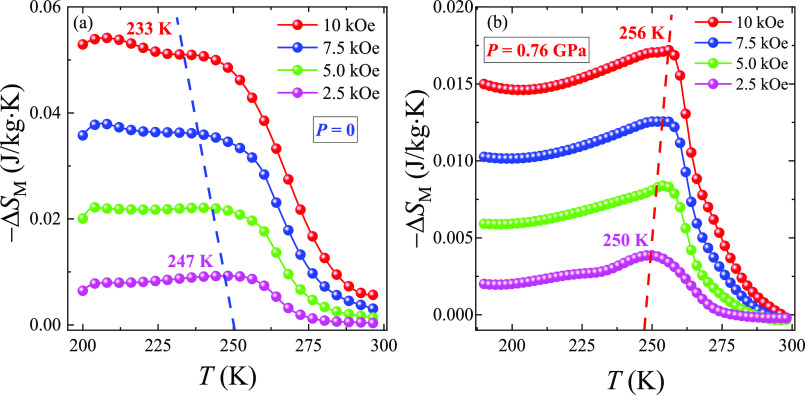
The temperature dependences of the magnetic entropy change −ΔSM(T, H) near phase transition(s) (Figure 8) were plotted using the isotherms of magnetization M(H) and the numerical integration method of the Maxwell relation:60
| 1 |
The magnetic entropy change −ΔSM(T, H) shows a vast indistinct peak with relatively low values of MCE. Upon application of the external high hydrostatic pressure P ≈ 0.8 GPa and with increasing the magnetic field ΔH up to 10 kOe, the MCE peak position moves toward higher temperatures from 250 to 256 K, indicating the domination of the FM DE over AFM superexchange interactions, whereas without pressure P = 0 we have the opposite situation with temperature reducing from 247 to 233 K (Figure 8). Moreover, the δTfwhm for the −ΔSMmax is far greater than 50 K, making the studied LSCO-900 a promising component for creating magnetic refrigerant composites in a wide temperature range.
Figure 8.
Temperature dependences of magnetic entropy change −ΔSM(T) (a) without pressure, P = 0, and (b) under high pressure, P ≈ 0.8 GPa in the magnetic field ΔH up to 10 kOe for the LSCO-900.
3.3. Electrocatalytic Properties
As mentioned in the introduction, interest in Ln- and Co-containing perovskites as electrocatalysts for OER in an alkaline environment has increased significantly recently.19,21−27,32−35 In order to find out the OER activity for water splitting of the prepared LSCO samples, electrochemical tests were carried out in 1 M KOH electrolyte (pH 14) with the following sequence: multiple current–voltage (CV) scans (until stable electrode operation is achieved), alternative current (AC) impedance, recording of LSV curves with iR correction, long-term chronopotentiometry tests (at a current density of 10 mA·cm–2) and reregistration of LSV curves. It should be emphasized that Co- and Ni-containing complex oxides can be entirely or partially in situ transformed into oxides/hydroxides due to electrochemical processes in an alkaline medium.61,62 Accordingly, after a long electrochemical treatment, we investigated the electrode materials to verify the stability of the LSCO catalysts.
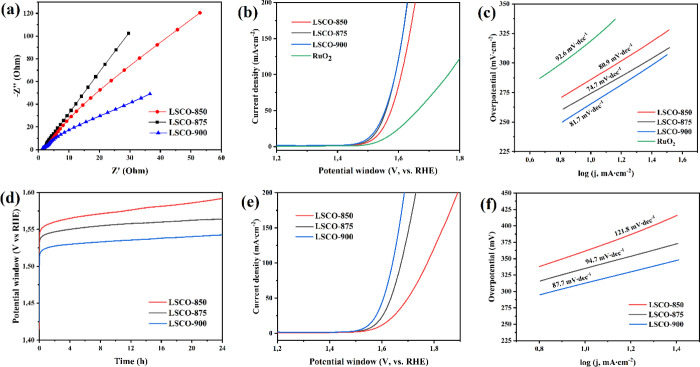
Before the electrochemical test, the manufactured electrodes were placed in an electrolyte environment for 1 h to establish equilibrium at the electrode–electrolyte interface. As shown in Figure S2, for all samples the shape of the CV curves in the range of 0.9–1.8 V is similar at the corresponding scanning rate (from 1 to 50 mV s–1). Only the peak around 1.3 V (anodic scans) is clearly observed, corresponding to the Co4+ → Co3+ transformation.39 As AC impedance measurements show (Figure 9(a)), the LSCO-900 sample has the best conductivity.
Figure 9.
Electrochemical testing for the LSCO electrodes in 1 M KOH: (a) Nyquist plots; (b, c) LSV curves and Tafel plots before the long-term stability test for the LSCO catalysts and RuO2 at a scan rate of 1 mV s–1 (iR-compensation 90%); (d) time dependence of potential under a constant current density of 10 mA cm–2; (e, f) LSV curves and Tafel plots after the long-term stability test at a scan rate of 1 mV s–1.
Nyquist plots correspond to the equivalent circuit and fitting parameters using ZView software, which includes series resistance Rs, the double layer capacitance at the active material/electrolyte interface Cdl, electron transfer resistance Rct, and the diffusion impedance Warburg impedance (Figure S3). The results of the fitting are presented in Table S2. The impedance spectra include two parts, a line in a low-frequency region and a semicircle in a high-frequency region. The numerical value of the diameter of the semicircle on the Z0 axis is approximately equal to the charge transfer resistance Rct, and the sloping line corresponds to Warburg impedance, which is associated with electrolyte diffusion in electrode materials. As known, the Helmholtz double layer capacitance Cdl appears due to the porosity of the active material and the uneven distribution of the current on the electrode surface.17,18,63 The double-layer capacitance Cdl was estimated by eq S3 plotting the Δj versus RHE as a function of the scan rate (Figure S4e–h). Figure S4 shows CV curves recorded in the potential windows from 0 to 0.1 V vs Hg/HgO at a scan rate of 1–10 mV s–1. The electrochemically active surface area (ECSA) can be calculated from the Cdl using eq S4 (see SI 2). In this case, CC-based with the Super P electrode can be accepted as a standard, showing the measured capacitance of 36.59 mF cm–2. The ECSA values of LSCO-850, LSCO-875, and LSCO-900 are 15.97 cm2, 17.26 cm2, and 24.53 cm2, respectively. It is known that the ECSA value corresponds to the number of potential active sites for electrocatalysis and Rct is inversely proportional to electrochemical activity. A low charge transfer resistance and high ECSA indicate good electronic conductivity and a high rate of OH ion transfer across the boundaries between the electrolyte and active electrode materials. The above AC impedance results show that the LSCO-900 has the attributes of an efficient electrocatalyst for OER in an alkaline environment.
According to onset LSV measurements, all LSCO samples exhibited highly efficient electrocatalytic activity for alkaline OER and a slow boost of current density with an increase of applied potential (Figure 9b). The obtained overpotential values’ intervals were only 265–285 and 360–380 mV when reaching a current density of 10 and 100 mA cm–2, respectively (more details are given in Table S3). In addition, the intrinsic per-site activity of the electrocatalysts is studied by the turnover frequency (TOF), which accurately describes the activity of electrode materials. Therefore, higher values correspond to a large electrolyte-electrode interface and good OH diffusion and indicate excellent electrochemical performance.18 In this way, values for the LSCO samples have been calculated (details in the SI and Figures S5 and S6). The LSCO-900 material demonstrates a high intrinsic activity of about 0.11–0.34 s–1 at 300–350 mV (1.53–1.58 V vs RHE), corresponding to the high intrinsic activity compared to other samples.
The LSV curves for the LSCO-900 and LSCO-875 electrodes are almost identical, and the overpotential of the OER for the LSCO-850 is slightly higher. It is essential that the commercial electrocatalyst of noble metal oxide (RuO2), used for comparison, showed worse activity. These results confirm the calculations of the Tafel slope (Figure 9c): for the synthesized LSCO samples, the range of values is 74–82 mV dec–1, and for commercial RuO2 it is slightly more than 92 mV dec–1. The subsequent long-term test of electrodes during continuous electrolysis (current density of 10 mA cm–2) is presented in Figure 9d. The continuous formation of oxygen bubbles on the surface of the electrodes was observed when the stability tests were carried out. For all samples, an increase in overpotential OER is observed during the first 4 h of the chronopotentiometry test, and the values of η10 reach 300, 320, and 335 mV for LSCO-900, LSCO-875, and LSCO-850, respectively. However, the activity of the electrocatalysts decays much more slowly during the next 20 h of electrolysis, especially in the case of the LSCO-900 sample (the magnitude of the overpotential increases by only 12 mV); these results for all electrodes are presented in Table S4. The slight increase in voltage after 4 h of the test proves the final stabilization of all electrodes and the high efficiency of the LSCO materials as OER catalysts. It should also be considered that carbon fiber (the base of the electrode used in this study) is gradually destroyed in an alkaline environment under OER conditions.62 It leads to breakdowns of the interface between the catalyst and collector electrode and is an additional factor in the growth of overpotential OER during long-term tests. LSV curves measured after long-term stability tests (Figure 9e) are in good agreement with CP results: the values of overpotential η10 for the corresponding samples are identical (Tables S3 and S4). Reregistration LSV measurements revealed that in the range of current densities from 10 to 100, the OER overvoltage increased by only 14–17% for the LSCO-900 electrode, while for the LSCO-875 and LSCO-850, the changes were 22–24 and 27–44%, respectively (Table S3). Calculation of the Tafel slope after long-term electrolysis (Figure 9f) also indicates the preservation of the high catalytic activity of the LSCO-900 material, in contrast to the LSCO-875 and especially LSCO-850 samples.
Electrode materials were also studied in detail after the CP tests. According to XRD, all LSCO samples retained their crystallinity. As shown in Figure S7, the diffraction patterns show reflections from both crystalline phases (La0.6Sr0.4CoO3 and SrCo0.78O2.48). It proves the high stability of Ln and Co-containing complex oxides in an alkaline environment during long-term electrolysis, in contrast to similar Mn-containing compounds.11
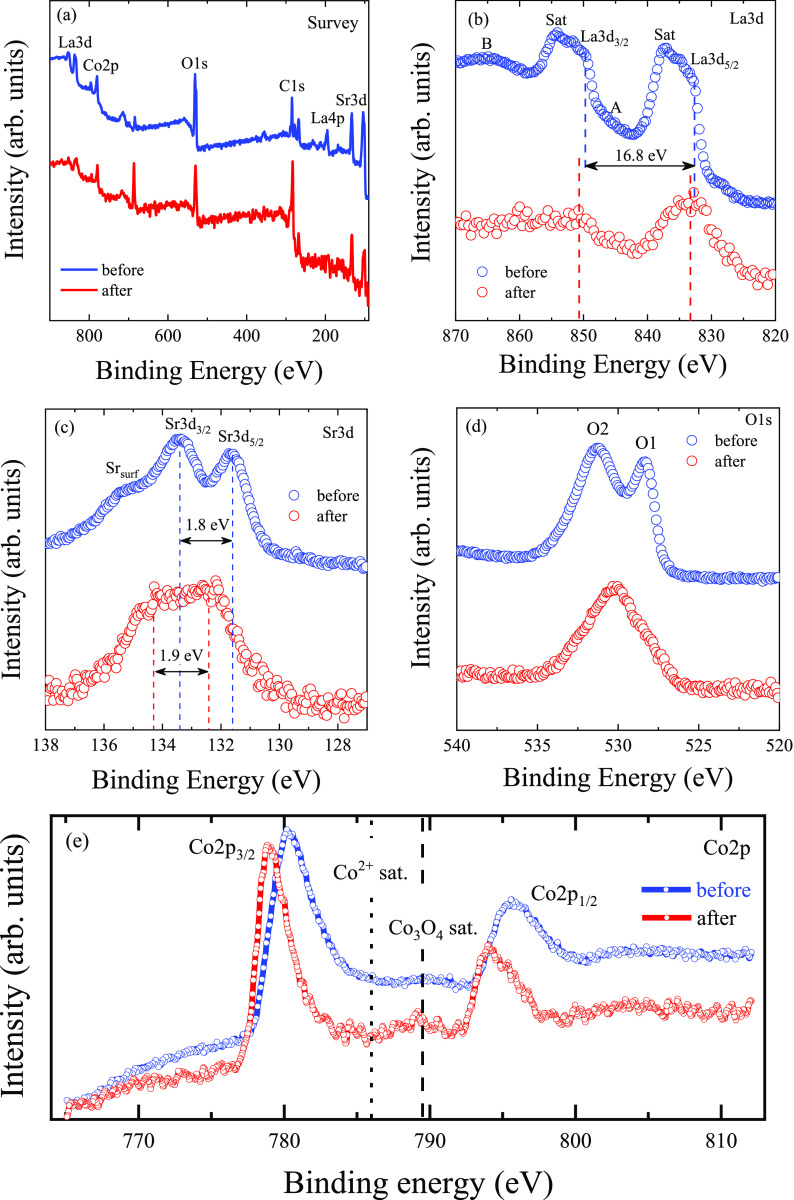
The survey spectra of the LSCO-900 samples before and after electrocatalysis show the existence of La, Sr, Co, and O peaks (Figure 10a). Nevertheless, the XPS spectra revealed some differences. All peak positions for the La, Sr, and O ions are listed in Table 4.
Figure 10.
XPS spectra for the LSCO-900 samples before and after electrocatalysis: (a) survey spectra; (b) La 3d spectra with A and B features from charge transfer satellites, plasmon lines, and MNN Auger lines; (c) Sr 3d spectra with spin–orbit splitting Sr 3d5/2 and Sr 3d3/2; (d) O 1s spectra with O1 lattice oxygen and O2 adsorbed oxygen on the surface components; and (e) Co 2p spectra (the dashed and dotted lines indicate the energy position of the Co3O4 and Co2+ satellite peaks, respectively).
Table 4. Energy positions of the La 3d, Sr 3d, and O 1s X-ray photoelectron lines in the LSCO-900 samples before and after electrocatalysis.
| binding
energy (eV) |
|||||||||
|---|---|---|---|---|---|---|---|---|---|
|
La 3d |
Sr 3d |
O 1s |
|||||||
| electrocatalysis | La 3d5/2 | Sat | La 3d3/2 | Sat | Srlat5/2 | Srlat3/2 | Srsurf | O1 | O2 |
| before | 832.9 | 837.4 | 849.7 | 854.3 | 131.6 | 133.4 | 135.2 | 528.4 | 531.2 |
| after | 833.3 | 850.9 | 132.4 | 134.3 | – | 530.3 | |||
In the XPS spectra of the La 3d, two major peaks, corresponding spin doublet La 3d5/2 and La 3d3/2, are observed (Figure 10b). However, the spectra have a more complex profile due to charge transfer satellites, plasmon lines, and MNN Auger lines (marked A and B in Figure 10b). Similar results are also observed for the XPS spectrum of La2O3.64 The binding energy positions for the LSCO-900 before electrocatalysis are 832.9 eV (La 3d5/2) and 849.7 eV (La 3d3/2), with a difference of 16.8 eV, which agrees with the standard deviation.64 Noteworthy, the XPS spectrum for LSCO-900 after electrocatalysis is transformed to single-peaks with binding energies of 833.3 eV (La 3d5/2) and 850.9 eV (La 3d3/2). It is associated with the amorphization of the LSCO-900 surface and the appearance of chemical defects due to a positive core-level shift of 0.4–1.2 eV.35
Figure 10c shows Sr 3d spectra, which exhibit two main components from the perovskite lattice-bound Srlat at binding energies of 131.6 eV (Sr 3d5/2) and 133.4 eV (Sr 3d3/2) for LSCO-900 before electrocatalysis. In addition, a shoulder with higher binding energies of 135.2 eV from surface Srsurf is also presented, which is usually associated with surface strontium-rich phases often observed for LSCO materials.41 After electrocatalysis, there is a redistribution of intensity between the main Srlat spectral lines, small peaks position shifting, and hiding and/or disappearing of Srsurf component (Table 4).
As for O 1s XPS before electrochemical tests (Figure 10d), two components with energy positions of about 528.4 eV (O1) and 531.2 eV (O2) can be clearly distinguished in the spectrum (Table 4), which may be attributed to the lattice oxygen and adsorbed oxygen on the surface, respectively.35 After electrochemical tests, the O 1s profile is modified significantly to a single broad peak with an energy position of about 530.3 eV. Such a redistribution in the intensities of the peaks, as well as variation in their shape and positions, indicates the transformation of the LSCO-900 surface.
Changes are also observed for the XPS spectra of Co 2p (Figure 10e): exhibit two prominent peaks at around 780.1 and 795.6 eV for the electrode before and at around 778.8 and 794.0 eV after electrocatalysis, corresponding to the Co 2p3/2 and Co 2p1/2 states, respectively. It should be noted that for LSCO-type materials, the position of the Co 2p peaks has a metallic character and is practically unchanged for compounds with different strontium content.65 After electrocatalysis, the surface layer of LSCO is significantly transformed (Figure 10e): (1) the Co 2p peaks are shifted toward lower energy ∼ 1.3–1.6 eV; (2) the simultaneous reducing Co2+ satellite peak around ∼786.0 eV and, as a result, its content and increasing Co3O4 satellite peak ∼789.0 eV, consisting of the mixed Co2+ and Co3+ states, are observed, which gives evidence about the formation of a new surface;41 (3) the full-width at half-maximum (fwhm) of the Co 2p3/2 main peak reduces ∼2.0 eV, suggesting more Co3+ and fewer Co2+ ions on the surface.66
Such significant changes in La 3d, Sr 3d, O 1s, and Co 2p XPS spectra indicate the complex nature of transformations on the surface of LSCO-900 during OER in an alkaline environment and is an indirect confirmation of the amorphization of the catalyst surface as recently shown in work.41
SEM and elemental mapping of the electrode surface after prolonged electrolysis (Figures S8–10) mostly show nanoparticles as in the initial LSCO material, which agrees with the elemental mapping (Figure S9). This morphology is characteristic of cobalt hydroxide, CoO(OH), which can be produced in situ during the electrochemical destruction of complex oxides in an alkaline environment.39 According to the work,41 the mechanism of destruction of LSCO material involves the formation of mixed surface phases: the formation of the self-assembled active CoO(OH) phase, the relative enrichment of passivating La(OH)3, and the leaching of Sr(OH)2. In our case, a similar way of transformation is implemented only partially. First, the surface areas of CoO(OH) formation are only a small number of fragments, and second, according to XPS, the peak from Srsurf still remains after electrocatalysis. TEM results for the LSCO-900 nanoparticles before and after electrolysis are shown in Figures S11 and S12. It should be noted that the TEM images demonstrate the formation of an additional thin amorphized layer on the surface of the particles after electrolysis. SAED images confirm the crystalline state of the catalyst (Figure S11). In addition, the ring diffraction pattern of the LSCO-900 sample after prolonged electrolysis additionally confirms the presence of an amorphized phase (see SI for more details). Accordingly, the consequence of electrochemical transformations is the formation of an amorphized layer on the surface of LSCO, which should be described as forming a stable core–shell system.
Table 5 lists the comparative characteristics of the OER for electrocatalysts based on La, Co-containing perovskites in an alkaline electrolyte. Among them, the LSCO material described here occupies a leading position. It should be noted that very recently, it was reported that the amorphization of crystallized nanometer perovskite LaCoO3 to a highly disordered state leads to improved electrocatalytic properties of OER.35 In our case, a highly active amorphized layer is formed on the surface of the LSCO nanoparticles during electrolysis. The catalytic activity increases with increasing proportion of this crystalline phase for a number of LSCO-850, LSCO-875, and LSCO-900 samples. However, the role of the second phase, SrCo0.78O2.48, can also be very important. It is known that less active perovskite catalysts often remain crystalline during OER, while more active ones undergo amorphization.38 It can be assumed that the destruction of SrCo0.78O2.48 is slower than that of LSCO, which leads to the stabilization of the amorphized layer. It can prevent further degradation of the nanoparticles, protect the initial morphology and provide a significant electroactive surface area for a long time. However, this assumption needs further experimental verification, including using similar multiphase samples. Finally, forming in situ core–shell nanostructures based on perovskites is a potentially successful strategy for creating highly active and stable electrocatalysts.
Table 5. Comparison of OER Properties for LaCo-based Electrocatalysts in Alkaline Electrolyte.
| catalyst | electrolyte | η10(mV) | Tafel slope | ref |
|---|---|---|---|---|
| LSCO-900 | 1 M KOH | 265 | 81.7 | this work |
| 312a | 87.7a | |||
| LSCO-850 | 1 M KOH | 275 | 74.7 | this work |
| 335a | 94.7a | |||
| LSCO-875 | 1 M KOH | 285 | 80.9 | this work |
| 362a | 121.8a | |||
| LaCoO3–Reduce | 1 M KOH | 293 | 63.4 | (35) |
| La0.5Pr0.5CoO3 | 1 M KOH | 312 | 80.6 | (19) |
| La(Co0.71Ni0.25)0.96O3 | 0.1 M KOH | 324 | 71 | (20) |
| La(CrMnFeCo2Ni)O3 | 1 M KOH | 325 | 51.2 | (21) |
| La0.7Sr0.3CoO3-P | 1 M KOH | 326 | 70.8 | (22) |
| Cl-LaCoO3 | 1 M KOH | 342 | 76.2 | (33) |
| (La0.776Sr0.224)0.9(Co0.087Fe0.84Ru0.073)1.026O3-δ | 1 M KOH | 347 | 54.7 | (23) |
| La-CoOx | 0.1 M KOH | 353 | 78.2 | (32) |
| La0.4Sr0.6Co0.7Fe0.2Nb0.1O3-δ | 0.1 M KOH | 360 | 78 | (24) |
| La0.9CoO3-δ | 0.1 M KOH | 380 | 82.5 | (67) |
| La0.96Ce0.04CoO3 | 1 M KOH | 380 | 80 | (25) |
| La0.6Sr0.4Co0.8Fe0.2O3 | 0.1 M KOH | 385 | 76.7 | (26) |
| LaCoO3 | 0.5 M KOH | 396 | 144.8 | (68) |
| Pt/LaCoO3 | 1 M KOH | 327 | 92 | (34) |
| LaMn0.4Co0.6O3 | 1 M KOH | 400 | 95 | (27) |
| La0.699Sr0.301Co0.702Fe0.298O2.92 | 1 M KOH | 440 | 109 | (28) |
| LaCoO3 | 0.1 M KOH | 490 | 69 | (30) |
After 24 h of incessant electrolysis (current density 10 mA cm–2).
Finally, based on the above-mentioned results, the interconnection between magnetic and electrocatalytic properties of the LSCO nanoparticles can be established, including additionally the magnetic properties of the LSCO-900 sample before and after long-term electrolysis (see SI 2 and Figure S13 for more details). As it turned out, the material demonstrates the same behavior of magnetization M with almost unchanged phase transition temperatures (Curie and blocking temperatures). Moreover, the change in the sample surface and its modification is confirmed, manifesting in the relative change of the magnetization ΔM/Mmax by 35% under FC and 10% under ZFC regimes at 50 K. Similar behavior was also observed for La0.9Mn1.1O3−δ manganites annealed under different temperatures, but in the K2SO4 (0.5 M) media.12 Thus, despite testing the LSCO-900 sample in rigid media and further transforming its surface and structure, this material still demonstrates its magnetic properties, indicating its multifunctionality. In other words, the cobaltite nanoparticles retain their practical potential to be used simultaneously for both magnetic and electrocatalytic purposes.
4. Conclusions
The structure, morphology, particle size distribution, and magnetic phase transitions, as well as magnetic, magnetocaloric, and electrochemical properties of the LSCO nanopowders obtained under different annealing temperatures tann = 850, 875, and 900 °C, have been studied comprehensively. All samples indicate a rhombohedral R3̅c perovskite structure, improving its single-phase nature with increasing tann. At the same time, it leads to increasing unit cell volume V, an average particle size D, and its dispersion σ. The LSCO-900 composition mainly consists of the Co3+ and Co4+ ions, as well as minor Co2+ and Co3O4 traces that play a crucial role in forming magnetic and electrochemical properties. The main magnetic parameters such as spontaneous magnetization MS, coercivity HC, residual magnetization Mr, phase transition temperatures, and magnetic entropy change – ΔSM have been defined. The LSCO-900 sample is a ferromagnet with a high HC of 4.3 kOe. It has been found that LSCO-900 exhibits two characteristic Curie temperatures, TC1 and TC2, which are associated with the presence of nanoparticles of different sizes. Additionally, FM and AFM subsystems are stabilized and become more magnetically homogeneous because of applied external hydrostatic high-pressure P. As pressure increases, the average ⟨TC1⟩and ⟨TC2⟩ increase from 253 and 175 K under ambient pressure to 268 and 180 K under P ≈ 0.8 GPa, respectively. At the same time, the AFM transition temperature TAFM and blocking temperature TB also increase from 145 and 169 K to 158 and 170 K, respectively. The rise of ⟨dTC1/dP⟩ for bigger particles and ⟨dTC2/dP⟩ for smaller particles differs and is 13 and 10 K/GPa, respectively. The MCE in the LSCO-900 nanopowder is near the Curie temperature and has a second-order phase transition. The values of −ΔSM are quite low and equals 0.05 J/kg K without pressure and 0.017 J/kg K under P ≈ 0.8 GPa in the magnetic field 1 T, but with extremely wide peak δTfwhm > 50 K.
The obtained series of the LSCO nanomaterials showed excellent characteristics as electrocatalysts for the OER process in a 1 M KOH electrolyte. The values of the initial overpotential of oxygen generation were within 265–285 mV (a current density of 10 mA/cm2), and the sample with the highest content of the La0.6Sr0.4CoO3 phase showed the best performance. The LSCO materials described here retain high catalytic activity during long-term electrolysis, which should be attributed to the formation of a stable amorphization layer on the surface of nanoparticles. Accordingly, a significant area of the catalytically active surface, resulting from the emergence of stable core–shell nanosystems, can ensure a high efficiency of practical use of the material.
The parallel study of nanopowders’ physical and electrocatalytic properties in this work made it possible to establish the physical and chemical basis of the various samples obtained at different tann values and find ways to obtain materials for practical application in electrocatalysis. For instance, the research of magnetic and magnetocaloric properties of the samples opens up the possibility of changing the conditions of catalysis by contactless heating or cooling the temperature of electrodes and electrolytes using the MCE. Moreover, using the alternating field can increase the temperature of electrodes.
Acknowledgments
This research was financially sponsored by the European Federation of Academies of Sciences and Humanities within the framework of the “European Fund for Displaced Scientists” (Grant reference number EFDS-FL2-05). It was also supported by the Major Science and Technology Infrastructure Project of Material Genome Big-science Facilities Platform supported by the Municipal Development and Reform Commission of Shenzhen. Additionally, Dr. Igor Fesych is grateful to the National Research Fund of Ukraine (project “Low-dimensional graphene-like transition metal dichalcogenides with controllable polar and electronic properties for advanced nanoelectronics and biomedical applications”, grant application 2020.02/0027) for the support.
Supporting Information Available
The Supporting Information is available free of charge at https://pubs.acs.org/doi/10.1021/acsami.3c06413.
SI1, determination of the size of the coherent scattering region in the La0.6Sr0.4CoO3 nanopowders; SI2, electrochemical properties of the LSCO nanopowders (PDF)
Author Contributions
H.Y.: Writing - original draft, Data curation, Investigation, Methodology. N.L.: Writing - review and editing, Conceptualization, Data curation, Investigation. I.Z.: Writing - review and editing, Data curation, Conceptualization, Investigation. D.B.: Writing - review and editing, Data curation, Investigation, Methodology. I.F.: Data curation, Investigation, Methodology. W.X.: Data curation, Investigation, Methodology. C.S.: Data curation, Investigation, Methodology. Q.L.: Data curation, Investigation, Methodology. B.L.: Data curation, Investigation, Methodology. A.P.: Data curation, Methodology. G.L.: Writing - review and editing, Supervision.
The authors declare no competing financial interest.
Supplementary Material
References
- Alhokbany N.; Almotairi S.; Ahmed J.; Al-Saeedi S. I.; Ahamad T.; Alshehri S. M. Investigation of Structural and Electrical Properties of Synthesized Sr-doped Lanthanum Cobaltite (La1–xSrxCoO3) Perovskite Oxide. Journal of King Saud University-Science 2021, 33 (4), 101419. 10.1016/j.jksus.2021.101419. [DOI] [Google Scholar]
- Sikolenko V.; Sazonov A.; Troyanchuk I.; Többens D.; Zimmermann U.; Pomjakushina E.; Szymczak H. Magnetic Properties of La1–xSrxCoO3 (x = 0.15 and 0.3). J. Phys.: Condens. Matter 2004, 16 (41), 7313. 10.1088/0953-8984/16/41/012. [DOI] [Google Scholar]
- Hoffmann M.; Borisov V. S.; Ostanin S.; Mertig I.; Hergert W.; Ernst A. Magnetic Properties of Defect-Free and Oxygen-Deficient Cubic SrCoO3-δ. Phys. Rev. B 2015, 92 (9), 094427 10.1103/PhysRevB.92.094427. [DOI] [Google Scholar]
- Loshkareva N.; Gan’shina E.; Belevtsev B.; Sukhorukov Y. P.; Mostovshchikova E.; Vinogradov A.; Krasovitsky V.; Chukanova I. Optical, Magneto-Optical and Transport Properties of La1-xSrxCoO3 (x = 0.15; 0.25; 0.35) Films: Spin-State Transition Effects. J. Magn. Magn. Mater. 2003, 258, 277–279. 10.1016/S0304-8853(02)01080-6. [DOI] [Google Scholar]
- Wu J.; Leighton C. Glassy Ferromagnetism and Magnetic Phase Separation in La1-xSrxCoO3. Phys. Rev. B 2003, 67 (17), 174408. 10.1103/PhysRevB.67.174408. [DOI] [PubMed] [Google Scholar]
- Xie Q.; Wu Z.; Wu X.; Tan W. Sr Content on the Structure and Magnetic Properties of La1-xSrxCoO3. J. Alloys Compd. 2009, 474, 81–85. 10.1016/j.jallcom.2008.06.045. [DOI] [Google Scholar]
- Bellino M. G.; Sacanell J. G.; Lamas D. G.; Leyva A. G.; Walsöe de Reca N. E. High-Performance Solid-Oxide Fuel Cell Cathodes Based on Cobaltite Nanotubes. J. Am. Chem. Soc. 2007, 129 (11), 3066–3067. 10.1021/ja068115b. [DOI] [PubMed] [Google Scholar]
- Gwon O.; Yoo S.; Shin J.; Kim G. Optimization of La1-xSrxCoO3-δ Perovskite Cathodes for Intermediate Temperature Solid Oxide Fuel Cells through the Analysis of Crystal Structure and Electrical Properties. Int. J. Hydrogen Energy 2014, 39 (35), 20806–20811. 10.1016/j.ijhydene.2014.07.137. [DOI] [Google Scholar]
- Pashchenko A.; Liedienov N.; Fesych I.; Li Q.; Pitsyuga V.; Turchenko V.; Pogrebnyak V.; Liu B.; Levchenko G. Smart Magnetic Nanopowder Based on the Manganite Perovskite for Local Hyperthermia. RSC Adv. 2020, 10 (51), 30907–30916. 10.1039/D0RA06779B. [DOI] [PMC free article] [PubMed] [Google Scholar]
- Pashchenko A.; Liedienov N.; Pashchenko V.; Prokopenko V.; Burhovetskii V.; Voznyak A.; Fesych I.; Tatarchuk D.; Didenko Y.; Gudymenko A.; et al. Modification of Multifunctional Properties of the Magnetoresistive La0. 6Sr0.15Bi0.15Mn1.1-xBxO3-δ Ceramics when Replacing Manganese with 3d-Ions of Cr, Fe, Co, Ni. J. Alloys Compd. 2018, 767, 1117–1125. 10.1016/j.jallcom.2018.07.178. [DOI] [Google Scholar]
- Wei Z.; Pashchenko A.; Liedienov N.; Zatovsky I.; Butenko D.; Li Q.; Fesych I.; Turchenko V.; Zubov E.; Polynchuk P. Y.; et al. Multifunctionality of Lanthanum–Strontium Manganite Nanopowder. Phys. Chem. Chem. Phys. 2020, 22 (21), 11817–11828. 10.1039/D0CP01426E. [DOI] [PubMed] [Google Scholar]
- Gong Z.; Xu W.; Liedienov N.; Butenko D.; Zatovsky I.; Gural’skiy I.; Wei Z.; Li Q.; Liu B.; Batman Y. A.; et al. Expansion of the Multifunctionality in Off-Stoichiometric Manganites using Post-Annealing and High Pressure: Physical and Electrochemical Studies. Phys. Chem. Chem. Phys. 2022, 24 (36), 21872–21885. 10.1039/D2CP01959K. [DOI] [PubMed] [Google Scholar]
- Saadaoui F.; M’nassri R.; Omrani H.; Koubaa M.; Boudjada N. C.; Cheikhrouhou A. Critical Behavior and Magnetocaloric Study in La0. 6Sr0.4CoO3 Cobaltite Prepared by a Sol–Gel Process. RSC Adv. 2016, 6 (56), 50968–50977. 10.1039/C6RA08132K. [DOI] [Google Scholar]
- Rao C.; Parkash O.; Bahadur D.; Ganguly P.; Nagabhushana S. Itinerant Electron Ferromagnetism in Sr2+-, Ca2+-, and Ba2+-Doped Rare-Earth Orthocobaltites (Ln3+1-xM2+xCoO3). J. Solid State Chem. 1977, 22 (3), 353–360. 10.1016/0022-4596(77)90011-1. [DOI] [Google Scholar]
- Bhoi D.; Khan N.; Midya A.; Nandi M.; Hassen A.; Choudhury P.; Mandal P. Formation of Nanosize Griffiths-Like Clusters in Solid Solution of Ferromagnetic Manganite and Cobaltite. J. Phys. Chem. C 2013, 117 (32), 16658–16664. 10.1021/jp402726f. [DOI] [Google Scholar]
- Zhu Y.; Zhou W.; Chen Z. G.; Chen Y.; Su C.; Tadé M. O.; Shao Z. SrNb0.1Co0.7Fe0.2O3-δ Perovskite as a Next-Generation Electrocatalyst for Oxygen Evolution in Alkaline Solution. Angew. Chem. 2015, 127 (13), 3969–3973. 10.1002/ange.201408998. [DOI] [PubMed] [Google Scholar]
- Yan L.; Xie B.; Yang C.; Wang Y.; Ning J.; Zhong Y.; Hu Y. Engineering Self-Supported Hydrophobic–Aerophilic Air Cathode with CoS/Fe3S4 Nanoparticles Embedded in S, N Co-Doped Carbon Plate Arrays for Long-Life Rechargeable Zn–Air Batteries. Adv. Energy Mater. 2023, 13 (10), 2204245. 10.1002/aenm.202204245. [DOI] [Google Scholar]
- Wang S.; Wang H.; Huang C.; Ye P.; Luo X.; Ning J.; Zhong Y.; Hu Y. Trifunctional Electrocatalyst of N-doped Graphitic Carbon Nanosheets Encapsulated with CoFe Alloy Nanocrystals: The Key Roles of Bimetal Components and High-Content Graphitic-N. Applied Catalysis B: Environmental 2021, 298, 120512. 10.1016/j.apcatb.2021.120512. [DOI] [Google Scholar]
- Xie R.; Nie Z.; Hu X.; Yu Y.; Aruta C.; Yang N. toward Stable and Efficient Oxygen Evolution Reaction. ACS Appl. Energy Mater. 2021, 4 (9), 9057–9065. 10.1021/acsaem.1c01348. [DOI] [Google Scholar]
- Vignesh A.; Prabu M.; Shanmugam S. Porous LaCo1-xNixO3-δ Nanostructures as an Efficient Electrocatalyst for Water Oxidation and for a Zinc–Air Battery. ACS Appl. Mater. Interfaces 2016, 8 (9), 6019–6031. 10.1021/acsami.5b11840. [DOI] [PubMed] [Google Scholar]
- Nguyen T. X.; Liao Y. C.; Lin C. C.; Su Y. H.; Ting J. M. Advanced High Entropy Perovskite Oxide Electrocatalyst for Oxygen Evolution Reaction. Adv. Funct. Mater. 2021, 31 (27), 2101632. 10.1002/adfm.202101632. [DOI] [Google Scholar]
- Lu Y.; Ma A.; Yu Y.; Tan R.; Liu C.; Zhang P.; Liu D.; Gui J. Engineering Oxygen Vacancies into LaCoO3 Perovskite for Efficient Electrocatalytic Oxygen Evolution. ACS Sustainable Chem. Eng. 2019, 7 (3), 2906–2910. 10.1021/acssuschemeng.8b05717. [DOI] [Google Scholar]
- Liang Y.; Cui Y.; Chao Y.; Han N.; Sunarso J.; Liang P.; He X.; Zhang C.; Liu S. Exsolution of CoFe (Ru) Nanoparticles in Ru-doped (La0. 8Sr0.2)0.9Co0.1Fe0.8Ru0.1O3-δ for Efficient Oxygen Evolution Reaction. Nano Research 2022, 15 (8), 6977–6986. 10.1007/s12274-022-4328-0. [DOI] [Google Scholar]
- Yu L.; Xu N.; Zhu T.; Xu Z.; Sun M.; Geng D. La0. 4Sr0.6Co0.7Fe0.2Nb0.1O3-δ Perovskite Prepared by the Sol-Gel Method with Superior Performance as a Bifunctional Oxygen Electrocatalyst. Int. J. Hydrogen Energy 2020, 45 (55), 30583–30591. 10.1016/j.ijhydene.2020.08.105. [DOI] [Google Scholar]
- Ji D.; Liu C.; Yao Y.; Luo L.; Wang W.; Chen Z. Cerium Substitution in LaCoO3 Perovskite Oxide as Bifunctional Electrocatalysts for Hydrogen and Oxygen Evolution Reactions. Nanoscale 2021, 13 (22), 9952–9959. 10.1039/D1NR00069A. [DOI] [PubMed] [Google Scholar]
- Guo W.; Cui L.; Xu H.; Gong C. Selective Dissolution of A-Site Cations of La0.6Sr0.4Co0.8Fe0.2O3 Perovskite Catalysts to Enhance the Oxygen Evolution Reaction. Appl. Surf. Sci. 2020, 529, 147165. 10.1016/j.apsusc.2020.147165. [DOI] [Google Scholar]
- Jiang X.; Dong Y.; Zhang Z.; Li J.; Qian J.; Gao D. Cation Substitution of B-Site in LaCoO3 for Bifunctional Oxygen Electrocatalytic Activities. J. Alloys Compd. 2021, 878, 160433. 10.1016/j.jallcom.2021.160433. [DOI] [Google Scholar]
- Majee R.; Chakraborty S.; Salunke H. G.; Bhattacharyya S. Maneuvering the Physical Properties and Spin States to Enhance the Activity of La–Sr–Co–Fe–O Perovskite Oxide Nanoparticles in Electrochemical Water Oxidation. ACS Applied Energy Materials 2018, 1 (7), 3342–3350. 10.1021/acsaem.8b00531. [DOI] [Google Scholar]
- Álvarez-Galván M.; de La Peña O’Shea V.; Arzamendi G.; Pawelec B.; Gandía L.; Fierro J. Methylethyl Ketone Combustion over La-transition Metal (Cr, Co, Ni, Mn) Perovskites. Applied Catalysis B: Environmental 2009, 92 (3–4), 445–453. 10.1016/j.apcatb.2009.09.006. [DOI] [Google Scholar]
- Zhou S.; Miao X.; Zhao X.; Ma C.; Qiu Y.; Hu Z.; Zhao J.; Shi L.; Zeng J. Engineering Electrocatalytic Activity in Nanosized Perovskite Cobaltite through Surface Spin-State Transition. Nat. Commun. 2016, 7 (1), 11510. 10.1038/ncomms11510. [DOI] [PMC free article] [PubMed] [Google Scholar]
- Chen C.-F.; King G.; Dickerson R. M.; Papin P. A.; Gupta S.; Kellogg W. R.; Wu G. Oxygen-Deficient BaTiO3-x Perovskite as an Efficient Bifunctional Oxygen Electrocatalyst. Nano Energy 2015, 13, 423–432. 10.1016/j.nanoen.2015.03.005. [DOI] [Google Scholar]
- Gu X.; Jing H.; Mu X.; Yang H.; Zhou Q.; Yan S.; Liu S.; Chen C. La-Triggered Synthesis of Oxygen Vacancy-Modified Cobalt Oxide Nanosheets for Highly Efficient Oxygen Evolution in Alkaline Media. J. Alloys Compd. 2020, 814, 152274. 10.1016/j.jallcom.2019.152274. [DOI] [Google Scholar]
- Shen W.; Jin J.; Hu Y.; Hou Y.; Yin J.; Ma Z.; Zhao Y.-Q.; Xi P. Surface Chlorine Doped Perovskite-Type Cobaltate Lanthanum for Water Oxidation. Chinese Journal of Catalysis 2022, 43 (6), 1485–1492. 10.1016/S1872-2067(21)64004-4. [DOI] [Google Scholar]
- Li W.; Zhu Y.; Guo W.; Xu H.; Gong C.; Xue G. Enhanced Oxygen and Hydrogen Evolution Activities of Pt/LaCoO3 Perovskite Oxide via in-situ Exsolution of Pt Nanoparticles. Journal of Chemical Sciences 2022, 134 (2), 38. 10.1007/s12039-022-02033-5. [DOI] [Google Scholar]
- Li Z.; Xie Y.; Huang Z.; Su Y.; Sun C.; Fu J.; Wei H.; Wu F.; Ou G. Amorphization of LaCoO3 Perovskite Nanostructures for Efficient Oxygen Evolution. ACS Applied Nano Materials 2022, 5 (10), 14209–14215. 10.1021/acsanm.2c02982. [DOI] [Google Scholar]
- Mefford J. T.; Rong X.; Abakumov A. M.; Hardin W. G.; Dai S.; Kolpak A. M.; Johnston K. P.; Stevenson K. J. Water Electrolysis on La1-xSrxCoO3-δ Perovskite Electrocatalysts. Nat. Commun. 2016, 7 (1), 11053. 10.1038/ncomms11053. [DOI] [PMC free article] [PubMed] [Google Scholar]
- May K. J.; Carlton C. E.; Stoerzinger K. A.; Risch M.; Suntivich J.; Lee Y.-L.; Grimaud A.; Shao-Horn Y. Influence of Oxygen Evolution during Water Oxidation on the Surface of Perovskite Oxide Catalysts. J. Phys. Chem. Lett. 2012, 3 (22), 3264–3270. 10.1021/jz301414z. [DOI] [Google Scholar]
- Risch M.; Grimaud A.; May K. J.; Stoerzinger K. A.; Chen T. J.; Mansour A. N.; Shao-Horn Y. Structural Changes of Cobalt-Based Perovskites upon Water Oxidation Investigated by EXAFS. J. Phys. Chem. C 2013, 117 (17), 8628–8635. 10.1021/jp3126768. [DOI] [Google Scholar]
- Odynets I. V.; Strutynska N. Y.; Li J.; Han W.; Zatovsky I. V.; Klyui N. CoOx(OH)y/C Nanocomposites in situ Derived from Na4Co3(PO4)2P2O7 as Sustainable Electrocatalysts for Water Splitting. Dalton Transactions 2018, 47 (44), 15703–15713. 10.1039/C8DT03593H. [DOI] [PubMed] [Google Scholar]
- Fabbri E.; Nachtegaal M.; Binninger T.; Cheng X.; Kim B.; Durst J.; Bozza F.; Graule T.; Schäublin R.; Wiles L.; Pertoso M.; Danilovic N.; Ayers K. E.; Schmidt T. J. Dynamic Surface Self-Reconstruction is the Key of Highly Active Perovskite Nano-Electrocatalysts for Water Splitting. Nat. Mater. 2017, 16, 925. 10.1038/nmat4938. [DOI] [PubMed] [Google Scholar]
- Weber M. L.; Lole G.; Kormanyos A.; Schwiers A.; Heymann L.; Speck F. D.; Meyer T.; Dittmann R.; Cherevko S.; Jooss C.; et al. Atomistic Insights into Activation and Degradation of La0. 6Sr0.4CoO3-δ Electrocatalysts under Oxygen Evolution Conditions. J. Am. Chem. Soc. 2022, 144 (39), 17966–17979. 10.1021/jacs.2c07226. [DOI] [PMC free article] [PubMed] [Google Scholar]
- Rietveld H. Line Profiles of Neutron Powder-Diffraction Peaks for Structure Refinement. Acta Crystallogr. 1967, 22 (1), 151–152. 10.1107/S0365110X67000234. [DOI] [Google Scholar]
- Frontera C.; Rodríguez-Carvajal J. FullProf as a New Tool for Flipping Ratio Analysis. Physica B: Condensed Matter 2003, 335 (1–4), 219–222. 10.1016/S0921-4526(03)00241-2. [DOI] [Google Scholar]
- Wei Z.; Liedienov N.; Li Q.; Pashchenko A.; Xu W.; Turchenko V.; Yuan M.; Fesych I.; Levchenko G. Influence of Post-Annealing, Defect Chemistry and High Pressure on the Magnetocaloric Effect of Non-Stoichiometric La0.8-xK0.2Mn1+xO3 Compounds. Ceram. Int. 2021, 47 (17), 24553–24563. 10.1016/j.ceramint.2021.05.174. [DOI] [Google Scholar]
- Yuan M.; Levchenko G.; Li Q.; Berezhnaya L.; Fylymonov H.; Gaspar A. B.; Seredyuk M.; Real J. A. Variable Cooperative Interactions in the Pressure and Thermally Induced Multistep Spin Transition in a Two-Dimensional Iron (II) Coordination Polymer. Inorg. Chem. 2020, 59 (15), 10548–10556. 10.1021/acs.inorgchem.0c00978. [DOI] [PubMed] [Google Scholar]
- Takeda T.; Watanabe H. Magnetic Properties of the System SrCo1-xFexO3-y. J. Phys. Soc. Jpn. 1972, 33 (4), 973–978. 10.1143/JPSJ.33.973. [DOI] [Google Scholar]
- Taguchi H.; Shimada M.; Koizumi M. The Effect of Oxygen Vacancy on the Magnetic Properties in the System SrCoO3-δ (0< δ < 0. 5). J. Solid State Chem. 1979, 29 (2), 221–225. 10.1016/0022-4596(79)90227-5. [DOI] [Google Scholar]
- Lim J.; Yu J. Role of Oxygen Vacancy in the Spin-State Change and Magnetic Ordering in SrCoO3-δ. Phys. Rev. B 2018, 98 (8), 085106 10.1103/PhysRevB.98.085106. [DOI] [Google Scholar]
- Xie Q.; Wu Z.; Wu X.; Tan W. Sr Content on the Structure and Magnetic Properties of La1-xSrxCoO3. J. Alloys Compd. 2009, 474 (1–2), 81–85. 10.1016/j.jallcom.2008.06.045. [DOI] [Google Scholar]
- Database of Ionic Radii. Atomistic Simulation Group, Imperial College London, 2008. http://abulafia.mt.ic.ac.uk/shannon/ptable.php.
- Langford J. I.; Wilson A. Scherrer after Sixty Years: a Survey and some New Results in the Determination of Crystallite Size. J. Appl. Crystallogr. 1978, 11 (2), 102–113. 10.1107/S0021889878012844. [DOI] [Google Scholar]
- Goodenough J. B. Coexistence of Localized and Itinerant Delectrons. Mater. Res. Bull. 1971, 6 (10), 967–976. 10.1016/0025-5408(71)90075-4. [DOI] [Google Scholar]
- Liedienov N. A.; Wei Z.; Kalita V. M.; Pashchenko A. V.; Li Q.; Fesych I. V.; Turchenko V. A.; Hou C.; Wei X.; Liu B.; et al. Spin-Dependent Magnetism and Superparamagnetic Contribution to the Magnetocaloric Effect of Non-Stoichiometric Manganite Nanoparticles. Applied Materials Today 2022, 26, 101340. 10.1016/j.apmt.2021.101340. [DOI] [Google Scholar]
- Pashchenko A.; Pashchenko V.; Prokopenko V.; Turchenko V.; Revenko Y. F.; Mazur A.; Sycheva V. Y.; Liedienov N.; Pitsyuga V.; Levchenko G. Role of Structure Imperfection in the Formation of the Magnetotransport Properties of Rare-Earth Manganites with a Perovskite Structure. Journal of Experimental and Theoretical Physics 2017, 124, 100–113. 10.1134/S1063776116150127. [DOI] [Google Scholar]
- Tournus F.; Bonet E. Magnetic Susceptibility Curves of a Nanoparticle Assembly, I: Theoretical Model and Analytical Expressions for a Single Magnetic Anisotropy Energy. J. Magn. Magn. Mater. 2011, 323 (9), 1109–1117. 10.1016/j.jmmm.2010.11.056. [DOI] [Google Scholar]
- Liedienov N.; Kalita V.; Pashchenko A.; Dzhezherya Y. I.; Fesych I.; Li Q.; Levchenko G. Critical Phenomena of Magnetization, Magnetocaloric Effect, and Superparamagnetism in Nanoparticles of Non-Stoichiometric Manganite. J. Alloys Compd. 2020, 836, 155440. 10.1016/j.jallcom.2020.155440. [DOI] [Google Scholar]
- Nikiforov V. N.; Ignatenko A. N.; Irkhin V. Y. Size and Surface Effects on the Magnetism of Magnetite and Maghemite Nanoparticles. Journal of Experimental and Theoretical Physics 2017, 124 (2), 304–310. 10.1134/S1063776117010046. [DOI] [Google Scholar]
- Liu F.; Gao Y.; Chang H.; Liu Y.; Yun Y. Control of Magnetic Properties and Band Gap by Co/Mn Ordering and Oxygen Distributions of La2CoMnO6. J. Magn. Magn. Mater. 2017, 435, 217–222. 10.1016/j.jmmm.2017.03.040. [DOI] [Google Scholar]
- Banerjee B. On a Generalised Approach to First and Second Order Magnetic Transitions. Phys. Lett. 1964, 12 (1), 16–17. 10.1016/0031-9163(64)91158-8. [DOI] [Google Scholar]
- Tishin A. M.; Spichkin Y. I.. The Magnetocaloric Effect and Its Applications; CRC Press, 2016, 476. [Google Scholar]
- Butenko D. S.; Li S.; Chen R.; Odynets I. V.; Li D.; Yuan Z.; Zhang X.; Zatovsky I. Na4Co3P4O15 in Situ Transformation to Co(OH)2/CoO(OH) Nanoforms for Aqueous Supercapacitor using Redox Additive Electrolyte. Materials Science and Engineering: B 2022, 286, 116051. 10.1016/j.mseb.2022.116051. [DOI] [Google Scholar]
- Mu C.; Butenko D. S.; Odynets I. V.; Zatovsky I. V.; Li J.; Han W.; Klyui N. I. Na4Ni3P4O15–Ni(OH)2 Core–Shell Nanoparticles as Hybrid Electrocatalysts for the Oxygen Evolution Reaction in Alkaline Electrolytes. Dalton Transactions 2020, 49 (24), 8226–8237. 10.1039/D0DT01205J. [DOI] [PubMed] [Google Scholar]
- Vassilyeva Y. Z.; Butenko D. S.; Li S.; Han W.; Pak A. Y. Synthesis of Molybdenum Carbide Catalyst by DC Arc Plasma in Ambient Air for Hydrogen Evolution. Mater. Chem. Phys. 2020, 254, 123509. 10.1016/j.matchemphys.2020.123509. [DOI] [Google Scholar]
- Fang F.; Zhao P.; Feng N.; Wan H.; Guan G. Surface Engineering on Porous Perovskite-Type La0.6Sr0.4CoO3-δ Nanotubes for an Enhanced Performance in Diesel Soot Elimination. Journal of Hazardous Materials 2020, 399, 123014. 10.1016/j.jhazmat.2020.123014. [DOI] [PubMed] [Google Scholar]
- Chainani A.; Mathew M.; Sarma D. Electron-Spectroscopy Study of the Semiconductor-Metal Transition in La1-xSrxCoO3. Phys. Rev. B 1992, 46 (16), 9976. 10.1103/PhysRevB.46.9976. [DOI] [PubMed] [Google Scholar]
- Dupin J.-C.; Gonbeau D.; Vinatier P.; Levasseur A. Systematic XPS Studies of Metal Oxides, Hydroxides and Peroxides. Phys. Chem. Chem. Phys. 2000, 2 (6), 1319–1324. 10.1039/a908800h. [DOI] [Google Scholar]
- Wang H.; Chen X.; Huang D.; Zhou M.; Ding D.; Luo H. Cation Deficiency Tuning of LaCoO3 Perovskite as Bifunctional Oxygen Electrocatalyst. ChemCatChem. 2020, 12 (10), 2768–2775. 10.1002/cctc.201902392. [DOI] [Google Scholar]
- Zhou F.; Zhao Z.; Xu M.; Wang T.; Yang H.; Wang R.; Wang J.; Li H.; Feng M. The Spin Modulation Stimulated Efficient Electrocatalytic Oxygen Evolution Reaction over LaCoO3 Perovskite. Chemistry–A European Journal 2022, 28 (14), e202104157. 10.1002/chem.202104157. [DOI] [PubMed] [Google Scholar]
Associated Data
This section collects any data citations, data availability statements, or supplementary materials included in this article.


