Abstract
Accurate quantification of hepatitis C virus (HCV) RNA is needed in clinical practice to decide whether to continue or stop pegylated interferon-α-ribavirin combination therapy at week 12 of treatment for patients with chronic hepatitis C. Currently the HCV RNA quantification assay most widely used worldwide is the Amplicor HCV Monitor v2.0 assay (Roche Molecular Systems, Pleasanton, Calif.). The HCV RNA extraction step can be automated in the Cobas Ampliprep device. In this work, we show that the dynamic range of HCV RNA quantification of the Cobas Ampliprep/Cobas Amplicor HCV Monitor v2.0 procedure is 600 to 200,000 HCV RNA IU/ml (2.8 to 5.3 log IU/ml), which does not cover the full range of HCV RNA levels in infected patients. Any sample containing more than 200,000 IU/ml (5.3 log IU/ml) must thus be retested after dilution for accurate quantification. These results emphasize the need for commercial HCV RNA quantification assays with a broader range of linear quantification, such as real-time PCR-based assays.
Quantification of hepatitis C virus (HCV) RNA is useful in clinical practice. Indeed, monitoring of the fall in HCV RNA levels is presently used to decide whether to continue or stop pegylated interferon (IFN)-α-ribavirin combination therapy for patients with HCV genotype 1 infection (1). New directions in HCV therapy (9) suggest that future treatments will be tailored to the individual patient and that HCV RNA load monitoring during therapy will be a major treatment-tailoring tool. Thus, HCV RNA quantification assays need to be sensitive enough to detect HCV RNA reductions during therapy and also accurate in both the higher range (baseline viral load in untreated patients) and the lower range (patients on therapy) of HCV RNA levels (1). Various commercial assays can presently be used to quantify HCV RNA in patients' plasma or serum, including signal amplification assays (such as the “branched DNA”-based assay) and target amplification assays (6, 7). Quantitative HCV RNA assays based on target amplification presently use competitive PCR. Among these, the most widely used worldwide is the Amplicor HCV Monitor v2.0 assay (Roche Molecular Systems, Pleasanton, Calif.). After manual extraction of HCV RNA, the subsequent steps of the reaction can be automated in a Cobas Amplicor device. Furthermore, the extraction step can be automated in an Cobas Ampliprep device. The extracted RNA then has to be manually transferred to a Cobas Amplicor device for processing.
The dynamic range of quantification of an assay is defined as the range of HCV RNA levels within which quantification is accurate. HCV RNA levels below this range are generally overestimated, whereas HCV RNA levels above this range are underestimated. According to the manufacturer, the dynamic range of quantification of the Amplicor HCV Monitor v2.0 assay is 600 HCV RNA IU/ml to 500,000 IU/ml (2.8 to 5.7 log IU/ml). Above 500,000 IU/ml (5.7 log IU/ml), it is recommended to retest the sample after diluting it by 1/10 to 1/100 for accurate quantification. The objective of this work was to check, in real conditions of use, the upper limit of linear quantification of the Cobas Amplicor HCV Monitor v2.0 assay following automated extraction with Cobas Ampliprep, to determine the level of HCV RNA above which samples should be retested after dilution for accurate quantification.
MATERIALS AND METHODS
Blood samples.
Serum samples from patients included in two large clinical trials were prospectively collected to monitor early viral kinetics and the virological response to therapy. In the DITTO European multicenter clinical trial, 10 serum samples per patient were taken from 267 patients during the first month of therapy to monitor early viral kinetics during pegylated IFN-α2a and ribavirin combination therapy (5, 8). In a French multicenter trial, serum samples were taken every 3 months from HCV-infected patients to monitor the virological response to pegylated IFN-α2a and ribavirin combination therapy.
HCV RNA quantification.
Serum samples were tested by means of the semiautomated Cobas Amplicor HCV Monitor v2.0 assay after automated extraction with Cobas Ampliprep. Initially, all serum samples with an HCV RNA load higher than 100,000 IU/ml (5.0 log IU/ml) were tested undiluted and retested with the same procedure after 1/100 dilution. Overall, 437 serum samples from the DITTO study and 239 samples from the French multicenter trial had to be retested after dilution. These 676 samples are those studied here. HCV RNA quantification was performed on 100 μl of serum, according to the manufacturer's instructions. HCV RNA loads in the undiluted and diluted samples were compared to determine the practical upper limit of the dynamic range of quantification.
Due to the very large proportion of samples needing to be retested and the high generated cost, the decision was made at a certain time point of prospective analysis to systematically dilute the samples that were likely to have a viral load higher than 100,000 IU/ml (i.e., baseline and early on-treatment samples). This is why undiluted-diluted couples were not available for all of the samples from these two cohorts with a viral load above 100,000 IU/ml (5.0 log IU/ml) and only 676 and 239 samples were studied, respectively.
RESULTS
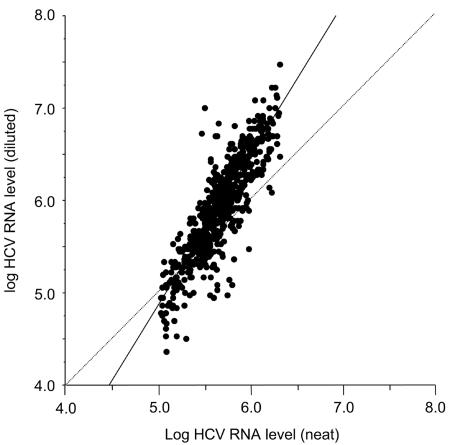
Table 1 shows the distribution of HCV RNA loads in undiluted samples classified by intervals of 100,000 IU/ml. All these samples were retested after 1/100 dilution, and the two values were compared. As shown in Fig. 1, there was a significant relationship between the HCV RNA levels measured with the undiluted and diluted sera (r = 0.884; P < 0.0001). However, the regression line did not run parallel to the main diagonal, due to the fact the HCV RNA levels were generally higher in the diluted than in the undiluted sample. This was in keeping with underestimation of HCV RNA levels above the upper limit of quantification of the assay.
TABLE 1.
Distribution of observed HCV RNA levels by intervals of 100,000 IU/ml among those that were higher than 100,000 IU/ml on initial testing on neat sera
| Characteristic | Result for group:
|
|||||||||
|---|---|---|---|---|---|---|---|---|---|---|
| A | B | C | D | E | F | G | H | I | J | |
| IU/ml | 100,001-200,000 | 200,001-300,000 | 300,001-400,000 | 400,001-500,000 | 500,001-600,000 | 600,001-700,000 | 700,001-800,000 | 800,001-900,000 | 900,001-1,000,000 | >1,000,000 |
| n | 82 | 95 | 122 | 105 | 63 | 52 | 36 | 30 | 20 | 71 |
| % | 12.1 | 14.1 | 18.0 | 15.5 | 9.3 | 7.7 | 5.3 | 4.4 | 3.0 | 10.5 |
FIG. 1.
Relationship between the HCV RNA levels measured in the undiluted (neat) and diluted samples in the Cobas Amplicor HCV Monitor v2.0 assay after HCV RNA extraction in the Cobas Ampliprep device. All samples falling above 100,000 IU/ml (5.0 log IU/ml) were retested after 1/100 dilution. The regression line is shown as a solid line, in comparison with the main diagonal (dashed line).
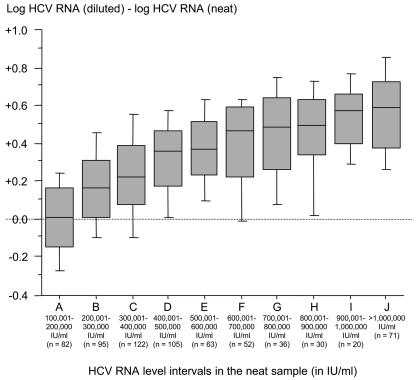
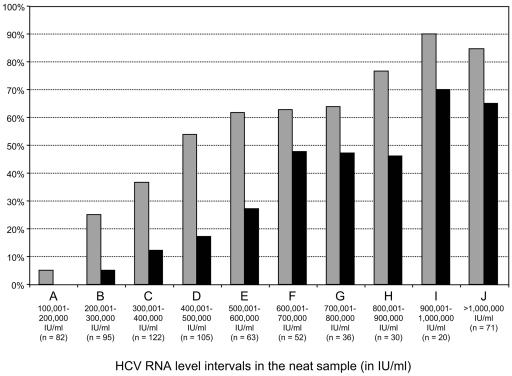
To determine the HCV RNA level above which a difference was observed between the undiluted and diluted sera (i.e., the upper limit of linear quantification), we plotted the log difference between the two values (HCV RNA in the diluted sample minus HCV RNA in the undiluted sample), by increasing intervals of 100,000 IU/ml above 100,000 IU/ml (5.0 log IU/ml) (Fig. 2). No clinically significant difference was seen up to a viral load value of 200,000 IU/ml (5.3 log IU/ml) in the undiluted sample, with a median difference of <0.1 log IU/ml (Fig. 2) and no individual sample with more than a 0.5 log difference (Fig. 3). As shown in Fig. 2, above 200,000 IU/ml (5.3 log IU/ml), the median log difference was higher than 0.1 and increased in parallel to serum viral load levels. Figure 3 shows, within each interval of HCV RNA levels of 100,000 IU/ml, the proportion of samples with more than a 0.3 log (twofold) and a 0.5 log (threefold) difference, respectively, between undiluted and diluted sample results. Overall, above 200,000 IU/ml (5.3 log IU/ml), more than 25% of samples showed a difference of more than 0.3 log (twofold), whereas more than 5% showed a 0.5 log (threefold) difference. These proportions reached 85 to 90% and 65 to 70%, respectively, for the highest HCV RNA loads, i.e., above 900,000 IU/ml (5.9 log IU/ml) on initial determination in the undiluted sample (Fig. 3).
FIG. 2.
Median value and distribution of the log HCV RNA level in the diluted sample minus the log HCV RNA level in the undiluted (neat) sample, according to the initial viral level in the undiluted sample.
FIG. 3.
Proportion of samples for which a difference of more than 0.3 log (twofold; gray-shaded columns) and more than 0.5 log (threefold; black-shaded columns) was found between the HCV RNA levels measured in the undiluted (neat) and the diluted sample, respectively, according to the initial viral level in the undiluted sample.
We finally calculated the proportion of samples falling above 200,000 IU/ml (5.3 log IU/ml) in the two cohorts of treated patients, i.e., the proportion of samples needing to be retested after 1/100 dilution on the basis of our results. A total of 917 out of the 2,587 DITTO samples (35.4%) and 447 out of the 1,108 French trial samples (40.3%) fell in this range.
DISCUSSION
Our findings show that linearity of quantification in the Cobas Ampliprep/Cobas Amplicor HCV Monitor v2.0 assay is lost above 200,000 IU/ml (5.3 log IU/ml) and that HCV RNA levels above this value are underestimated in undiluted samples. A broad dynamic range of quantification, covering all possible HCV RNA levels and within which HCV RNA quantification is both precise and accurate, is necessary to monitor HCV replication in clinical practice (1). The present treatment target for an “early virological response” is a 2-log HCV RNA drop at week 12 in the patients infected with HCV genotype 1 receiving the combination of pegylated IFN-α and ribavirin. Indeed, according to the recent National Institutes of Health Consensus Conference on Hepatitis C (1), patients who have a 2-log HCV RNA decrease at week 12 should continue therapy, whereas other patients can discontinue treatment because they have virtually no chance of subsequently clearing the infection. Accurate HCV RNA quantification is also particularly important in clinical trials, to monitor HCV viral kinetics and virological responses to antiviral drugs. This can help to clarify the mechanisms underlying antiviral treatment efficacy and failure and derive recommendations on the basis of viral load monitoring for routine patient care. Thus, accurate HCV RNA quantification is absolutely crucial for hepatitis C therapy.
Current competitive-PCR-based assays suffer from a narrow range of linear quantification (6, 7). The relatively poor sensitivity of these assays indeed makes it necessary to use qualitative, nonquantitative PCR, or transcription-mediated amplification-based assays with a detection limit of 50 IU/ml or less to assess the end-of-treatment response and especially the sustained virological response to therapy 24 months after treatment withdrawal, i.e., at the endpoint of HCV therapy (1). In addition, the upper limit of linear quantification of these assays is relatively low and does not cover the entire range of baseline HCV RNA levels (6, 7). As baseline HCV RNA quantification is crucial to judging the effect of antiviral therapy, the manufacturers recommend that samples above the upper limit of quantification be retested after dilution.
The upper limit of quantification of the Amplicor HCV Monitor v2.0 assay, the HCV RNA quantification assay most widely used worldwide, was initially stated by the manufacturer to be 850,000 IU/ml (5.9 log IU/ml). More recently, this was corrected to 500,000 IU/ml (5.7 log IU/ml), and it was recommended to retest, after dilution, all samples above 500,000 IU/ml; values obtained on undiluted sera could be used directly when below 500,000 IU/ml (3). The results of our study show that the actual upper limit of quantification of the semiautomated Cobas version of this assay following automated extraction with Cobas Ampliprep is 200,000 IU/ml (5.3 log IU/ml). This means that any sample above this value must be retested after dilution. This is particularly important in clinical practice when monitoring the 2-log drop at week 12 of therapy in HCV genotype 1-infected patients, as such a drop could be missed by underestimating baseline viral load and treatment might consequently be discontinued for patients with a good chance of having sustained viral clearance. Our results also indicate that HCV RNA levels between 200,000 and 500,000 IU/ml (5.3 and 5.7 log IU/ml) obtained with this technique in clinical trials are underestimated and that the corresponding samples should be retested after dilution to reach accurate conclusions regarding viral kinetics, virological responses, response prediction, and tailoring rules.
In summary, this study shows that (i) the dynamic range of HCV RNA quantification with the Cobas Ampliprep/Cobas Amplicor HCV Monitor v2.0 procedure is 600 to 200,000 IU/ml (2.8 to 5.3 log IU/ml), which does not cover the full range of HCV RNA levels in infected patients, and that (ii) any sample above 200,000 IU/ml (5.3 log IU/ml) should be retested after 1/100 dilution for accurate quantification. These results emphasize the need for commercial HCV RNA quantification assays with a broader range of linear quantification. This should be obtained in the future with real-time PCR-based assays. The “home-made” and developmental versions of these assays indeed show increased sensitivity and specificity, a broader dynamic range of quantification, and better accuracy than competitive PCR-based assays (2, 4, 10). The manufacturers' stated dynamic range of quantification of the real-time PCR Cobas TaqMan 48 HCV (Roche Molecular Systems) assay is 30 to 200,000,000 IU/ml (1.5 to 8.3 log IU/ml), but quantification is accurate for HCV genotypes 1 and 6 only with the present version of the assay. It is 25 to 50,000,000 IU/ml (1.4 to 7.7 log IU/ml) for HCV Quant ASR (Abbott Diagnostic, Chicago, Ill.), pending confirmation by independent external evaluations. When the issue of equal quantification of all HCV genotypes in these assays is resolved, these ranges will fully meet clinical requirements.
Acknowledgments
We are grateful to the DITTO HCV Group, a European Commission 5th Framework Programme (FP5)-funded Consortium (contract QLK2-2000-00836). We thank Avidan U. Neumann, the scientific coordinator of the DITTO HCV Group, for his helpful comments on the manuscript, as well as the members of the DITTO Steering Committee (Solko W. Schalm, Stefan Zeuzem, and Carlo Ferrari).
Contributing members of the DITTO Group included the following: C. Arvanitakis, J. T. Brouwer, G. Colucci, J. Esteban, C. Ferrari, G. Germanidis, I. Goulis, B. Hansen, K. Hellstrand, C. Hezode, Y. Homburger, M. Lagging, Y. Lurie, G. Missale, F. Negro, A. U. Neumann, J. M. Pawlotsky, B. Pellegrin, S. W. Schalm, A. Soulier, E. Verheij -Hart, M. vonWagner, J. M. Vrolijk, and S. Zeuzem.
REFERENCES
- 1.Consensus panel. 2002. National Institutes of Health Consensus Development Conference Statement: Management of hepatitis C: 2002—June 10-12, 2002. Hepatology 36:S3-S20. [DOI] [PubMed] [Google Scholar]
- 2.Enomoto, M., S. Nishiguchi, S. Shiomi, M. Tanaka, K. Fukuda, T. Ueda, A. Tamori, D. Habu, T. Takeda, Y. Yano, and S. Otani. 2001. Comparison of real-time quantitative polymerase chain reaction with three other assays for quantitation of hepatitis C virus. J. Gastroenterol. Hepatol. 16:904-909. [DOI] [PubMed] [Google Scholar]
- 3.Lee, S. C., A. Antony, N. Lee, J. Leibow, J. Q. Yang, S. Soviero, K. Gutekunst, and M. Rosenstraus. 2000. Improved version 2.0 qualitative and quantitative Amplicor reverse transcription-PCR tests for hepatitis C virus RNA: calibration to international units, enhanced genotype reactivity, and performance characteristics. J. Clin. Microbiol. 38:4171-4179. [DOI] [PMC free article] [PubMed] [Google Scholar]
- 4.Martell, M., J. Gomez, J. I. Esteban, S. Sauleda, J. Quer, B. Cabot, R. Esteban, and J. Guardia. 1999. High-throughput real-time reverse transcription-PCR quantitation of hepatitis C virus RNA. J. Clin. Microbiol. 37:327-332. [DOI] [PMC free article] [PubMed] [Google Scholar]
- 5.Neumann, A. U., E. Hagai, S. W. Schalm, M. von Wagner, G. Germanidis, Y. Lurie, G. Missale, M. Martell, J. M. Vrolijk, C. Hezode, G. Norkrans, F. Negro, A. Soulier, E. Verheij-Hart, G. Colucci, C. Ferrari, S. Zeuzem, and J. M. Pawlotsky. 2003. Early viral kinetics prediction of sustained virological response after 1 or 4 weeks of peginterferon alfa-2a and ribavirin therapy (DITTO project). Hepatology 38:248A. [Google Scholar]
- 6.Pawlotsky, J. M. 2002. Molecular diagnosis of viral hepatitis. Gastroenterology 122:1554-1568. [DOI] [PubMed] [Google Scholar]
- 7.Pawlotsky, J. M. 2002. Use and interpretation of virological tests for hepatitis C. Hepatology 36:S65-S73. [DOI] [PubMed] [Google Scholar]
- 8.Pawlotsky, J. M., C. Hezode, B. Pellegrin, A. Soulier, M. von Wagner, J. T. Brouwer, G. Missale, G. Germanidis, Y. Lurie, F. Negro, J. I. Esteban, K. Hellstrand, C. Ferrari, S. Zeuzem, S. W. Schalm, and A. U. Neumann. 2002. Early HCV genotype 4 replication kinetics during treatment with peginterferon alfa-2a (Pegasys)-ribavirin combination. A comparison with HCV genotypes 1 and 3 kinetics. Hepatology 36:291A. [Google Scholar]
- 9.Pawlotsky, J. M., and J. G. McHutchison. 2004. Hepatitis C. Development of new drugs and clinical trials: promises and pitfalls. Hepatology 39:554-567. [DOI] [PubMed] [Google Scholar]
- 10.Takeuchi, T., A. Katsume, T. Tanaka, A. Abe, K. Inoue, K. Tsukiyama-Kohara, R. Kawaguchi, S. Tanaka, and M. Kohara. 1999. Real-time detection system for quantification of hepatitis C virus genome. Gastroenterology 116:636-642. [DOI] [PubMed] [Google Scholar]


