Abstract
This study aimed to investigate the risk factors for cervical radiculopathy (CR) along with identifying the relationships between age, cervical flexors, and CR. This was a retrospective cohort study, including 60 patients with CR enrolled between December 2018 and June 2020. In this study, we measured C2 to C7 Cobb angle, disc degeneration, endplate degeneration, and morphology of paraspinal muscles and evaluated the value of predictive methods using receiver operating characteristic curves. Next, we established a diagnostic model for CR using Fisher discriminant model and compared different models by calculating the kappa value. Age and cervical flexor factors were used to construct clinical predictive models, which were further evaluated by C-index, receiver operating characteristic curve, calibration curve, and decision curve analysis. Multivariate analysis showed that age and cervical flexors were potential risk factors for CR, while the diagnostic model indicated that both exerted the best diagnostic effect. The obtained diagnostic equation was as follows: y1 = 0.33 × 1 + 10.302 × 2–24.139; y2 = 0.259 × 1 + 13.605 × 2–32.579. Both the C-index and AUC in the training set reached 0.939. Moreover, the C-index and AUC values in the external validation set reached 0.961. We developed 2 models for predicting CR and also confirmed their validity. Age and cervical flexors were considered potential risk factors for CR. Our noninvasive inspection method could provide clinicians with a more potential diagnostic value to detect CR accurately.
Keywords: aged, radiculopathy, risk factors
1. Introduction
Cervical radiculopathy (CR), an aging-related disease, typically manifests as neck and shoulder pain, ultimately resulting in atrophy of cervical paraspinal muscles (PSMs).[1] Its epidemiological characteristics have extensively been investigated worldwide, especially since the world is approaching an aging society. Its age-adjusted incidence is 83 per 100,000 people.[1] Strine and Hootman showed that approximately one-third of the US population is suffering from CR, i.e., neck pain and muscle dysfunction, representing a significant medical and economic burden.[2] A recent meta-analysis, including the subgroup analysis of 1202 individuals, estimated a 2.3% overall prevalence of CR and a 24.2% prevalence of asymptomatic nerve compression, with the elderly population exhibiting a significantly higher prevalence.[3] The high incidence of CR and its serious consequences have major impacts on the physical and mental health of patients, exerting a burden on the family workforce, social economy, and health insurance funds.
Detecting abnormal manifestations remain essential in managing CR; however, it can be challenging.[4,5] The most common methods that evaluate CR include disc degeneration and sagittal imbalance.[6] However, related assessment approaches are increasingly challenging. Although such approaches have been infrequently reported in the literature, they have not been used in clinical practice.[7] Previous literature has demonstrated a significant relationship between age, PSMs, and CR.[5,8] However, no consensus has been achieved on the predictive indicators of CR, with even medical experts in related specialties being confused and controversial. This has led to delayed diagnosis and development of quadriplegia.[4,9] The identification of risk factors is essential for the rational and scientific management of CR. Therefore, this study provides a novel predictive nomogram for CR risk factor prediction.
2. Materials and methods
2.1. Patient selection and analysis
This study employed a retrospective design, which included patients with neck and shoulder pain and unilateral CR who visited the outpatient clinic of the First Affiliated Hospital of Guangxi Medical University between December 2018 and June 2020. This study was approved by the Ethics Committee, and since the study was retrospective in nature and the patient data was anonymized, informed consent was waived.
CR was defined as neck pain with radiation pain in one or both upper limbs because the nerve root was compressed by cervical disc degeneration. Inclusion criteria were as follows: Patients with neck and shoulder pain and unilateral CR; ideal images of MR and digital radiography of the neck and cervical spine providing accurate measurements of the C2 to C7 Cobb angle, cervical vertebral bodies, intervertebral discs, endplates, and PSMs. Furthermore, to minimize selection bias, we excluded patients with primary or metastatic spinal tumors, spinal tuberculosis, soft tissue infection, congenital deformity of the spine, neurogenic or myogenic diseases, Guillain-Barre syndrome, myasthenia gravis, cerebrovascular sequelae, and brachial plexus injury.
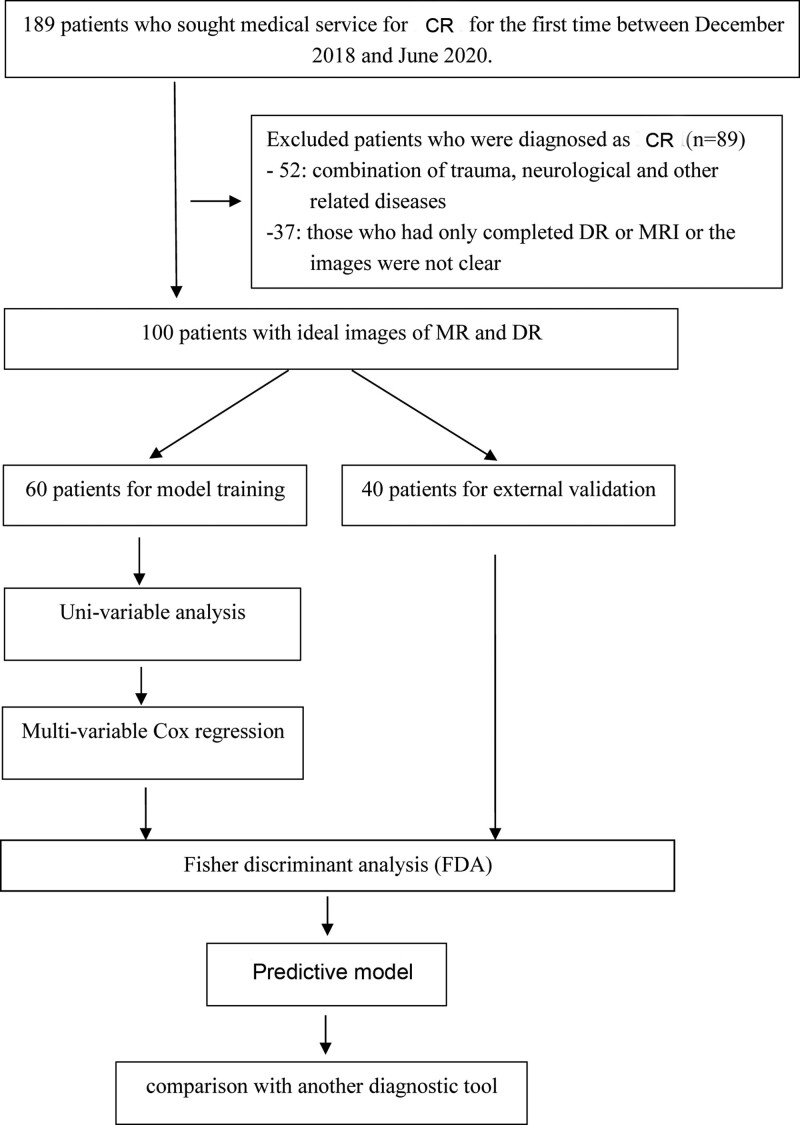
Of all the patients, 100 exhibited clinical symptoms and imaging results eligible for the study. However, 19 patients were excluded due to the presence of the combination of trauma, neurological, and other related diseases, while 21 were excluded due to the presence of only digital radiography or unclear MRI images, and the rest were selected as the training group. According to the Pfirrmann scale system, 34 patients with grade III to V disc degeneration and 26 patients with grade I to II disc degeneration were classified as the degeneration and non-degeneration groups, respectively. The validation group included 40 patients with ideal digital radiography/MRI images taken during the physical examination at the same time (Fig. 1).
Figure 1.
The overall flow chart of the study.
3. Predictive factor assessment
3.1. Clinical characteristics
We collected general information about the patients, including their age and sex, and recorded their VAS scores, numbness, pathological sign, accompanying symptoms, and muscle strength, along with evaluating their imaging assessments, including cervical disc degeneration, cervical endplate degeneration, fatty infiltration and morphology of cervical PSMs, and cervical curvature.[10] Imaging assessments were evaluated by 1 clinician (SXP) and 1 radiologist (RQY), both unaware of the group assignment. The evaluators measured all parameters twice on the same image. Upon disagreement on any qualitative parameters, conclusions were reached through consensus. The average results of both researchers were determined as the quantitative parameter. All operations were performed on the PACS Workstation software (PACS: AnnetDCLient 2, 7, 0, 6 versions).
4. PSM measurements
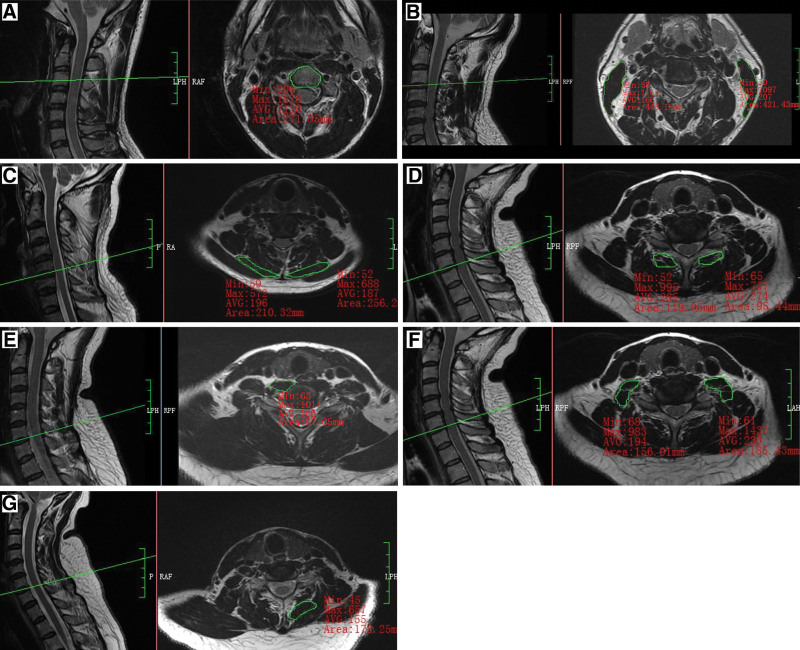
We measured the cross-sectional area (CSA) of the cervical PSMs from C3/4 to C6/7 and the CSA of the cervical vertebra (Fig. 2) from C4 to C7 disc levels on Transverse T1-weighted MRI since the responsible lesions were mainly concentrated in the above-mentioned segments. CSA was derived by manually tracing the fascial boundaries using the PACS system, and the average CSA of the 4 levels was used as the final data. Moreover, PSMs morphology was evaluated using the CSA ratio (cervical PSMs CSA/vertebral CSA on the same axial image) rather than the CSA of PSMs alone.
Figure 2.
Schematic diagram of CSA measurement of the CPMs and VB. (A) CSA of splenius capitis muscle (SPCAP) showing a value of 210.32 mm2 (left) and 256.26 mm2 (right) at C5/6. (B) CSA of longus capitis muscle (LCAP) plus the long cervical muscle (LC) showing a value of 87.65 mm2 (left) at C6/7. (C) CSA of the anterior scalene (SA) plus the medium scalene (SM) plus the posterior scalene (SP) showing a value of 156.01 mm2 (left) and 185.43 mm2 (right) at C6/7. (D) CSA of semispinalis capitis muscle (SSCAP) plus the semispinalis cervicis muscle (SSC) showing a value of 172.25 mm2 at C6/7 (right). (E) CSA of the sternocleidomastoid muscle (SCM) showing a value of 119.05 mm2 (left) and 95.44 mm2 (right) at C6/7. (F) CSA of the cervical vertebra (VB) showing a value of 271.85 mm2 at C3. CSA = cross-sectional area.
The clinician (SXP) and radiologist (RQY) measured the bilateral cervical flexor group SCA (Flexor SCA), including the—longus capitis muscle (LCAP), longus colli muscle (LC), the sternocleidomastoid muscle (SCM), the anterior scalene muscle, the CSA of the middle scalene muscle and the posterior scalene muscle along with bilateral cervical extensor group SCA (Extensor SCA), including the splenius capitis muscle (SPCAP), the semispinalis capitis muscle (SSCAP), semispinalis cervicis muscle (SSC), and the multifidus muscle (MU). Since the LCAP, LC, anterior scalene muscle, middle scalene muscle, posterior scalene muscle, SSCAP, and SSC were functionally and anatomically related, it was difficult to identify their boundaries on MRI and measure their CSA separately. Thus, we considered the overall area as a whole and measured the CSA. As a result, the data were recorded as (LCAP + LC)/VB SSCAP, SCM/VB SSCAP, SAMP/VB SSCAP, (SSCAP + SSC)/VB SSCAP, SPCAP/VB SSCAP, MU/VB SSCAP, Flexor/VB SSCAP, and Extensor/VB SSCAP.
5. Statistical analysis
Statistical analysis was performed using SPSS (version 23.0) and R software (version 4.2.2). Different statistical methods, including X2, t test, and U tests, were used to compare the clinical characteristics between patients and normal counterparts according to their data types. Statistically, potential factors with a P value of < .1 were included in multivariable Cox regression analysis, while variables with high co-linearity were not included in the same regression model. The diagnostic model was established using Fisher discriminant model, while the value of diagnostic methods was evaluated using the receiver operating characteristic (ROC) curves. Different diagnostic models were compared by calculating the kappa value. A 2-tailed P value of < .05 was considered statistically significant.
6. Results
6.1. Clinical characteristics of study participants
The mean age of the patients, including 43 males and 57 females, was 44.1 years. The average age of the training group, including 34 males and 26 females, was 43.7 years. The main symptoms included pain and numbness. The detailed clinical data are shown in Table 1.
Table 1.
Clinical characteristics of participants in the training set.
| Clinical characteristics | DCM (n = 26) |
Non-DCM (n = 34) |
Statistical method | P value |
|---|---|---|---|---|
| Sex (female/male) | 12/14 | 22/12 | X 2 | .151 |
| Age (yr) | 35.120 ± 14.230 | 50.410 ± 12.606 | t | .000 |
| Left (LCAP + LC)/VBSCA | 0.201 ± 0.367 | 0.148 ± 0.030 | t | .000 |
| Right (LCAP + LC)/VBSCA | 0.210 ± 0.448 | 0.155 ± 0.317 | t | .000 |
| Left SAMP/VBSCA | 0.554 (0.491–0.709) | 0.503 (0.422–0.599) | U | .054 |
| Right SAMP/VBSCA | 0.565 (0.501–0.692) | 0.498 (0.433–0.620) | U | .088 |
| Left SCM/VBSCA | 1.174 ± 0.203 | 0.824 ± 0.163 | t | .000 |
| Right SCM/VBSCA | 1.163 ± 0.243 | 0.827 ± 0.162 | t | .000 |
| Left SPCAP/VBSCA | 0.533 ± 0.157 | 0.422 ± 0.155 | t | .008 |
| Right SPCAP/VBSCA | 0.487 (0.436–0.555) | 0.402 (0.318–0.478) | U | .001 |
| Left MU/VBSCA | 0.388 ± 0.103 | 0.243 ± 0.064 | t | .000 |
| Right MU/VBSCA | 0.401 ± 0.094 | 0.254 ± 0.067 | t | .000 |
| Left (SSCAP + SSC)/VBSCA | 0.746 ± 0.172 | 0.599 ± 0.178 | t | .002 |
| Right (SSCAP + SSC)/VBSCA | 0.745 (0.663–0.861) | 0.592 (0.519–0.654) | U | .000 |
| Flexor/VBSCA | 4.019 ± 0.642 | 2.937 ± 0.483 | t | .000 |
| Extensor/VBSCA | 3.326 (2.900–3.579) | 2.465 (2.163–2.725) | U | .000 |
| Site (neck/limbs/neck + limbs/others) | 13/2/10/1 | 17/4/13/0 | X 2 | .670 |
| Symptom (pain/pain + numbness/others) | 14/9/3 | 18/12/4 | X 2 | .998 |
| Duration | 10.500 (6.000–12.000) | 9.000 (3.000–39.000) | U | .608 |
| Hoffman syndrome (no/yes) | 21/5 | 27/7 | X 2 | .896 |
| Feelings of walking on cotton wool (no/yes) | 24/2 | 27/7 | X 2 | .166 |
| Accompanying symptoms (no/dizziness/others) | 18/6/2 | 26/6/2 | X 2 | .821 |
| Muscle strength (3/4/5) | 1/7/18 | 0/3/31 | X 2 | .079 |
DCM = degenerative cervical myelopathy, LC = longus colli muscle, LCAP = longus capitis muscle, MU = multifidus muscle, SAMP = anterior scalene + middle scalene + posterior scalene, SCM = sternocleidomastoid muscle, SPCAP = splenius capitis muscle, SSC = semispinalis cervicis muscle, SSCAP = semispinalis capitis muscle, VBSCA = cross-sectional area of vertebral body.
7. Univariable and multivariable logistic regression analyses
Based on the data type of each clinical feature, an appropriate statistical method was selected to compare the degeneration and non-degeneration groups. The results are shown in Table 1. Only the indicators with P value < .1 were included in the subsequent multivariate analysis, which included the following 16 indicators: age; left (LCAP + LC)/VB SSCAP; right (LCAP + LC)/VB SSCAP; left SAMP/VB SSCAP; right SAMP/VB SSCAP; left SCM/VB SSCAP; right SCM/VB SSCAP; left SPCAP/VB SSCAP; right SPCAP/VB SSCAP; left MU/VB SSCAP; right MU/VB SSCAP; left (SSCAP + SSC)/VB SSCAP; right (SSCAP + SSC)/VB SSCAP; flexor/VB SSCAP; extensor/VB SSCAP; muscle strength. The collinearity problem was avoided by including the extensor and flexor muscle groups along with each muscle separately in the multivariate statistical model. The final results are shown in Table 2 and Table 3. Multivariate analysis showed that age and flexors were potential risk factors for CR patients.
Table 2.
Multivariate Cox regression analysis of different muscles.
| Clinical characteristics | B | S.E.M | Wald | P value |
|---|---|---|---|---|
| Age | 1.161 | 763.176 | 0.000 | .999 |
| Left (LCAP + LC)/VBSCA | −386.277 | 335,463.914 | 0.000 | .999 |
| Right (LCAP + LC)/VBSCA | −2029.487 | 321,534.927 | 0.000 | .995 |
| Left SAMP/VBSCA | 403.611 | 80,010.391 | 0.000 | .996 |
| Right SAMP/VBSCA | 665.419 | 49,630.177 | 0.000 | .989 |
| Left SCM/VBSCA | −230.489 | 89,329.946 | 0.000 | .998 |
| Right SCM/VBSCA | −61.229 | 61,610.230 | 0.000 | .999 |
| Left SPCAP/VBSCA | 126.688 | 76,894.739 | 0.000 | .999 |
| Right SPCAP/VBSCA | −611.365 | 92,558.656 | 0.000 | .995 |
| Left MU/VBSCA | −28.871 | 85,003.652 | 0.000 | 1.000 |
| Right MU/VBSCA | 97.874 | 149,595.604 | 0.000 | .999 |
| Left (SSCAP + SSC)/VBSCA | −172.330 | 40,758.803 | 0.000 | .997 |
| Right (SSCAP + SSC)/VBSCA | −391.896 | 68,114.545 | 0.000 | .995 |
| Muscle strength | 162.699 | 28,044.666 | 0.000 | .995 |
LC = longus colli muscle, LCAP = longus capitis muscle, MU = multifidus muscle, SAMP = anterior scalene + middle scalene + posterior scalene, SCM = sternocleidomastoid muscle, SPCAP = splenius capitis muscle, SSC = semispinalis cervicis muscle, SSCAP = semispinalis capitis muscle, VBSCA = cross-sectional area of vertebral body.
Table 3.
Multivariate Cox regression analysis of flexor and extensor muscles.
| Clinical characteristics | B | S.E.M | Wald | P value |
|---|---|---|---|---|
| Age | 0.111 | 0.047 | 5.651 | .017 |
| Flexors | −2.756 | 0.989 | 7.766 | .005 |
| Extensors | −0.490 | 0.720 | 0.463 | .496 |
| Muscle strength | 3.429 | 1.985 | 2.985 | .084 |
8. Age and cervical flexors as predictors of CR
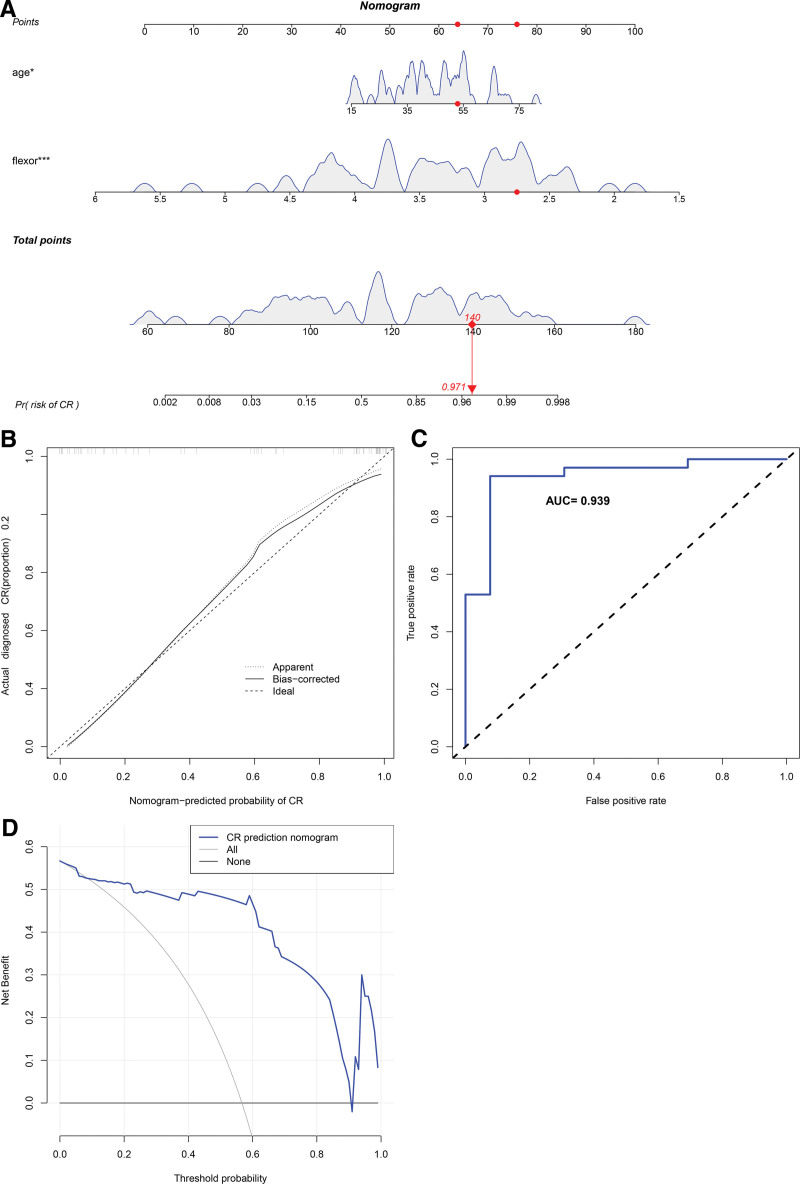
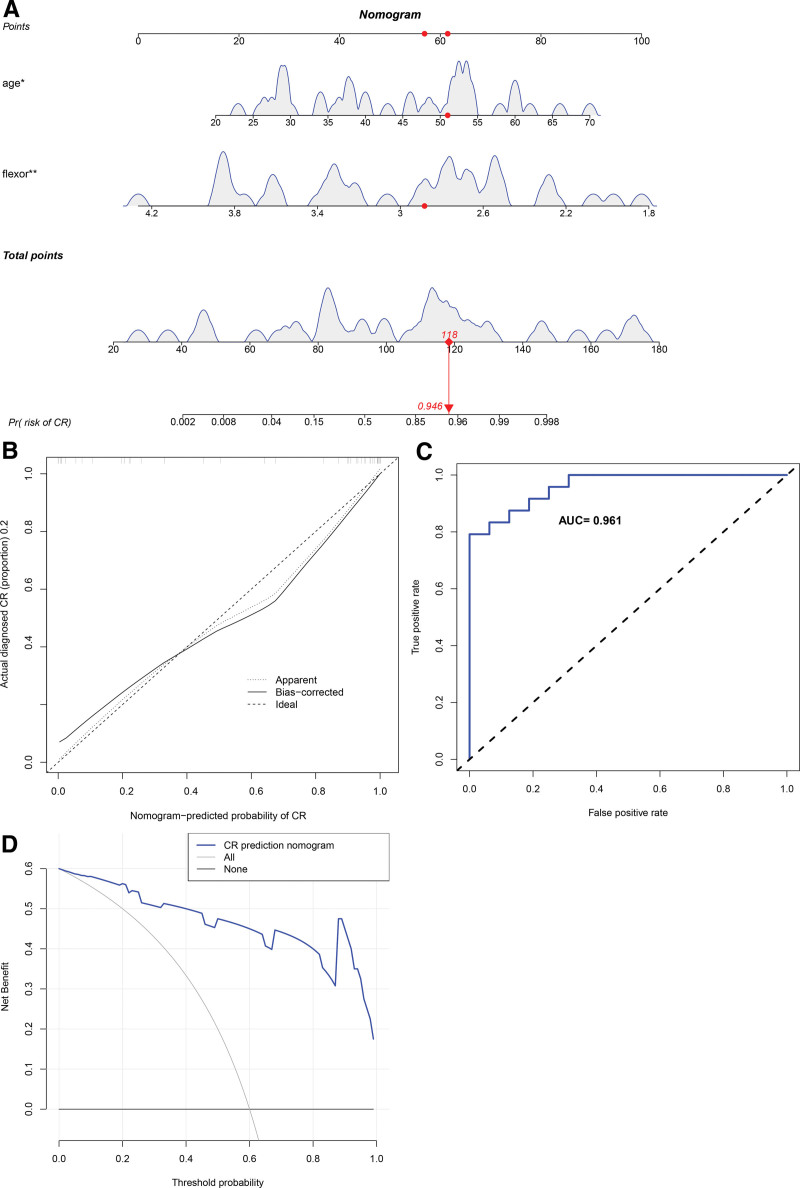
To further clarify the clinical significance of age and cervical flexors in CR, we constructed a clinical predictive model. In the training set, the prediction range of nomograms ranged between 0.002 and 0.998 (Fig. 3A), and the clinical model exhibited a C-index value of 0.939. The calibration curve showed that the observed values were consistent with the ideal values (Fig. 3B). Furthermore, the ROC curve verified the accuracy of the model with a value as high as 0.939 (Fig. 3C). The net benefit of the clinical predictive model ranged between 0.01 and 0.90 (Fig. 3D), and the internal validation revealed a C-index of as high as 0.932, suggesting the high accuracy of the model. Subsequently, we used external validation to evaluate the model. In the external validation set, the prediction interval for the nomogram ranged between 0.002 and 0.998 (Fig. 4A), and the clinical model exhibited a C-index of 0.961. The calibration curve revealed consistency between the observed and the ideal values (Fig. 4B). The ROC curve further verified the accuracy of the model to be as high as 0.961 (Fig. 4C). The net benefit of the clinical predictive model ranged between 0.01 and 0.99 (Fig. 4D). Furthermore, we used internal random validation and obtained a C-index value of as high as 0.951, suggesting the high accuracy of the model.
Figure 3.
The clinical and assessment models in the training set. (A) The prediction intervals of nomograms ranging between 0.002 and 0.998. (B) The calibration curve showing consistency between the observed and the ideal values. (C) The ROC curve verification of the accuracy of the model, which was as high as 0.939. (D) The net benefit of the clinical predictive model ranging between 0.01 and 0.90. ROC = receiver operating characteristic.
Figure 4.
The clinical and assessment models in the external validation set. (A) The prediction interval of the nomogram ranging between 0.002 and 0.998. (B) The calibration curve showing consistency between the observed and the ideal values. (C) The ROC curve verification of the accuracy of the model, which was as high as 0.96. (D) The net benefit of the clinical predictive model ranging between 0.01 and 0.99. ROC = receiver operating characteristic.
9. Establishment and validation of the diagnostic model based on the above potential risk factors
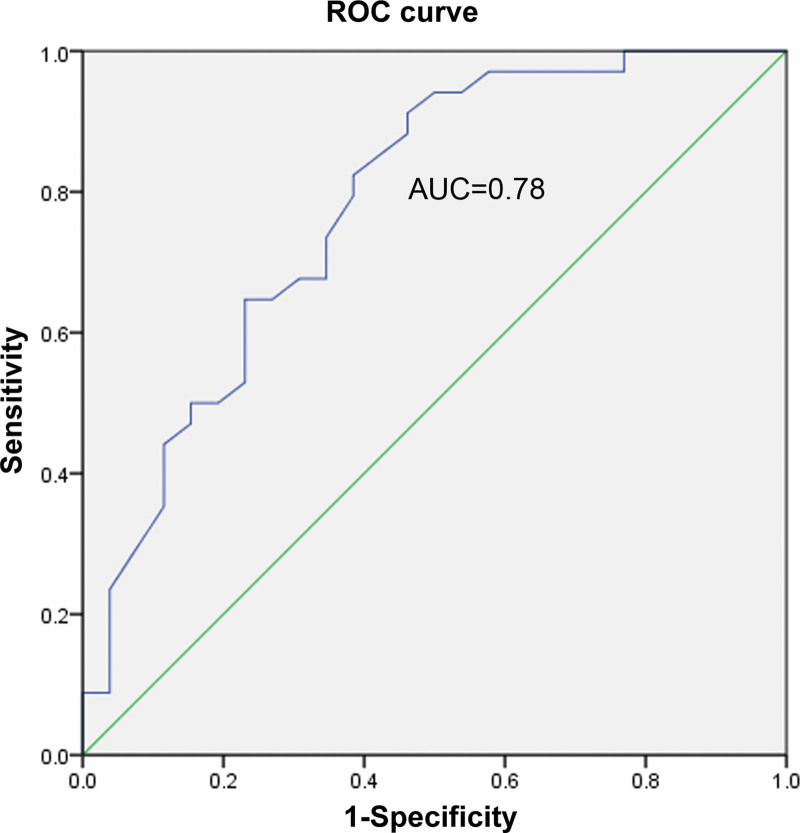
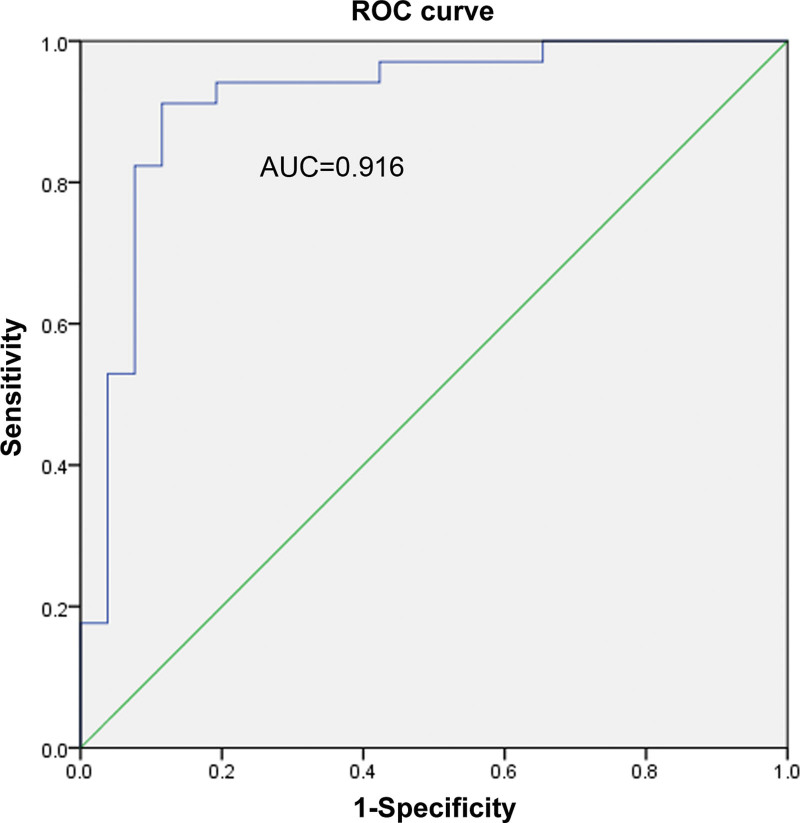
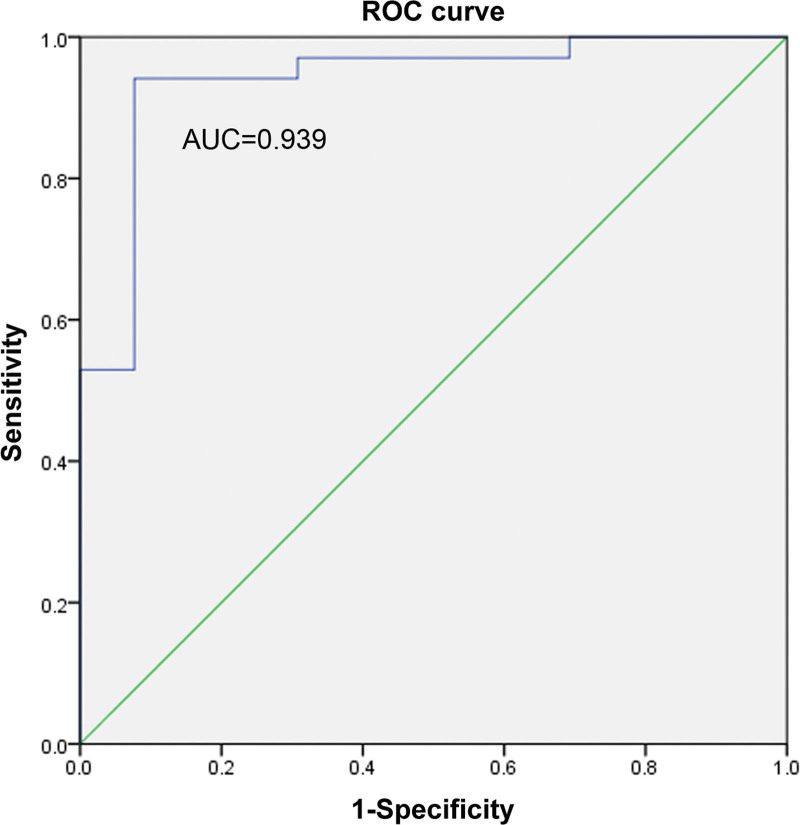
The ROC curve method was used to explore whether age and flexors could diagnose CR. Here, their separate and combined ability to diagnose CR was assessed. Among them, the AUCs of age, flexor muscles, and the combination of age and flexors were found to be 0.78, 0.916, and 0.939, respectively. As shown in Figures 5–7, a combination of both indicators exerted the best diagnostic effect. Fisher discriminant was used to establish the diagnostic model. Leave-one-out cross-validation was used to obtain the following diagnostic equations:
Figure 5.
The ROC curve of age. ROC = receiver operating characteristic.
Figure 7.
The ROC curve of age and flexors. ROC = receiver operating characteristic.
Figure 6.
The ROC curve of flexors. ROC = receiver operating characteristic.
where, x1 indicated age, x2 represented cervical flexors, y1 was the disease group equation, and y2 was the normal group equation. The age and cervical flexor data of each patient were applied to both diagnostic equations of y1 and y2. If y1 > y2, it indicates a patient. Otherwise, it indicated a normal individual. After the leave-one-out cross-validation, the discriminant diagnosis of the training set exhibited a sensitivity of 94.1%, specificity of 88.5%, and accuracy of 91.7%. Similarly, the discriminant function of the validation set exhibited a sensitivity of 95.8%, specificity of 68.8%, and accuracy of 85%.
10. Comparison between the models using other tools
Cobb angle (C2–7) was assessed to compare the pros and cons of the established model with other methods, determine its consistency, and observe the sagittal balance of the cervical spine. These results were used to judge the patients in the degeneration group and determine whether they were at risk of developing CR. Next, these data were compared with the judgment results of the above model, which revealed its better performance (sensitivity 66.7%, specificity 81.3%, accuracy 72.5%), with a kappa value of 0.363 (P = .011), as shown in Table 4.
Table 4.
Consistency analysis of various diagnostic methods comparing our model with the validation set.
| Methods | Sensitivity | Specificity | Accuracy | Kappa | P value |
|---|---|---|---|---|---|
| Cobb | 66.7% | 81.3% | 72.5% | 0.363 | .011 |
11. Discussion
We found that age and flexors were potential risk factors for CR patients. Cervical curvature and endplate degeneration were not associated with pain, limb numbness, pathological signs, concomitant symptoms, or muscle strength. However, patients who suffered from neck and shoulder pain were at risk of developing CR.[11] Since delayed diagnosis and CR treatment could lead to irreversible and serious consequences, early recognition of potential risk factors was important. However, identifying patients who may develop CR remains challenging for clinicians. Therefore, it is crucial to identify the risk factors of CR for its early detection.
12. Difficulties in detecting CR
Accurate detection of CR can be challenging, especially in the early stages, partly due to the lack of awareness of risk factors, poorly understood epidemiology and subtle and nonspecific early features that overlap with other neurological disorders.[4] General conditions, symptoms, and examinations are the most important elements required to detect CR.[4] However, the first 2 are vastly subjective, while the latter lacks an objective evaluation indicator. Therefore, MRI may be the best investigation for all types of CR, especially in emergency patients with disease progression or symptoms seriously impacting limb function. However, the degree of nerve root compression seen on MRI images sometimes does not correlate well with symptom severity, indicating that mild compression can cause serious illness.[12] Adequate knowledge of the risk factors based on imaging characteristics and age factors can help in detecting CR accurately.
13. Risk factors in assessing CR based on imaging characteristics
The neck muscle group has a complex anatomy of flexors and extensors that work together to complete the complex head and neck movements.[13] Morphological differences in cervical PSMs lead to differential effects on the biomechanics of the cervical spine. The basic parameter for evaluating cervical PSMs includes muscle morphometry assessed by CSA. CSA is a quantitative assessment tool employed to measure muscle volume on MRI.[14] In this study, we used the ratio of PSMs/CSA, defined as the value of the CSA of cervical PSMs/CSA of cervical vertebrae on the same cross-sectional slice, instead of using the CSA of PSMs itself to assess morphological changes in the PSMs. This may help to eliminate the confounding effects of the patient age and size since it is an accepted notion that sarcopenia gets worse with age.[15]
Moreover, great relevance was reported between cervical PSMs and cervical dysfunction. Gu et al reported that the degeneration of cervical PSMs was inversely correlated with the effectiveness of cervical traction in CR patients, which was poorly controlled by NSAIDs.[16] Iqbal et al showed that specific training of the deep neck flexors could improve neck pain and dysfunction in teachers with CR.[17] Thakar et al found significant atrophy in both cervical paraspinal flexors and extensors in severe CR patients.[13] Taotao Lin et al demonstrated that the severity of the degeneration of cervical PSMs in CR was associated with the cervical sagittal parameters and neck pain but not with paresthesia, limb weakness, gait disturbance, neurological dysfunction, and bladder/intestinal dysfunction.[9] Due to the differences in the function of the neck flexors and extensors, clinical presentations of CR may also differ, indicating that some muscles may not be associated with CR. Elliott et al reported that in CR patients exhibiting occult neck pain, symptom duration and NDI score were not associated with cervical extensor muscles. Despite the differences in muscle function of the cervical and lumbar spine, the same findings were found in the lumbar, which showed that CSA of lumbar extensor muscles was not related to degenerative spine disease or low back pain.[18] We found that cervical flexor muscle group was related to CR, however, a particular flexor muscle alone may not have been associated with CR. This may be because the neck flexor group as a whole performs the various movements of the neck. Also, it is difficult for a single muscle to complete the complex movements of the neck, independently. Simultaneously, even cervical PSMs may be involved in multiple directional neck movement.
Studies have shown that cervical curvature imbalance and cervical PSMs may be related to the onset and progression of CR. Harrison et al found that the normal cervical curvature was lordotic (16.5–66 degrees), beyond which it was pathological and associated with CR.[2] Smith et al clarified that normal cervical curvature was important for the stability of the cervical spine, where the sagittal imbalance could break down the cervical anatomy resulting in CR.[19] Weng et al studied many parameters of the cervical sagittal balance in CR and found that the more the sagittal balance was outside the normal Cobb angle range, the more severe the symptoms of CR.[20] Yoon et al found that cervical flexors and extensor weaknesses were closely related to the loss of cervical lordosis, indicating the importance of cervical PSM training in the rehabilitation of CR.[21] Koji et al reported that cervical PSMs at the fourth cervical vertebra of CR were closely associated with cervical degeneration, which was evaluated by sagittal parameters.[22] In summary, the degeneration of the cervical PSMs could disrupt the sagittal balance of the cervical spine, which in turn could accelerate the occurrence and progression of CR. Although clinicians may find the value of the cervical PSMs and cervical curvature comparable as risk factors in predicting CR, the PSMs, as the power system of cervical motion innervated by nerve endings, can help in detecting cervical abnormalities along with the early onset and progression of CR. Comparison between the 2 predictive models based on age, flexors, and Cobb angle revealed that the model based on age and flexors performed better (sensitivity 66.7%, specificity 81.3%, accuracy 72.5%), with a kappa value of 0.363 (P = .011).
PSMs possess greater value than cervical disc degeneration for early detection of CR. Nakashima et al found that almost all healthy adults (98%) in their 20s showed early disc degeneration, which was also a common anomaly in people aged between 40 and 50 years.[23] Son et al reported that the sensitivity and specificity of the Pfirrmann classification system were insufficient for diagnosing discogenic pain and also in fully confirming their sources in degenerative disease of the lumbar spine.[10] Moreover, our study found that disc degeneration was inconsistent with the severity of CR. However, Thakar et al reported that deep flexor muscle morphometrics could be introduced in future risk stratification algorithms for cervical degenerative disease.[24] Another biomechanical study showed that cervical PSMs dysfunction had a more pronounced impact on cervical spinal stability than on disc degeneration.[22] Although the intervertebral discs are considered the first element to be affected at the onset of CR, limited evaluation methods have resulted in a lack of more accurate, better, and earlier detection strategies. As the dynamic system of neck movement, cervical PSMs participate in the maintenance of all dynamic and static postures of the neck, which can offer a better and more timely reflection of the occurrence and development of CR.
14. Age, cervical flexors, and CR
An increase in sarcopenia with age is a well-established concept, with studies showing a significant correlation between age and CR. Age remains an important predictive value for CR. Grodzinski et al showed that age was a significant predictor of clinical presentation, course, and outcome of CR.[5] Tamai et al showed a significant correlation between PSMs and the age of CR patients,[15] while another study showed that the patient age was an essential factor in muscle degeneration.[14] Tang et al found significant associations between age and many cervical sagittal balance parameters in CR patients.[25] However, few studies showed no significant correlation between age and muscle degeneration in CR. Lin et al found that age was inversely associated with symptom severity in patients under the age of 50 years but positively associated with patients older than 60, suggesting that older age was associated with more severe symptoms.[9] We used the ROC curve method to assess the ability of age and flexors alone and in combination to predict CR and found that the combination of both indicators exerted the best effect. Furthermore, to clarify the clinical significance of age and cervical flexors in CR, we constructed a clinical predictive model. In the training set, the prediction range of nomograms was between 0.002 and 0.998 (Fig. 3A). The clinical model showed a C-index value of 0.939. The calibration curve showed consistency between the observed and the ideal values (Fig. 3B). Furthermore, the ROC curve verified the accuracy of the model to be as high as 0.939 (Fig. 3C). The net benefit of the clinical predictive model ranged between 0.01 and 0.90 (Fig. 3D). Besides, the internal validation revealed the C-index to be as high as 0.932, suggesting the high accuracy of the model. Additionally, external validation was used to evaluate the model. In the external validation set, the prediction interval for the nomogram ranged between 0.002 and 0.998 (Fig. 4A) and the clinical model showed a C-index value of 0.961. The calibration curve showed consistency between the observed and the ideal values (Fig. 4B). The ROC curve further verified the accuracy of the model to be as high as 0.961 (Fig. 4C). The net benefit of the clinical predictive model ranged between 0.01 and 0.99 (Fig. 4D). Moreover, the internal random validation showed a C-index value of as high as 0.951, suggesting the high accuracy of the model.
15. Limitations of the study
First, since this study was retrospective in nature, it could only identify associations but not confirm causal relationships. Therefore, caution should be taken during result interpretation, and in the future, prospective studies may be needed to confirm and extend our results.
Second, this study had a small sample size. Therefore, expansion of the sample size and further extension to cervical degenerative-related diseases may be beneficial to validate their diagnostic value.
Third, since just the BMI was positively associated with thigh and not a paraspinal fat fraction, we did not record the BMI value.
Despite these limitations, ours is the only study combining age and cervical flexor factors to predict CR. We believe that this study can effectively reduce confounding factors and further clarify the significance of age and cervical flexors in the pathogenesis of CR. In the future, studies should explore the combination of more cervical degenerative factors in the prediction of CR.
16. Conclusions
In this study, 2 models were developed, and their validity was verified for predicting CR. This noninvasive inspection method showed that age and cervical flexors were potential risk factors for CR and can be used to provide more diagnostic power to clinicians for detecting CR accurately.
Author contributions
Conceptualization: Shixin Pan, Chong Liu, Yongqing Ye, Xinli Zhan.
Data curation: Shixin Pan, Chong Liu, Jiarui Chen, Liyi Chen, Tuo Liang, Yongqing Ye.
Formal analysis: Shixin Pan, Chong Liu, Yongqing Ye.
Investigation: Shixin Pan, Chong Liu, Yongqing Ye.
Methodology: Shixin Pan, Xinli Zhan.
Project administration: Shixin Pan, Xinli Zhan.
Resources: Shixin Pan.
Supervision: Xinli Zhan.
Abbreviations:
- CSA
- cross-sectional area
- CR
- cervical radiculopathy
- LC
- longus colli muscle
- LCAP
- longus capitis muscle
- MU
- multifidus muscle
- PSM
- cervical paraspinal muscles
- ROC
- receiver operating characteristic
- SCM
- sternocleidomastoid muscle
- SPCAP
- splenius capitis muscle
- SSC
- semispinalis cervicis muscle
- SSCAP
- semispinalis capitis muscle
All procedures were performed in accordance with relevant guidelines. Written informed consent of patients has been obtained for this study.
Patient provided consent for publication of the data and images.
Data sharing not applicable to this article as no datasets were generated or analyzed during the current study.
The authors have no funding and conflicts of interest to disclose.
To the best of my knowledge and conviction, I can confirm the content of the Manuscript, all or in part, has not been published previously and is not being considered for publication elsewhere.
How to cite this article: Pan S, Liu C, Chen J, Chen L, Liang T, Ye Y, Zhan X. Age and flexors as risk factors for cervical radiculopathy: A new machine learning method. Medicine 2024;103:4(e36939).
Contributor Information
Shixin Pan, Email: 765312703@qq.com.
Chong Liu, Email: lcgxykdx@163.com.
Jiarui Chen, Email: 415960887@qq.com.
Liyi Chen, Email: 415960887@qq.com.
Tuo Liang, Email: 469693260@qq.com.
Yongqing Ye, Email: 237680566@qq.com.
References
- [1].Gao Q-Y, Wei F-L, Zhu K-L, et al. Clinical efficacy and safety of surgical treatments in patients with pure cervical radiculopathy. Front Public Health. 2022;10:892042. [DOI] [PMC free article] [PubMed] [Google Scholar]
- [2].Okada E, Daimon K, Fujiwara H, et al. Twenty-year longitudinal follow-up MRI study of asymptomatic volunteers: the impact of cervical alignment on disk degeneration. Clin Spine Surg. 2018;31:446–51. [DOI] [PubMed] [Google Scholar]
- [3].Smith SS, Stewart ME, Davies BM, et al. The prevalence of asymptomatic and symptomatic spinal cord compression on magnetic resonance imaging: a systematic review and meta-analysis. Global Spine J. 2021;11:597–607. [DOI] [PMC free article] [PubMed] [Google Scholar]
- [4].Davies BM, Mowforth OD, Smith EK, et al. Degenerative cervical myelopathy. BMJ (Clin Res Ed). 2018;360:k186. [DOI] [PMC free article] [PubMed] [Google Scholar]
- [5].Grodzinski B, Durham R, Mowforth O, et al. The effect of ageing on presentation, management and outcomes in degenerative cervical myelopathy: a systematic review. Age Ageing. 2021;50:705–15. [DOI] [PubMed] [Google Scholar]
- [6].Badhiwala JH, Ahuja CS, Akbar MA, et al. Degenerative cervical myelopathy—update and future directions. Nat Rev Neurol. 2020;16:108–24. [DOI] [PubMed] [Google Scholar]
- [7].Nouri A, Martin AR, Mikulis D, et al. Magnetic resonance imaging assessment of degenerative cervical myelopathy: a review of structural changes and measurement techniques. Neurosurg Focus. 2016;40:E5. [DOI] [PubMed] [Google Scholar]
- [8].Cohen SP, Hooten WM. Advances in the diagnosis and management of neck pain. BMJ. 2017;358:j3221. [DOI] [PubMed] [Google Scholar]
- [9].Lin T, Wang Z, Chen G, et al. Predictive effect of cervical spinal cord compression and corresponding segmental paravertebral muscle degeneration on the severity of symptoms in patients with cervical spondylotic myelopathy. Spine J. 2021;21:1099–109. [DOI] [PubMed] [Google Scholar]
- [10].Son S, Lee SG, Kim WK, et al. Disc height discrepancy between supine and standing positions as a screening metric for discogenic back pain in patients with disc degeneration. Spine J. 2021;21:71–9. [DOI] [PubMed] [Google Scholar]
- [11].Goedmakers CMW, Lak AM, Duey AH, et al. Deep learning for adjacent segment disease at preoperative MRI for cervical radiculopathy. Radiology. 2021;301:664–71. [DOI] [PubMed] [Google Scholar]
- [12].Nouri A, Tetreault L, Singh A, et al. Degenerative cervical myelopathy: epidemiology, genetics, and pathogenesis. Spine (Phila Pa 1976). 2015;40:E675–93. [DOI] [PubMed] [Google Scholar]
- [13].Thakar S, Mohan D, Furtado SV, et al. Paraspinal muscle morphometry in cervical spondylotic myelopathy and its implications in clinicoradiological outcomes following central corpectomy: clinical article. J Neurosurg Spine. 2014;21:223–30. [DOI] [PubMed] [Google Scholar]
- [14].Tamai K, Chen J, Stone M, et al. The evaluation of lumbar paraspinal muscle quantity and quality using the Goutallier classification and lumbar indentation value. Eur Spine J. 2018;27:1005–12. [DOI] [PubMed] [Google Scholar]
- [15].Tamai K, Grisdela P, Romanu J, et al. The impact of cervical spinal muscle degeneration on cervical sagittal balance and spinal degenerative disorders. Clin Spine Surg. 2019;32:E206–13. [DOI] [PubMed] [Google Scholar]
- [16].Gu Y, Wu Q, Luo S, et al. Is cervical traction effective in chronic nonspecific neck pain patients with Unsatisfactory NSAID Control? A nomogram to predict effectiveness. World Neurosurg. 2020;139:e245–54. [DOI] [PubMed] [Google Scholar]
- [17].Iqbal ZA, Alghadir AH, Anwer S. Efficacy of deep cervical flexor muscle training on neck pain, functional disability, and muscle endurance in school teachers: a clinical trial. Biomed Res Int. 2021;2021:7190808. [DOI] [PMC free article] [PubMed] [Google Scholar]
- [18].Teichtahl AJ, Urquhart DM, Wang Y, et al. Fat infiltration of paraspinal muscles is associated with low back pain, disability, and structural abnormalities in community-based adults. Spine J. 2015;15:1593–601. [DOI] [PubMed] [Google Scholar]
- [19].Smith JS, Shaffrey CI, Lafage V, et al. Spontaneous improvement of cervical alignment after correction of global sagittal balance following pedicle subtraction osteotomy. J Neurosurg Spine. 2012;17:300–7. [DOI] [PubMed] [Google Scholar]
- [20].Weng C, Wang J, Tuchman A, et al. Influence of T1 slope on the cervical sagittal balance in degenerative cervical spine: an analysis using kinematic MRI. Spine (Phila Pa 1976). 2016;41:185–90. [DOI] [PubMed] [Google Scholar]
- [21].Yoon SY, Moon HI, Lee SC, et al. Association between cervical lordotic curvature and cervical muscle cross-sectional area in patients with loss of cervical lordosis. Clin Anat. 2018;31:710–5. [DOI] [PubMed] [Google Scholar]
- [22].Fortin M, Dobrescu O, Courtemanche M, et al. Association between paraspinal muscle morphology, clinical symptoms, and functional status in patients with degenerative cervical myelopathy. Spine. 2017;42:232–9. [DOI] [PubMed] [Google Scholar]
- [23].Nakashima H, Yukawa Y, Suda K, et al. Cervical disc protrusion correlates with the severity of cervical disc degeneration: a cross-sectional study of 1211 relatively healthy volunteers. Spine (Phila Pa 1976). 2015;40:E774–9. [DOI] [PubMed] [Google Scholar]
- [24].Thakar S, Arun AA, Aryan S, et al. Deep flexor sarcopenia as a predictor of poor functional outcome after anterior cervical discectomy in patients with myelopathy. Acta Neurochir (Wien). 2019;161:2201–9. [DOI] [PubMed] [Google Scholar]
- [25].Tang R, Ye IB, Cheung ZB, et al. Age-related changes in cervical sagittal alignment: a radiographic analysis. Spine. 2019;44:E1144–50. [DOI] [PubMed] [Google Scholar]


