

Abstract
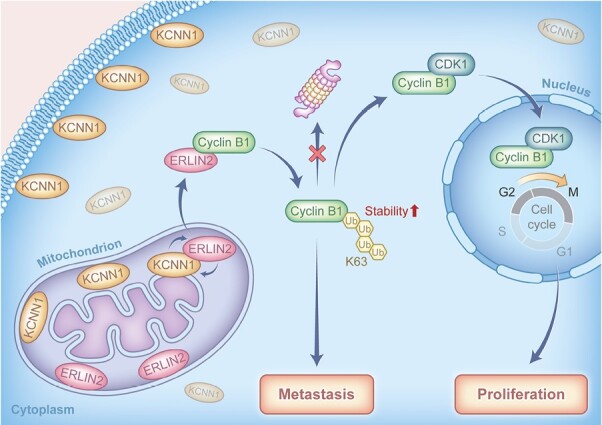
Potassium Calcium-Activated Channel Subfamily N1 (KCNN1), an integral membrane protein, is thought to regulate neuronal excitability by contributing to the slow component of synaptic after hyperpolarization. However, the role of KCNN1 in tumorigenesis has been rarely reported, and the underlying molecular mechanism remains unclear. Here, we report that KCNN1 functions as an oncogene in promoting breast cancer cell proliferation and metastasis. KCNN1 was overexpressed in breast cancer tissues and cells. The pro-proliferative and pro-metastatic effects of KCNN1 were demonstrated by CCK8, clone formation, Edu assay, wound healing assay and transwell experiments. Transcriptomic analysis using KCNN1 overexpressing cells revealed that KCNN1 could regulate key signaling pathways affecting the survival of breast cancer cells. KCNN1 interacts with ERLIN2 and enhances the effect of ERLIN2 on Cyclin B1 stability. Overexpression of KCNN1 promoted the protein expression of Cyclin B1, enhanced its stability and promoted its K63 dependent ubiquitination, while knockdown of KCNN1 had the opposite effects on Cyclin B1. Knockdown (or overexpression) ERLNI2 partially restored Cyclin B1 stability and K63 dependent ubiquitination induced by overexpression (or knockdown) of KCNN1. Knockdown (or overexpression) ERLIN2 also partially neutralizes the effects of overexpression (or knockdown) KCNN1-induced breast cancer cell proliferation, migration and invasion. In paired breast cancer clinical samples, we found a positive expression correlations between KCNN1 and ERLIN2, KCNN1 and Cyclin B1, as well as ERLIN2 and Cyclin B1. In conclusion, this study reveals, for the first time, the role of KCNN1 in tumorigenesis and emphasizes the importance of KCNN1/ERLIN2/Cyclin B1 axis in the development and metastasis of breast cancer.
Graphical Abstract
Graphical Abstract.
Introduction
Although the overall survival and prognosis of breast cancer patients have been improved in recent years (1), the development of metastatic disease is still the leading cause of poor prognosis of patients with breast cancer (2). The mechanism of breast cancer metastasis may be the result of the interactions and signal transduction of multiple genes and protein products (3), and identifying the molecular mechanism of breast cancer metastasis is the biological basis for developing new treatment strategies (4).
Potassium Calcium-Activated Channel Subfamily N1 (KCNN1) is a KCNN family member that was widely distributed in cytoplasmic membrane and intima of cells. Recent studies showed that KCNN1 also co-locates with cytoskeleton actin filaments (5). The expression of KCNN1 was decreased by knockdown of HDACs 2, 3, 6 and 7 and enhanced by HDAC9 inactivation, while siRNAs targeting HDACs 1, 4 and 5 did not affect KCNN1 mRNA level (6). Although the function of KCNN1 has been extensively studied in central nervous system and glioma, its biological effects in malignancies especially in breast cancer are still unknown.
Endoplasmic reticulum lipid raft-associated protein 2 (ERLIN2) is a mitochondrial lipid raft protein, which locates in lipid raft on mitochondrial membrane (7). ERLIN2 gene is located in region 11 (8P11) of the short arm of chromosome 8. In previous reports, ERLIN2 was considered as candidate oncogene located on chromosome 8p11-12 (8,9), and amplification might induce malignant transformation correlated with the poor prognosis of breast cancer patients (10,11). MicroRNAs (miRNAs) are widely expressed in human cells and are closely related to the development of various cancers. It has been reported in the literature that miR-876-5p inhibits the proliferation, migration and invasion ability of breast cancer cells by directly targeting TFAP2A, and that overexpression of miR-410-3p promotes the proliferation and invasion of breast cancer cells (12,13). In addition, the expression of ERLIN2 was negatively regulated by miR-410 and miR-876-5p, and ERLIN2 could restore the inhibitory effects of miR-410 and miR-876-5p on cell proliferation, metastasis and EMT processes (14,15). Overexpression of ERLIN2 promoted the proliferation of normal breast cells MCF10A, while knockdown of ERLIN2 inhibited the proliferation and survival of breast cancer cells SUM-44 and SUM-225, suggesting that ERLIN2 is an oncogene (16). Additionally, ERLIN2 binds to Cyclin B1 and promotes Cyclin B1 stability through Lysine residue 63 (K63)—dependent ubiquitination (17).
Cyclins are critical to cell cycle progression. Cyclin D1 and E1 are widely studied in breast cancer, but cyclin B1 is rarely studied in breast cancer (18–28). Cyclin B1 and CDK1 can form a functional complex, which is crucial for G2/M transition and cell proliferation (29,30). The stability of Cyclin B1 is critical to cell cycle progression. Studies have shown that reduced Cyclin B1 stability can arrest the cell cycle in G2/M phase, thus affecting the proliferation of tumor cells (31,32). The abnormal expression of cyclin B1 is considered as a tumor associated antigen, which is highly expressed in multiple types of cancer, including breast cancer (33–37).
The function of CylinB 1 is determined by subcellular localization during the cell cycle, and is regulated by phosphorylation (38,39). It is reported that the overexpression of CylinB 1 leads to poor prognosis of patients with breast cancer (40,41). Cyclin B1 also plays an important role in breast cancer metastasis. Multiple tumor suppressor genes or miRNAs have been reported to inhibit breast cancer metastasis by downregulation of Cyclin B1 (42–45). In addition, a number of studies suggested that Cyclin B1 mainly affects tumor metastasis through the epithelial-mesenchymal transition (EMT) pathway. In esophageal squamous cell carcinoma and an melanoma, it has been shown that the main mechanism of action of Cyclin B1 is to promote (46,47).
In this study, we have clarified the role of KCNN1 in stabilizing ERLIN2/Cyclin B1 pathway and the proliferation and metastasis of breast cancer cell. This study will provide a foundation for the potential molecular targeted strategy on KCNN1/ERLIN2/Cyclin B1 pathway.
Materials and methods
Cell lines and cell culture
Breast cancer cell lines (MCF10A, BT474, MDA-MB-453, MCF7, SK-BR-3, HCC1937 and MDA-MB-231) and 293T cells were obtained from the National Collection of Authenticated Cell Cultures and identified by STR. Breast cancer cell lines (MCF10A, BT474, MDA-MB-453, MCF7, SK-BR-3, HCC1937 and MDA-MB-231) and 293T cells cultured in Dulbecco’s modified Eagle’s medium (DMEM) supplemented with 10% (v/v) fetal bovine serum (FBS) and 1% antibiotics (Gibco) in a humidified incubator containing 5% CO2 at 37°C.
Construction of plasmids, KCNN1 stably overexpressing cells and KCNN1 stably silencing cells
HA-Ub (wt), HA-Ub (K63) and HA-Ub (K63R) were purchased from Focus biology (Nanchang, China). The information of other plasmids, including Flag-KCNN1, GFP-KCNN1, HA-ERLIN2, DsRed-ERLIN2, Flag-Cyclin B1 and HA-Cyclin B1 were listed in Supplementary Table 1, available at Carcinogenesis Online. siRNA targeting KCNN1 and ERLIN2 were purchased from RioBio Co., Ltd. (Guangzhou, China) (Supplementary Table 1 is available at Carcinogenesis Online). The KCNN1 overexpressing cells and KCNN1 knockdown cells were constructed using Psin-puro and LentiCRISPR lentiviral expression system, respectively.
KCNN family members expression from TCGA database
The RNA sequencing data and matching clinical information of breast cancer were downloaded from TCGA database (https://www.cancer.gov/about-nci/organization/ccg/research/structural-genomics/tcga). A total of 797 samples with complete HER2, PR and ER expression status information from clinical data were screened and classified according to the following criteria: A. HER2+ subtype (37): HER2+, ER− and PR−; B. Luminal A (443): ER+ (or PR+) and HER2−; Luminal B (126): ER+ (or PR+) and HER2+; D. TNBC (115): ER−, PR− and HER2−; E. Normal (76). The mRNA expressions of KCNN families members (KCNN1, KCNN2, KCNN3) were screened from the RNA sequencing data. R software package pheatMap (Version:1.0.8, https://cran.r-project.org/web/packages/pheatmap/index.html) was used to draw the heat maps of KCNN1, KCNN2 and KCNN3. The expression value of each gene was proceeded in log2 logarithmic transformation.
Immumohistochemical staining
To confirm the expression of KCNN1 in breast cancer tissues, immumohistochemical (IHC) was performed using tissue microarrays containing 140 breast cancer tissue samples and 90 paracancer tissue samples. To compare the correlation between KCNN1, ERLIN2 and Cyclin B1, we used three identical tissue microarray containing 30 breast cancer tissues and 30 paired paracancer tissues. First, paraffin sections were dewaxed orderly in xylene I, II, III and graded concentrations of ethanol, followed by cleaning with distilled water. The tissue chips were placed in 0.01 M citric acid antigen repair buffer (PH = 6.0) and boiled in the microwave oven for 4 min, then cooled to room temperature, repeated twice and washed in PBS for three times. The slices were soaked with preheated cell permeable solution (40 ml PBS + 120 µl TritonX-100 + 400 µl 30% H2O2) for 30 min at room temperature to reduce the activity of endogenous peroxidase. The non-specific binding sites were blocked with serum from the same source as the second antibody. The sections were incubated with 20 µl anti-KCNN1 antibody (Cat: GTX47694, 1:200 dilution, GeneTex) at 4°C overnight and washed in PBS for three times, followed by incubation with 20 µl goat anti-rabbit antibody at 37°C for 1.5 h, then washed in PBS three times for 3 min each time. The cells were stained with DAB-H2O2 for 10 min and hematoxylin for 3 min. Finally, the slices were dehydrated orderly in 75% alcohol for 5 min—85% alcohol for 5 min—anhydrous ethanol for 5 min—xylene I for 5 min, and sealed with neutral gum.
Slices were scanned by 3D HISTECH Pannoramic MIDI scanner, and immunohistochemical staining scores were performed by Densito Quant Software (Quant Center). The areas of strongly positive (dark brown), moderately positive (brown–yellow), weakly positive (light yellow) and negative (blue) were calculated, and H-Score was obtained. H-score = ∑(PI × I) = (weakly positive PI × 1) + (moderately positive PI × 2) + (strongly positive PI × 3). PI represents the percentage of positive staining cells in all cells in the section, and I represents the color intensity.
Real-time fluorescence quantitative PCR
Real-time fluorescence quantitative PCR (RT-qPCR) was used to detect the mRNA expression levels of KCNN1, ERLIN2 and Cyclin B1 genes under different conditions. Total RNA was extracted by Trizol (ABI, Cat: 15596026). cDNA was obtained by reverse transcription using PrimeScript RT Kit (Takara, Cat: RR037A). The reaction conditions for RT-qPCR reaction was 95°C for 30 s, 95°C for 5 s, 60°C for 30 s with a total of 40 cycles. The relative quantitative analysis of differential expression was performed by 2−∆ Ct method. The primers used in RT-qPCR were as listed in Supplementary Table 1, available at Carcinogenesis Online.
Western blot
The cells were collected with RIPA lysis solution on ice for 30 min. After centrifugation, the cell supernatant was mixed with 5 × SDS loading buffer. After protein denaturation, SDS-PAGE gel electrophoresis was performed. The blot was transferred to PVDF membrane at the conditions of 2.5 mA and 25 V. The PVDF membrane was placed in 5% skim milk and sealed at room temperature for 1.5 h. The primary antibody was added and incubated at 4°C overnight. The membrane was washed by TBST for three times. The second antibody was added and incubated at room temperature for 1 h, then the membrane was washed with TBST for three times. Finally, the signal was detected by ECL chemiluminescence.
CCK8 assay
Breast cancer cells were transfected with corresponding plasmid. On the 1st, 2nd, 3rd, 4th and 5th days after cell transfection, CCK-8 reagent was added and cells were incubated at 37°C, 5% CO2 for 2 h. The OD value was detected at 450 nm wavelength using the microplate reader.
Clone formation assay
Cells were plated in a six-well plate at 8000 cells per well. When the cells grew to more than 50 cells in a single cell cluster, the cell culture supernatant was discarded and cells were fixed with 4% paraformaldehyde for 1 h, followed by 1% crystal violet solution staining for 1 h. The cells were cleaned three times with PBS. After drying, the cells were photographed by camera, and the number of monoclones was calculated by ImageJ.
Cell proliferation detection by Edu
Cells with KCNN1 stably overexpression, KCNN1 stably knockout and their control cells were plated in 96-well plates, respectively. EDU (50μM) medium was added into the 96-well plate according to 100UL volume per well, and cultured for 2 hours, then washed with PBS twice for 5 minutes each time. 50 μl glycine at a concentration of 2 mg/ml was added to each well, and cells were incubated in a shaker for 10 min. Cells were stained with 1 × Apollo® staining solution, and mixed in a decolorizing shaker at room temperature for 30 min, then discard the staining solution. Cells were permeabilized with 0.5% Triton X-100 for 15 min and stained with 100 μl 1 × Hoechst 33342. Edu-positive cells were observed and photographed under a microscope.
Wound healing assay
Cells were plated in a six-well plate at 800 000 cells per well. When cell confluence reached 100%, draw three vertical lines in each well with 200 μl pipette tip. Cells were washed twice with PBS, and cultured by the complete medium. The cells were photographed under the microscope at 0 h, 24 h and 48 h, respectively. Image J software was used to analyze the scratch area. Scratch healing rate = (0 h scratch area − 48h scratch area)/0 h scratch area × 100%.
Transwell migration and invasion assay
2 × 10⁵/ml cell suspension prepared with 200 µl serum-free medium was added to the upper chamber of transwell and 500 µl DMEM medium containing 10% FBS was added to the lower chamber. 48 h later, the chamber was washed with PBS, and the cells on the membrane surface at the bottom of the upper chamber were wiped. The cells were stained with 0.1% crystal violet for 10 min. After washing with PBS, the migrated cells were photographed and counted in six randomly selected fields under the microscope. The experiment procedure of transwell invasion assay was as same as transwell migration, excepting that an invasion chamber was used instead of the transwell migration plate.
Transcriptome sequencing and differentially expressed gene analysis
A total of 1 × 10⁶ KCNN1 overexpressing MCF7 cells and control cells at logarithmic growth stage were collected and total RNA was extracted by Trizol method. The purity and concentration of RNA were detected by Nanodrop. RNA integrity was accurately detected using agilent 2100. The complementary DNA library was constructed by reverse‐transcribing RNA fragments using the mRNA‐Seq sample preparation kit (Illumina, San Diego, CA) and sequencing was performed using Illumina Novaseq platform. Differential expression analysis was conducted according to the expression levels of genes in KCNN1 overexpressing cells and control cells. Log2FC (fold change) ≥ 1 and FDR (false discovery rate) < 0.05 were used as screening criteria.
The expression levels of differentially expressed genes (DEGs) were analyzed by clustering, functional annotation and functional enrichment. The volcano plot, Gene ontology (GO) enrichment (www.geneontology.org) and KEGG (www.genome.jp/kegg/) pathway analyses were performed to analyze and classify the DEGs.
Co-immunoprecipitation
The indicating expression plasmids were co-transfected into 293T cells or breast cancer cells. 48 h after transfection, cells were lysed with RIPA solution and supernatant was collected after centrifugation. 50 μl supernatant was considered as internal reference sample. The remaining samples were mixed with 30 μl Protein G agarose beads, and rotated at 4°C for 2 h. The protein extracts were then incubated with corresponding Flag or HA antibodies overnight, centrifuged and washed for five times. The expression levels of KCNN1, ERLIN2 and Cyclin B1 in the reference sample and IP sample were detected by western blot.
Immunofluorescence
The constructed KCNN1-EGFP and ERLIN2-DSRED expression plasmids were co-transfected into MCF7 cells. After 36 h, the cells were washed with PBS three times and immobilized with 4% paraformaldehyde for 15 min, followed by permeation with 1% Triton X-100 at room temperature for 10 min. After washed with PBS, cells were blocked with PBST for 30 min, followed by DAPI working solution staining at room temperature for 10 min away from light. The plates were sealed with neutral gum and images were obtained using a confocal laser microscope.
Stability assay
Proteasome inhibitor MG132 was added at different time points (0 min, 30 min, 60 min, 90 min and 120 min) to the KCNN1 overexpressing cells and the control cells. Cells at each time point were collected, and the expression of endogenous Cyclin B1 was identified by western blot. β-actin was used as internal control.
Ubiquitination assay
In the corresponding ubiquitination experiment, MCF7 cells were transfected with KCNN1-EGFP and its control plasmid, co-transfected with Flag-cyclin B1 or siERLIN2, and transfected with HA-Ub (wt), HA-Ub (K63) or HA-Ub (K63R), respectively. Cyclin B1 protein was pulled down by anti-flag antibody captured by magnetic beads. The magnetic beads were washed, and the ubiquitin level of Cyclin B1 was determined by western blot using HA antibody.
Statistical analysis
SPSS 22.0 software and GraphPad Prism was used for data analysis. The measurement data were tested for normality and homogeneity of variance. The measurement data with normal distribution and homogeneity of variance were expressed as mean ± standard deviation (X ± S), and the t-test was used for comparison of mean values between groups. Analysis of variance was used to compare the mean values of multiple groups. Non-normal distribution data were represented by median ± quartile spacing (M ± IRQ), and Wilcoxon rank-sum test was used to compare groups. P < 0.05 was considered to be statistically significant.
Results
The expression of KCNN1 was up-regulated in breast cancer tissues and cells
To compare the mRNA expression levels of KCNN family genes in breast cancer tissues, we obtained the expression levels of KCNN1, KCNN2 and KCNN3 in different molecular subtypes of breast cancer tissues from TCGA database. Compared with KCNN2 and KCNN3, KCNN1 exhibited the lowest endogenous mRNA expression level in tissues. Interestingly, KCNN1 showed the highest expression level in triple negative breast cancer (TNBC), the molecular subtype with the worst prognosis in breast cancer (Figure 1A). Overall, mRNA expression level of KCNN1 in breast cancer tissues was not significantly higher than that in adjacent tissues (Figure 1A and B). However, the results of breast cancer tissue microarray showed that the protein expression level of KCNN1 in breast cancer tissues was significantly higher than that in adjacent tissues, and the staining of KCNN1 indicated that KCNN1 was mainly located in the cytoplasm (Figure 1C). To further clarify the expression characteristics of KCNN1 in breast cancer cells, we selected normal breast cells MCF10A and breast cancer cells with different phenotypes, genotypes, and aggressiveness to identify the mRNA and protein expression levels of KCNN1. RT-qPCR results showed that the expression level of KCNN1 was the lowest in MCF10A, while the expression level was the highest in more invasive TNBC cells (Figure 1D). Western blot results further confirmed that KCNN1 showed the highest expression in TNBC cells HCC1954 and the lowest expression in MCF10A (Figure 1E). These results suggest that KCNN1 may be a potential oncogene of breast cancer.
Figure 1.
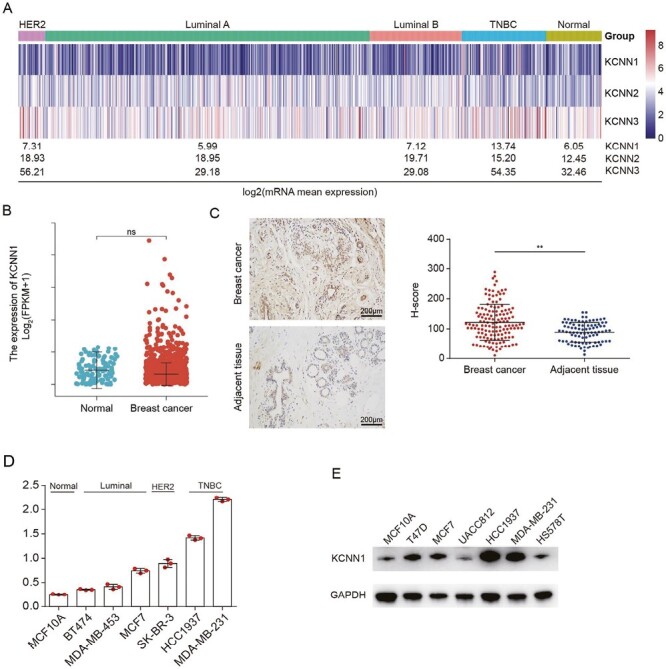
The expression of KCNN1 in breast cancer. (A) Heat map showing the mRNA expression of KCNN family proteins, including KCNN1, KCNN2 and KCNN3, in different molecular subtypes of breast cancer samples. The mean expressions of these genes in each subtype were converted by log2 transformation. The original gene expression data comes from TCGA database. (B) The mRNA level of KCNN1 in 1109 breast cancer samples and 113 normal samples. The original gene expression data comes from TCGA database. (C) The protein expression of KCNN1 in 140 breast cancer samples and 90 paracancer tissues were evaluated by IHC. The H-score represented the relative KCNN1 staining intensity. (D) The mRNA expression of KCNN1 in representative breast cancer cells with different molecular subtypes was determined by RT-qPCR. (E) Western blot showing the protein expression of KCNN1 in the same breast cancer cell lines as indicated in (D). **P < 0.01 by One-way ANOVA. ns, No significant.
KCNN1 promoted the proliferation, migration and invasion of breast cancer cells
Since KCNN1 is highly expressed in breast cancer tissues and cells, we speculate that KCNN1 may play a key role in the development and progression of breast cancer. We constructed breast cancer cell MCF7 with KCNN1 stable expression and MDA-MB-231 with KCNN1 stable knockdown (Figure 2A). The CCK8 assay showed a significant increase in the proliferation rate of breast cancer cells overexpressing KCNN1 compared to the control cell (Figure 2B). Knockdown of KCNN1 inhibited the proliferation of breast cancer cells (Figure 2C). Clone formation assay showed that overexpression of KCNN1 significantly enhanced the growth ability of breast cancer monoclonal cells, while silencing KCNN1 significantly weakened the clone formation ability of breast cancer cells (Figure 2D). Edu experiment further confirmed that after KCNN1 was overexpressed, the proportion of active cells with Edu-positive staining was significantly increased (Figure 2E), indicating that the DNA replication activity of these cells was significantly strengthened. Inversely, knocking down of KCNN1 resulted in a significant decrease in the proportion of Edu positive staining cells (Figure 2F). To evaluate the role of KCNN1 in breast cancer cell metastasis, we conducted cell migration and invasion experiments. In the wound healing experiment, the migration rate of cells overexpressing KCNN1 to the wound center was significantly increased (Figure 2G), and the migration ability of cells was inhibited by knocking down KCNN1 (Figure 2H). In the transwell migration and invasion experiments, the migration and invasion ability of MCF7 cells were enhanced after overexpression of KCNN1 (Figure 2I), while the biological effect of knockdown KCNN1 on migration and invasion was opposite (Figure 2J).
Figure 2.
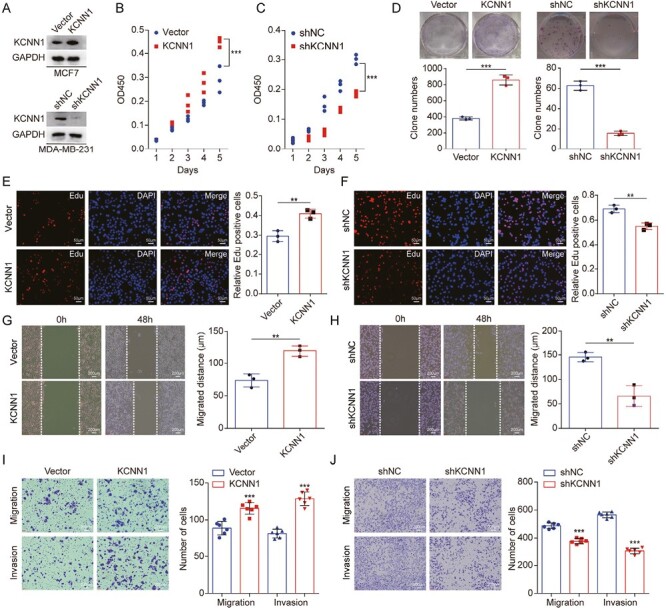
The effect of KCNN1 on breast cancer cell proliferation and metastasis. (A) Western blot identified the KCNN1 overexpression and KCNN1 knockdown cells using lentiviral expression system and siRNA in MCF7 and MDA-MB-231. (B and C) CCK8 assay showing the effect of KCNN1 overexpression (B) and KCNN1 knockdown (C) on the proliferation of MCF7 and MDA-MB-231, respectively. (D) Clone formation assay measuring the clone number of MCF7 with KCNN1 overexpression and MDA-MB-231 with KCNN1 knockdown. (E and F) Edu assay showing the number of Edu staining cells in MCF7 with KCNN1 overexpression (F) and MDA-MB-231 with KCNN1 knockdown (G). (G and H) Cell migration ability affected by KCNN1 overexpression (G) and KCNN1 knockdown (H) was detected by wound healing assay. (I and J) The effect of KCNN1 overexpression (I) and KCNN1 knockdown (J) on breast cancer cell migration and invasion was measured by transwell assay. *P < 0.05, **P < 0.01 and ***P < 0.001 by One-way ANOVA.
Together, these results indicated that KCNN1 promoted breast cancer cell growth and metastasis.
Differentially expressed genes and signaling pathways in KCNN1 overexpressing cells versus the control cells
To our knowledge, most KCNN1 related studies have been reported on the central nervous system disease, the gene expression and signaling pathways controlled by KCNN1 in tumors are largely unknown. To obtain a comprehensive gene expression profile regulated by KCNN1, we performed high-throughput RNA sequencing using MCF7 cells with KCNN1 overexpression and the control cells. Using |log2Ratio| ≥ 1 and q value ≤ 0.05 as the screening criteria, we found that 821 genes were differentially expressed in these cells being 121 genes up-regulated and 700 down-regulated (Figure 3A and Supplementary Table 2 is available at Carcinogenesis Online). Although KCNN1 is not a transcription factor that directly regulate gene expression, it can still lead to the dysregulated expression of a cluster of important genes, and the number of negatively regulated genes were significantly higher than that of positively regulated genes. Gene Ontology (GO) analysis showed that DEGs were mainly enriched in regulation of gene expression (classified as biological process), binding (classified as cellular component) and intracellular part (classified as molecular function) (Figure 3B). The Kyoto Encyclopedia of Genes and Genomes (KEGG) analysis showed the top 20 signaling pathways affected by KCNN1 overexpression, most of which are closely related to proliferation and metastasis of breast cancer cells (Figure 3C). We selected 5 upregulated and 27 down-regulated DEGs which were representative genes enriched in Toll like receptor signaling pathway, NF-Kappa B signaling pathway, JAK-STAT signaling pathway and cytokine–cytokine receptor interaction as indicated in KEGG analysis for RT-qPCR verification. The RT-qPCR results of all selected genes were consistent with the expression trend of RNA sequencing (Figure 3D). Overall, these results suggest that KCNN1 may control breast cancer cell proliferation and metastasis through the expression of these DEGs or switching the on and off of related signaling pathways.
Figure 3.
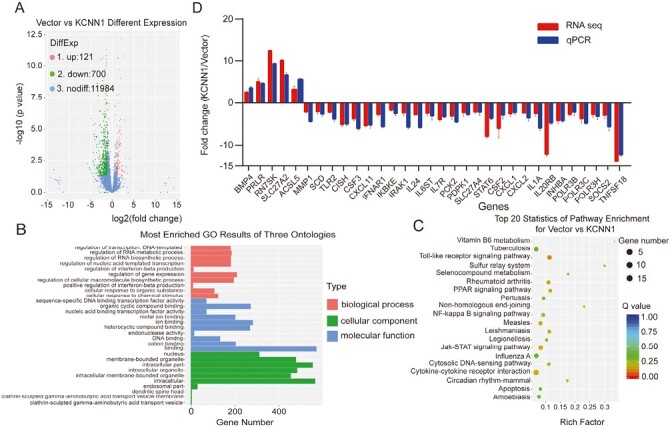
Identification of the key gene expression and signaling pathway regulated by KCNN1. (A) Volcano Plot of the DEGs in KCNN1 overexpressing cells compared with the control cells. (B) GO analysis of the DEGs. (C) KEGG analysis of the DEGs. (D) Identification of 32 DEGs by qPCR and the comparison of qPCR result with the original RNA sequencing result for each DEG.
KCNN1 interacted with ERLIN2, but not Cyclin B1
As an intracellular transmembrane protein, we believed that the direct mechanism of KCNN1 is mainly through the transmission of functional signals between interacting proteins, rather than regulating gene expression. Therefore, we focused on the KCNN1 interacting proteins as the breakthrough point of the molecular mechanism centered on KCNN1. Using Flag-KCNN1 plasmid as a bait, we pulled down the KCNN1 interacting proteins in 293T cells, and identified the composition of the interacting proteins by LC–MS/MS. After removing non-specific binding proteins from the control group, a total of 268 interacting proteins were obtained. Among them, the endoplasmic reticulum-associated protein ERLIN2 (unique peptide = 5) attracted our attention. ERLIN2 has been reported to promote cell proliferation and metastasis in breast cancer, lung cancer and astrocytoma, while KCNN1 also locates in the endoplasmic reticulum and plays a similar biological role. The bidirectional immunoprecipitation experiment confirmed that Flag-KCNN1 successfully captured HA-ERLIN2 in 293T cells transfected with both plasmids (Figure 4A). On the contrary, Flag-KCNN1 can also pull down HA-ERLIN2 (Figure 4B). Further immunofluorescence assay was used to determine the subcellular localization of KCNN1 and ERLIN2. It was found that GFP-KCNN1 and dsRed-ERLIN2 were co-located in the cytoplasm, and their fluorescence was almost completely coincident (Figure 4C). To explore the direct factor affecting breast cancer proliferation and metastasis downstream of ERLIN2, we continue to extract valuable information from ERLIN2-related studies. ERLIN2 can interact with mitosis-promoting complex Cyclin B1/CDK1 and enhanced the stability of Cyclin B1 by K63-linked ubiquitination. Moreover, Cyclin B1 is an important factor affecting the proliferation, invasion, metastasis and prognosis of breast cancer. We speculated whether KCNN1 interacts with Cyclin B1. However, we did not find Cyclin B1 in the interaction protein profile of KCNN1. Bidirectional immunoprecipitation confirmed that KCNN1 did not interact with Cyclin B1 (Figure 4D and E).
Figure 4.
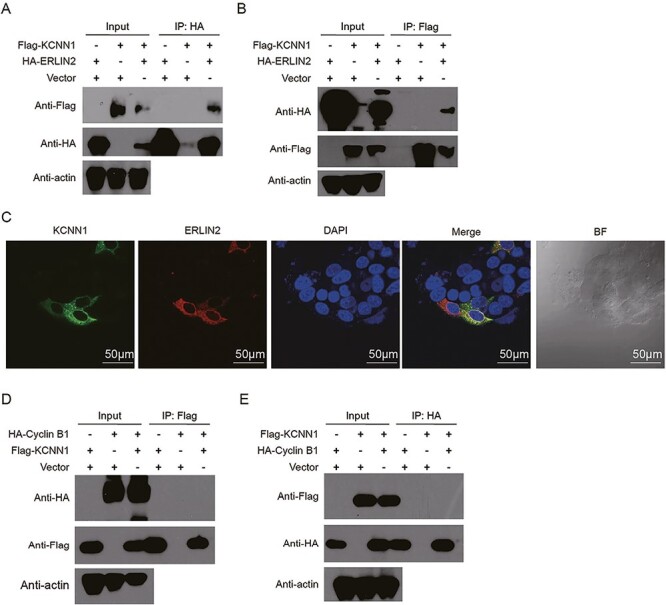
Validation of the interaction between KCNN1 and ERLIN2, as well as KCNN1 and Cyclin B1. (A) Co-immunoprecipitation (co-IP) showing the interaction between KCNN1 and ERLIN2. ERLIN2 immunoprecipitates were analyzed with HA tag antibody recognizing ERLIN2 and Flag tag antibody recognizing KCNN1. (B) co-IP showing the interaction between KCNN1 and ERLIN2. ERLIN2 immunoprecipitates were analyzed with HA tag antibody recognizing ERLIN2 and Flag tag antibody recognizing KCNN1. (C) The colocalization of KCNN1 and ERLIN2 in MCF7 cells. Scan bar = 50 μM. (D) The interaction between KCNN1 and Cyclin B1 was identified by co-IP. KCNN1 immunoprecipitates were analyzed with Flag tag antibody recognizing KCNN1 and HA tag antibody recognizing Cyclin B1. (E) The interaction between KCNN1 and Cyclin B1 was identified by co-IP. Cyclin B1 immunoprecipitates were analyzed with HA tag antibody recognizing Cyclin B1 and Flag tag antibody recognizing KCNN1.
KCNN1 promoted the K63 dependent ubiquitination of Cyclin B1 through ERLIN2
As KCNN1 could interact with ERLIN2, but not Cyclin B1, we speculated that KCNN1 could affect the stability and ubiquitination of Cyclin B1 via ERLIN2. Firstly, overexpression (knockdown) of KCNN1 had no significant effect on mRNA expression levels of ERLIN2 and Cyclin B1, indicating that KCNN1 was not involved in gene transcription regulation of ERLIN2 and Cyclin B1 (Figure 5A and B). Western blot showed that overexpression of KCNN1 promoted the protein expression level of Cyclin B1, while knockdown of KCNN1 inhibited the Cyclin B1 expression, but KCNN1 had no effect on the protein level of ERLIN2 (Figure 5C). In the stability experiments, we treated KCNN1 overexpressing cells and the control cells with proteasome inhibitor MG132, and found that overexpression of KCNN1 could promote the accumulation of Cyclin B1 (Figure 5D). In the ubiquitination assay, overexpression of KCNN1 enhanced the ubiquitination level of Cyclin B1 (Figure 5E), while the ubiquitination level of Cyclin B1 was significantly decreased when lysine at site 63 (K63) of the ubiquitin chain was mutated to arginine (K63R) (Figure 5F). To further confirm whether KCNN1 affects the ubiquitination and expression of Cylin B1 through ERLIN2, we knocked down ERLIN2 in MCF7 cells overexpressing KCNN1. Knock down of ERLIN2 partially recovered the up-regulation of Cyclin B1 expression affected by KCNN1 overexpression (Figure 5G). Inversely, the upregulation of ERLIN2 can partially reverse the KCNN1-mediated downregulation of Cyclin B1 expression (Figure 5H). More importantly, after knocking down of ERLIN2, the increased ubiquitin level of Cyclin B1 induced by overexpression of KCNN1 was significantly inhibited (Figure 5I). Therefore, KCNN1 promotes the K63-dependent ubiquitination of Cyclin B1 through ERLIN2, thereby enhancing the stability and expression level of Cyclin B1.
Figure 5.
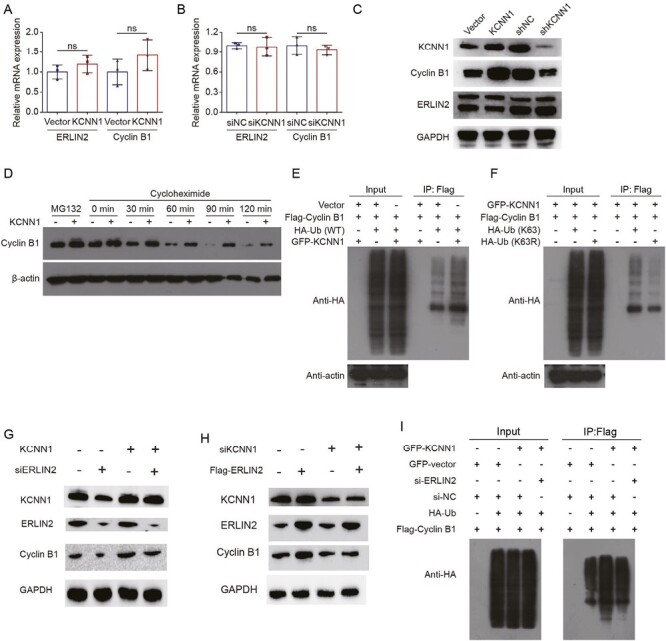
The effect of KCNN1 on the mRNA expression, protein stability and ubiquitination of Cyclin B1. (A) The mRNA expression of ERLIN2 and Cyclin B1 was detected by qPCR in KCNN1 overexpression and the control cells. (B) The mRNA expression of ERLIN2 and Cyclin B1 was detected by qPCR in MDA-MB-231 cells transfected with siNC or siKCNN1. (C) The protein expression of ERLIN2 and Cyclin B1 in KCNN1 overexpression, KCNN1 knockdown and the control cells was quantified by western blot. (D) MCF7 cells in response to KCNN1 overexpression were treated with MG132 or cycloheximide at different time points. The expression of Cyclin B1 was quantified by western blot. (E) MCF7 cells were transfected with HA-Ub, Flag-Cyclin B1 or GFP-KCNN1 as indicated grouping. After transfection for 36 h, cells were treated with 20 μM MG132 for 6 h. The cells were immunoprecipitated with a Flag antibody and polyubiquitination of Cyclin B1 was analyzed by western blot. (F) MCF7 cells were transfected with HA-Ub (WT), HA-Ub (K63R), Flag-Cyclin B1 or GFP-KCNN1 as indicated grouping. After transfection for 36 h, cells were treated with 20 μM MG132 for 6 h. The cells were immunoprecipitated with a Flag antibody and polyubiquitination of Cyclin B1 was analyzed by western blot. (G) MCF7 cells with KCNN1 overexpression were transfected with siNC or siERLIN2. The protein expression of KCNN1, ERLIN2 and Cyclin B1 was measured by western blot. (H) MDA-MB-231 cells were transfected with siNC, siKCNN1, vector or Flag-ERLIN2. The protein expression of KCNN1, ERLIN2 and Cyclin B1 was measured by western blot. (I) HA-Ub, GFP-KCNN1, Flag-Cyclin B1 or siERLIN2 were transfected into MCF7 cells for 36 h. The cells were treated with 20 μM MG132 for 6 h. The polyubiquitination of Cyclin B1 was detected in the immunoprecipitates by HA antibody. ns, No significant; WT, wild type.
ERLIN2 was the functional downstream target of KCNN1
As confirmed above, ERLIN2 is critical for KCNN1-mediated K63-dependent ubiquitination of Cyclin B1. Therefore, we speculate that ERLIN2 might be the key downstream functional target of KCNN1-mediated proliferation and metastasis of breast cancer cells. We used siRNA to silence ERLIN2 in MCF7 cells with KCNN1 overexpression, while MDA-MB-231 cells with KCNN1 knockdown were co-transfected with ERLIN2 expressing plasmid (Figure 5G and H). CCK8 assay indicated that knockdown of ERLIN2 could inhibit the enhanced proliferation ability of MCF7 caused by KCNN1 overexpression (Figure 6A), while the inhibitory effect of KCNN1 silencing on MDA-MB-231 was significantly increased after overexpression of ERLIN2 (Figure 6B). Clone formation experiments further confirmed that knockdown of ERLIN2 significantly inhibited the number of monoclonal cell formation caused by overexpression of KCNN1, while overexpression of ERLIN2 improved the clone formation ability suppressed by KCNN1 knockdown (Figure 6C). ERLIN2 also plays an important role in KCNN1-mediated migration and invasion of breast cancer cells. Overexpression of KCNN1 significantly promoted wound healing, cell migration and cell invasion of MCF7 cells, while further knockdown of ERLIN2 could neutralize the enhancement of KCNN1-mediated cell migration (Figure 6D and E). On the contrary, further overexpression of ERLIN2 on the basis of KCNN1 knockdown resulted in the increased wound healing, migration and invasion abilities of MDA-MB-231 cells compared with KCNN1 knockdown alone (Figure 6D and E). These results suggest that ERLIN2 is a downstream functional target to realize the oncogenic effects of KCNN1.
Figure 6.
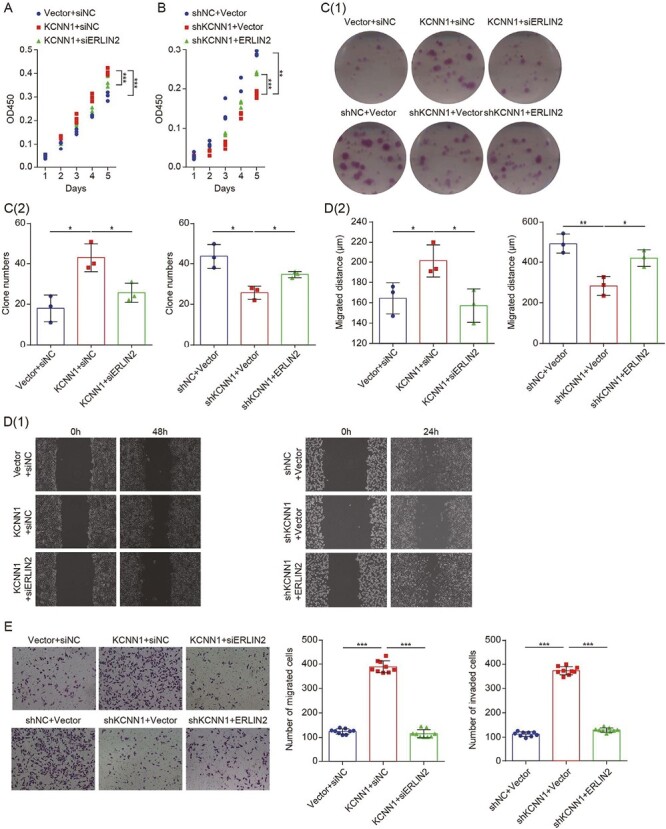
The effect of ERLIN2 in KCNN1 mediated breast cancer cell proliferation, migration and invasion. (A) CCK8 assay measuring the effect of ERLIN2 silencing on the proliferation of MCF7 cells with KCNN1 overexpression. (B) MDA-MB-231 cells were transfected with siNC, siKCNN1, vector or Flag-ERLIN2. The proliferation activity was detected by CCK8 assay. (C[1 and 2]) The colony formation assay showed the effect of ERLIN2 overexpression or knockdown on the cell survival of MCF7 cells with KCNN1 overexpression and MDA-MB-231 cells with KCNN1 knockdown. (D[1 and 2]) The wound healing assay evaluated the migration of KCNN1 overexpressing cells and KCNN1 knockdown cells transfected with siERLIN2 and Flag-ERLIN2 respectively. (E) The transwell migration (up) and invasion (down) assay evaluated the effect of ERLIN2 silencing or ERLIN2 overexpression in MCF7 cells with KCNN1 overexpression and MDA-MB-231 cells with KCNN1 knockdown. *P < 0.05, **P < 0.01 and ***P < 0.001 by One-way ANOVA.
The expression and prognostic value of ERLIN2 and Cyclin B1 in paired breast cancer samples
The above studies have preliminarily revealed the mutual regulatory relationship among KCNN1, ERLIN2 and Cyclin B1. We then evaluated the correlation of KCNN1, ERLIN2 and Cyclin B1 expression in breast cancer clinical samples.
Firstly, the mRNA levels of Cyclin B1 were significantly higher in breast cancer tissues compared with normal tissues as revealed by RNA sequencing data from TCGA database, but the mRNA levels of ERLIN2 was not higher than that in normal tissues (Figure 7A and B). IHC staining using tissue microarray containing 30 breast cancer samples and 30 paired paracancer samples revealed that the protein expressions KCNN1, ERLIN2 and Cyclin B1 were all up-regulated in breast cancer samples (Figure 7C). We performed the correlation analysis between KCNN1 versus ERLIN2, KCNN1 versus Cyclin B1 and ERLIN2 versus Cyclin B1 using H-score representing the relative protein expression levels. As our study elucidate the signaling pathway of KCNN1 was both positively correlated with ERLIN2 and Cyclin B1, and there was also a significant correlation between ERLIN2 and Cyclin B1 (Figure 7D–F). Kaplan–Meier analysis using data from TCGA showed that the expression of ERLIN2 was associated with the overall prognosis of breast cancer patients and the higher expression of Cyclin B1 indicated the shorter overall survival time of breast cancer patients (Figure 7G and H). In conclusion, the correlation and prognostic value of KCNN1/ERLIN2/Cyclin B1 expression in breast cancer tissues further confirmed the important role of the KCNN1/ERLIN2/Cyclin B1 axis in the occurrence and development of breast cancer.
Figure 7.
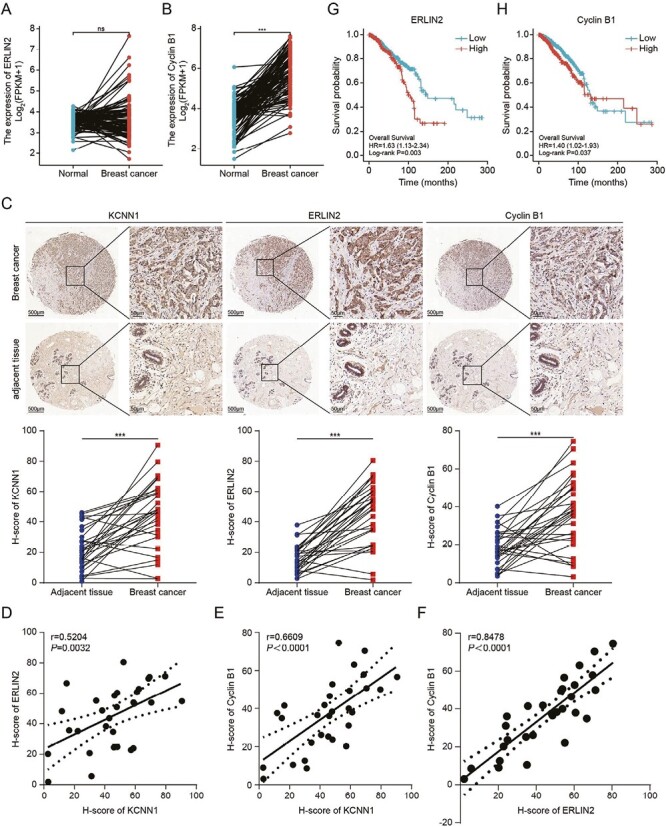
Correlation of KCNN1, ERLIN2 and Cyclin B1 in breast cancer tissues. (A) The mRNA level of ERLIN2 in 1109 breast cancer samples and 113 normal samples. The original gene expression data comes from TCGA database. (B) The mRNA level of Cyclin B1 in 1109 breast cancer samples and 113 normal samples. The original gene expression data comes from TCGA database. (C) Representative IHC pictures showing the expression and locolization of KCNN1, ERLIN2 and Cyclin B1 in 30 breast cancer tissues and 30 paired adjacent tissues. The expressions of KCNN1, ERLIN2 and Cyclin B1 in each samples were represented by H-score. (D–F) The expression correlation of KCNN1 and ERLIN2 (D), KCNN1 and Cyclin B1 (E), as well as ERLIN2 and Cyclin B1 (F). (G and H) Kaplan–Meier plot depicting the overall survival of breast cancer patients with high or low expression of ERLIN2 (G) and Cyclin B1 (H) was analyzed using KM-plotter.
Discussion
KCNN1 are widely distributed in various types of tissues or cells, such as brain, islet cells, cardiomyocytes, endothelial cells, etc. The activity of KCNN1 family proteins could be regulated by intracellular free Ca2+ concentration and have unique characteristics, such as K+ selectivity, Ca2+ hypersensitivity and voltage independence. Abnormal expression of KCNN1 is commonly observed in Parkinson’s disease, stroke, schizophrenia and cancers, and is a promising therapeutic target for neurodegenerative diseases (48,49).
Recent studies have shown that the concentration of K+ and Ca2+ in tumor microenvironment and intracellular K+ and Ca2+ homeostasis are crucial for enhancing the sensitivity of tumor immunotherapy and regulating tumor cell apoptosis (50,51). However, breast cancer was considered as ‘cold tumor’ because the immunogenicity of breast cancer is weak, with poor immunotherapeutic effect. Whether it is related with the overall low endogenous expression level of KCNN1 in breast cancer is still unclear. Since KCNN1 expression was relative higher in the TNBC (Figure 1A and D), we speculated that the sensitivity of TNBC to anti-PD-L1 immunotherapy might be related to higher KCNN1 expression and its regulation of K+ and Ca2+ (52).
As far as we know, this is the first paper to report the biological role and molecular mechanism of KCNN1 in tumors. At present, most of the studies on the KCNN family proteins in tumors have focused on KCNN2 and KCNN3. KCNN2 is an important oncogene in prostate cancer. Androgen receptor (AR) and Myc are the key downstream signaling molecules of KCNN2 (53). Protein kinase A could phosphorylate KCNN2 at Ser568/Ser570 and affects KCNN2 expression (54). KCNN3 was highly expressed in breast cancer tissues, but not in normal breast tissues. KCNN3 overexpression can promote the proliferation and migration of breast cancer in vivo and in vitro (55). As our study fills in the biological role of KCNN1, we could preliminarly envision the oncogenic role of KCNN family proteins in the occurrence and development of malignant tumors. As KCNN1 is a membrane protein that can be easily recognized and targeted by targeted drugs. Designing targeted molecular inhibitors or preparing specific antibodies against KCNN1, KCNN2 or KCNN3 may be promising strategies for cancer therapy.
In this study, we also discovered that KCNN1 interacted with ERLIN2, but not Cyclin B1. We speculated that KCNN1 might enhance the interaction between ERLIN2 and Cyclin B1 and promoted the ERLIN2-meidaated K63 dependent ubiquitination of Cyclin B1. These findings also suggest that KCNN1 may be a major upstream driver of ERlin2-mediated biological function. We speculate the molecular mechanism may be related to the effect of KCNN1 on lipid rafts, or KCNN1 may recruit specific protein kinases to phosphorylate ERLIN2 functionally, which can affect the occurrence and development of breast cancer.
Based on the important role of KCNN1/ERLIN2/Cyclin B1 in breast cancer cell proliferation and metastasis, targeting this signaling pathway may be a valuable therapeutic strategy. In addition to the KCNN1, targeting ERLIN2 may also be a promising strategy. In adenosquamous cancer of the pancreas (ASCP), ERLIN2 fused to the extracellular domains and the kinase domains of FGFR1, organoids developed from the FGFR1-ERLIN2 fusion-positive ASCP patient derived tumor xenograft (PDX) model were sensitive to the pan FGFR inhibitor infigratinib (56). Moreover, treatment with infigratinib in cholangiocarcinoma cells inhibited the expression of Cyclin B1 and interrupted cell growth, migration and invasion (57). Therefore, in future research plans, we intend to evaluate the therapeutic effects of infigratinib on a variety of breast cancer cells in vivo and in vitro.
In summary, our data provide the basis for a better understanding of the molecular mechanism centered by KCNN1, the biological role of which has not been discovered in cancers previously. We also improved the molecular interaction network between ERLIN2 and Cyclin B1 and highlighted the understanding of the Cyclin B1, the classic cell cycle regulatory protein, in the regulation of metastasation of breast cancer.
Supplementary Material
Glossary
Abbreviations:
- AR
Androgen receptor
- ASCP
adenosquamous cancer of the pancreas
- co-IP
co-immunoprecipitation
- DEGs
differentially expressed genes
- EMT
epithelial-mesenchymal transition
- ERLIN2
endoplasmic reticulum lipid raft-associated protein 2
- GO
Gene Ontology
- IHC
immumohistochemical
- KCNN1
potassium calcium-activated channel subfamily N1
- KEGG
Kyoto Encyclopedia of Genes and Genomes
- miRNAs
MicroRNAs
- RT-qPCR
real-time fluorescence quantitative PCR
- TNBC
triple negative breast cancer
Contributor Information
Bin Xiao, Department of Laboratory Medicine, The Sixth Affiliated Hospital of Guangzhou Medical University, Qingyuan People’s Hospital, Qingyuan, Guangdong 511518, China.
Qin Xiang, Department of Laboratory Medicine, The Sixth Affiliated Hospital of Guangzhou Medical University, Qingyuan People’s Hospital, Qingyuan, Guangdong 511518, China.
Zihua Deng, Department of General Surgery Section 5, The Sixth Affiliated Hospital of Guangzhou Medical University, Qingyuan People’s Hospital, Qingyuan 511518, China.
Daxiang Chen, Department of Laboratory Medicine, The Sixth Affiliated Hospital of Guangzhou Medical University, Qingyuan People’s Hospital, Qingyuan, Guangdong 511518, China.
Shunhong Wu, Department of Laboratory Medicine, The Sixth Affiliated Hospital of Guangzhou Medical University, Qingyuan People’s Hospital, Qingyuan, Guangdong 511518, China.
Yanxia Zhang, Department of Laboratory Medicine, The Sixth Affiliated Hospital of Guangzhou Medical University, Qingyuan People’s Hospital, Qingyuan, Guangdong 511518, China.
Yaru Liang, Department of Laboratory Medicine, The Sixth Affiliated Hospital of Guangzhou Medical University, Qingyuan People’s Hospital, Qingyuan, Guangdong 511518, China.
Shi Wei, Department of Histology and Embryology, School of Basic Medical Sciences, Guangzhou Medical University, Guangzhou, Guangdong, China.
Guoqing Luo, Department of General Surgery Section 5, The Sixth Affiliated Hospital of Guangzhou Medical University, Qingyuan People’s Hospital, Qingyuan 511518, China.
Linhai Li, Department of Laboratory Medicine, The Sixth Affiliated Hospital of Guangzhou Medical University, Qingyuan People’s Hospital, Qingyuan, Guangdong 511518, China.
Funding
This work was supported by Science and Technology Program of Qingyuan (No. 2022KJJH027 to Linhai Li and No. 2022KJJH030 to Yaru Liang), Student innovation ability improvement program of Guangzhou Medical University to Bin Xiao, the National Natural Science Foundation of China (No. 81802634 to Bin Xiao) and Guangdong Basic and Applied Basic Research Foundation (No. 2021A1515010168 and No. 2023A1515030061 to Bin Xiao), and Guangdong Medical Science and Technology Research Foundation (No. B2023477 to Qin Xiang and No. A2023251 to Shunhong Wu).
Conflict of Interest Statement
None of the authors has any conflict of interest.
Data Availability
The datasets used and/or analyzed during this study are available from the corresponding author upon reasonable request.
References
- 1. Miller, K.D., et al. (2019) Cancer treatment and survivorship statistics, 2019. CA. Cancer J. Clin., 69, 363–385. [DOI] [PubMed] [Google Scholar]
- 2. Sung, H., et al. (2021) Global Cancer Statistics 2020: GLOBOCAN estimates of incidence and mortality worldwide for 36 cancers in 185 countries. CA. Cancer J. Clin., 71, 209–249. [DOI] [PubMed] [Google Scholar]
- 3. Hosonaga, M., et al. (2020) Molecular and cellular mechanisms underlying brain metastasis of breast cancer. Cancer Metastasis Rev., 39, 711–720. [DOI] [PMC free article] [PubMed] [Google Scholar]
- 4. Xiu, B., et al. (2019) LINC02273 drives breast cancer metastasis by epigenetically increasing AGR2 transcription. Mol. Cancer, 18, 187. [DOI] [PMC free article] [PubMed] [Google Scholar]
- 5. Shenton, F., et al. (2014) A study of the expression of small conductance calcium-activated potassium channels (SK1-3) in sensory endings of muscle spindles and lanceolate endings of hair follicles in the rat. PLoS One, 9, e107073. [DOI] [PMC free article] [PubMed] [Google Scholar]
- 6. Rahm, A.K., et al. (2021) Differential regulation of KCa 21 (KCNN1) K(+) channel expression by histone deacetylases in atrial fibrillation with concomitant heart failure. Physiol. Rep., 9, e14835. [DOI] [PMC free article] [PubMed] [Google Scholar]
- 7. Browman, D.T., et al. (2006) Erlin-1 and erlin-2 are novel members of the prohibitin family of proteins that define lipid-raft-like domains of the ER. J. Cell Sci., 119, 3149–3160. [DOI] [PubMed] [Google Scholar]
- 8. Garcia, M.J., et al. (2005) A 1 Mb minimal amplicon at 8p11-12 in breast cancer identifies new candidate oncogenes. Oncogene, 24, 5235–5245. [DOI] [PubMed] [Google Scholar]
- 9. Gelsi-Boyer, V., et al. (2005) Comprehensive profiling of 8p11-12 amplification in breast cancer. Mol. Cancer Res., 3, 655–667. [DOI] [PubMed] [Google Scholar]
- 10. Yang, Z.Q., et al. (2010) Transforming properties of 8p11-12 amplified genes in human breast cancer. Cancer Res., 70, 8487–8497. [DOI] [PMC free article] [PubMed] [Google Scholar]
- 11. Yildirim, Y., et al. (2011) A frameshift mutation of ERLIN2 in recessive intellectual disability, motor dysfunction and multiple joint contractures. Hum. Mol. Genet., 20, 1886–1892. [DOI] [PubMed] [Google Scholar]
- 12. Zhang, Y.F., et al. (2016) miR-410-3p suppresses breast cancer progression by targeting Snail. Oncol. Rep., 36, 480–486. [DOI] [PubMed] [Google Scholar]
- 13. Xu, J., et al. (2019) miR-876-5p suppresses breast cancer progression through targeting TFAP2A. Exp. Ther. Med., 18, 1458–1464. [DOI] [PMC free article] [PubMed] [Google Scholar]
- 14. Wu, H., et al. (2018) MiR-410 acts as a tumor suppressor in estrogen receptor-positive breast cancer cells by directly targeting ERLIN2 via the ERS pathway. Cell. Physiol. Biochem., 48, 461–474. [DOI] [PubMed] [Google Scholar]
- 15. Du, F., et al. (2020) SNHG17 drives malignant behaviors in astrocytoma by targeting miR-876-5p/ERLIN2 axis. BMC Cancer, 20, 839. [DOI] [PMC free article] [PubMed] [Google Scholar]
- 16. Wang, G., et al. (2012) ERLIN2 promotes breast cancer cell survival by modulating endoplasmic reticulum stress pathways. BMC Cancer, 12, 225. [DOI] [PMC free article] [PubMed] [Google Scholar]
- 17. Zhang, X., et al. (2015) A novel ER-microtubule-binding protein, ERLIN2, stabilizes Cyclin B1 and regulates cell cycle progression. Cell Discov., 1, 15024. [DOI] [PMC free article] [PubMed] [Google Scholar]
- 18. Gillett, C., et al. (1996) Cyclin D1 and prognosis in human breast cancer. Int. J. Cancer, 69, 92–99. [DOI] [PubMed] [Google Scholar]
- 19. Michalides, R., et al. (1996) A clinicopathological study on overexpression of cyclin D1 and of p53 in a series of 248 patients with operable breast cancer. Br. J. Cancer, 73, 728–734. [DOI] [PMC free article] [PubMed] [Google Scholar]
- 20. McIntosh, G.G., et al. (1995) Determination of the prognostic value of cyclin D1 overexpression in breast cancer. Oncogene, 11, 885–891. [PubMed] [Google Scholar]
- 21. Seshadri, R., et al. (1996) Cyclin DI amplification is not associated with reduced overall survival in primary breast cancer but may predict early relapse in patients with features of good prognosis. Clin. Cancer Res., 2, 1177–1184. [PubMed] [Google Scholar]
- 22. Han, S., et al. (2003) Cyclin D1 expression and patient outcome after tamoxifen therapy in estrogen receptor positive metastatic breast cancer. Oncol. Rep., 10, 141–144. [PubMed] [Google Scholar]
- 23. Hwang, T.S., et al. (2003) Prognostic value of combined analysis of cyclin D1 and estrogen receptor status in breast cancer patients. Pathol. Int., 53, 74–80. [DOI] [PubMed] [Google Scholar]
- 24. Bieche, I., et al. (2002) Prognostic value of CCND1 gene status in sporadic breast tumours, as determined by real-time quantitative PCR assays. Br. J. Cancer, 86, 580–586. [DOI] [PMC free article] [PubMed] [Google Scholar]
- 25. Keyomarsi, K., et al. (2002) Cyclin E and survival in patients with breast cancer. N. Engl. J. Med., 347, 1566–1575. [DOI] [PubMed] [Google Scholar]
- 26. Span, P.N., et al. (2003) Cyclin-E is a strong predictor of endocrine therapy failure in human breast cancer. Oncogene, 22, 4898–4904. [DOI] [PubMed] [Google Scholar]
- 27. Porter, P.L., et al. (1997) Expression of cell-cycle regulators p27Kip1 and cyclin E, alone and in combination, correlate with survival in young breast cancer patients. Nat. Med., 3, 222–225. [DOI] [PubMed] [Google Scholar]
- 28. Suzuki, T., et al. (2007) Nuclear cyclin B1 in human breast carcinoma as a potent prognostic factor. Cancer Sci., 98, 644–651. [DOI] [PMC free article] [PubMed] [Google Scholar]
- 29. Yu, J., et al. (2021) Structural basis of human separase regulation by securin and CDK1-cyclin B1. Nature, 596, 138–142. [DOI] [PMC free article] [PubMed] [Google Scholar]
- 30. Xie, B., et al. (2019) Cyclin B1/CDK1-regulated mitochondrial bioenergetics in cell cycle progression and tumor resistance. Cancer Lett., 443, 56–66. [DOI] [PMC free article] [PubMed] [Google Scholar]
- 31. Khumukcham, S.S., et al. (2019) Hematopoietic PBX-interacting protein is a substrate and an inhibitor of the APC/C-Cdc20 complex and regulates mitosis by stabilizing cyclin B1. J. Biol. Chem., 294, 10236–10252. [DOI] [PMC free article] [PubMed] [Google Scholar]
- 32. Xia, P., et al. (2021) MYC-targeted WDR4 promotes proliferation, metastasis, and sorafenib resistance by inducing CCNB1 translation in hepatocellular carcinoma. Cell Death Dis., 12, 691. [DOI] [PMC free article] [PubMed] [Google Scholar]
- 33. Kao, H., et al. (2001) Identification of cyclin B1 as a shared human epithelial tumor-associated antigen recognized by T cells. J. Exp. Med., 194, 1313–1323. [DOI] [PMC free article] [PubMed] [Google Scholar]
- 34. Hunter, T., et al. (1991) Cyclins and cancer. Cell, 66, 1071–1074. [DOI] [PubMed] [Google Scholar]
- 35. Egloff, A.M., et al. (2006) Cyclin B1 and other cyclins as tumor antigens in immunosurveillance and immunotherapy of cancer. Cancer Res., 66, 6–9. [DOI] [PubMed] [Google Scholar]
- 36. Nurse, P. (1994) Ordering S phase and M phase in the cell cycle. Cell, 79, 547–550. [DOI] [PubMed] [Google Scholar]
- 37. Sherr, C.J., et al. (1995) Inhibitors of mammalian G1 cyclin-dependent kinases. Genes Dev., 9, 1149–1163. [DOI] [PubMed] [Google Scholar]
- 38. Hagting, A., et al. (1999) Translocation of cyclin B1 to the nucleus at prophase requires a phosphorylation-dependent nuclear import signal. Curr. Biol., 9, 680–689. [DOI] [PubMed] [Google Scholar]
- 39. Mullers, E., et al. (2014) Nuclear translocation of Cyclin B1 marks the restriction point for terminal cell cycle exit in G2 phase. Cell Cycle, 13, 2733–2743. [DOI] [PMC free article] [PubMed] [Google Scholar]
- 40. Aaltonen, K., et al. (2009) High cyclin B1 expression is associated with poor survival in breast cancer. Br. J. Cancer, 100, 1055–1060. [DOI] [PMC free article] [PubMed] [Google Scholar]
- 41. Vella, L.A., et al. (2009) Healthy individuals have T-cell and antibody responses to the tumor antigen cyclin B1 that when elicited in mice protect from cancer. Proc. Natl. Acad. Sci. USA., 106, 14010–14015. [DOI] [PMC free article] [PubMed] [Google Scholar]
- 42. Gwon, D.H., et al. (2020) BMAL1 suppresses proliferation, migration, and invasion of U87MG Cells by downregulating Cyclin B1, Phospho-AKT, and Metalloproteinase-9. Int. J. Mol. Sci., 21, 2352–2357. [DOI] [PMC free article] [PubMed] [Google Scholar]
- 43. Zhang, Q., et al. (2018) miR-137 inhibits proliferation and metastasis of hypertrophic scar fibroblasts via targeting pleiotrophin. Cell. Physiol. Biochem., 49, 985–995. [DOI] [PubMed] [Google Scholar]
- 44. You, K., et al. (2017) SCARA5 plays a critical role in the progression and metastasis of breast cancer by inactivating the ERK1/2, STAT3, and AKT signaling pathways. Mol. Cell. Biochem., 435, 47–58. [DOI] [PubMed] [Google Scholar]
- 45. Tao, S., et al. (2016) miR-3646 promotes cell proliferation, migration, and invasion via regulating G2/M transition in human breast cancer cells. Am. J. Transl. Res., 8, 1659–1677. [PMC free article] [PubMed] [Google Scholar]
- 46. Song, Y., et al. (2008) Overexpression of cyclin B1 in human esophageal squamous cell carcinoma cells induces tumor cell invasive growth and metastasis. Carcinogenesis, 29, 307–315. [DOI] [PubMed] [Google Scholar]
- 47. Kedinger, V., et al. (2013) Sticky siRNAs targeting survivin and cyclin B1 exert an antitumoral effect on melanoma subcutaneous xenografts and lung metastases. BMC Cancer, 13, 338. [DOI] [PMC free article] [PubMed] [Google Scholar]
- 48. Dolga, A.M., et al. (2014) Subcellular expression and neuroprotective effects of SK channels in human dopaminergic neurons. Cell Death Dis., 5, e999. [DOI] [PMC free article] [PubMed] [Google Scholar]
- 49. Shmukler, B.E., et al. (2001) Structure and complex transcription pattern of the mouse SK1 K(Ca) channel gene, KCNN1. Biochim. Biophys. Acta, 1518, 36–46. [DOI] [PubMed] [Google Scholar]
- 50. Vodnala, S.K., et al. (2019) T cell stemness and dysfunction in tumors are triggered by a common mechanism. Science, 363(6434), eaau0135. [DOI] [PMC free article] [PubMed] [Google Scholar]
- 51. Tan, X., et al. (2021) Transformable nanosensitizer with tumor microenvironment-activated sonodynamic process and calcium release for enhanced cancer immunotherapy. Angew. Chem. Int. Ed. Engl., 60, 14051–14059. [DOI] [PubMed] [Google Scholar]
- 52. Zhang, Y., et al. (2021) Single-cell analyses reveal key immune cell subsets associated with response to PD-L1 blockade in triple-negative breast cancer. Cancer Cell, 39, 1578–1593.e8. [DOI] [PubMed] [Google Scholar]
- 53. Schrecengost, R.S., et al. (2015) Downregulation of critical oncogenes by the selective SK2 inhibitor ABC294640 hinders prostate cancer progression. Mol. Cancer Res., 13, 1591–1601. [DOI] [PMC free article] [PubMed] [Google Scholar]
- 54. Ren, Y., et al. (2006) Regulation of surface localization of the small conductance Ca2+-activated potassium channel, Sk2, through direct phosphorylation by cAMP-dependent protein kinase. J. Biol. Chem., 281, 11769–11779. [DOI] [PubMed] [Google Scholar]
- 55. Chantome, A., et al. (2013) Pivotal role of the lipid Raft SK3-Orai1 complex in human cancer cell migration and bone metastases. Cancer Res., 73, 4852–4861. [DOI] [PubMed] [Google Scholar]
- 56. Lenkiewicz, E., et al. (2020) Genomic and epigenomic landscaping defines new therapeutic targets for adenosquamous carcinoma of the pancreas. Cancer Res., 80, 4324–4334. [DOI] [PMC free article] [PubMed] [Google Scholar]
- 57. Jaidee, R., et al. (2022) Inhibition of FGFR2 enhances chemosensitivity to gemcitabine in cholangiocarcinoma through the AKT/mTOR and EMT signaling pathways. Life Sci., 296, 120427. [DOI] [PubMed] [Google Scholar]
Associated Data
This section collects any data citations, data availability statements, or supplementary materials included in this article.
Supplementary Materials
Data Availability Statement
The datasets used and/or analyzed during this study are available from the corresponding author upon reasonable request.