

Error in Figure
In the original publication [1] there was a mistake in Figure 1. The Kaplan–Meier survival curve was constructed by assessing the mortality of the animals at 1, 2, 3, 24, and 48 h. However, the plotting software applied a default configuration associated with the kind of graph used by which the x axis scale was changed to represent a regular time interval of 1 h (values: 0, 1, 2, 3, 4, and 5). The original figure is as follows:
|
|
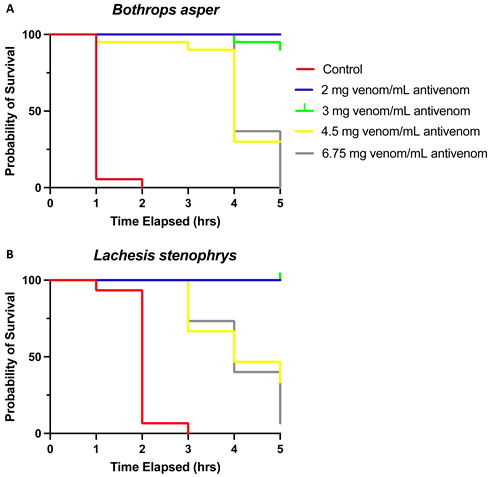
Nevertheless, the correct values are: 0, 1, 2, 3, 24, and 48 h. The corrected Figure 1 is presented below. The authors affirm that the scientific conclusions remain unchanged. The original publication has been updated.
Figure 1.

Kaplan–Meier survival analysis of (A) B. asper and (B) L. stenophrys venoms stratified into five groups (controls and 2, 3, 4.5, and 6.75 mg venom/mL antivenom) shows a significantly better overall survival for groups receiving lower venom/antivenom dosages. Lethality rates were not different between venoms.
Footnotes
Disclaimer/Publisher’s Note: The statements, opinions and data contained in all publications are solely those of the individual author(s) and contributor(s) and not of MDPI and/or the editor(s). MDPI and/or the editor(s) disclaim responsibility for any injury to people or property resulting from any ideas, methods, instructions or products referred to in the content.
Reference
- 1.De Jesus R., Tratner A.E., Madrid A., Rivera A., Navas G.E., Lleonart R., Britton G.B., Fernández P.L. Body Temperature Drop as a Humane Endpoint in Snake Venom-Lethality Neutralization Tests. Toxins. 2023;15:525. doi: 10.3390/toxins15090525. [DOI] [PMC free article] [PubMed] [Google Scholar]