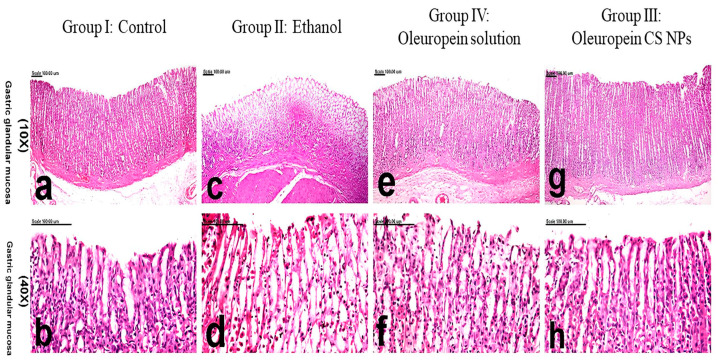
Figure 4.
Histological examination of gastric tissue of different animal groups. Group I: control represented by (a,b), group II: ethanol-induced ulcer pretreated with physiological saline represented by (c,d), group III: ethanol-induced ulcer pretreated with oleuropein chitosan nanoparticles (CS NPs) represented by (g,h) and group IV: ethanol-induced ulcer pretreated with oleuropein solution represented by (e,f).

