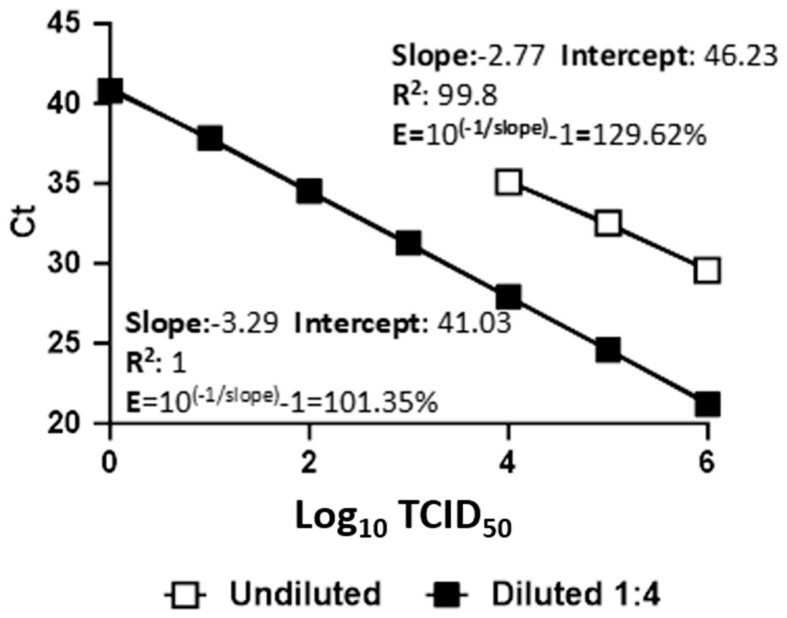
Figure 1.
Comparison of the standard curves, correlation coefficients (R2), and efficiency (E) between undiluted and diluted urine. Viral RNA extracted from 10-fold dilutions in spiked undiluted (white square) and diluted urine (black square) was analyzed. Each plot represents the means of four replicate amplifications of each dilution. The x-axis shows the virus titration expressed in TCID50. The y-axis shows the Ct values.

