Abstract
Bronchoalveolar lavage fluid (BALF) collection is a valuable respiratory diagnostic procedure in cats. This study evaluated effects of BALF storage on total nucleated cell counts (TNCCs) and differential cell counts (DCC), cell morphology, and cytological diagnosis. Forty-five research cats with neutrophilic, eosinophilic, and mixed inflammation, and healthy controls were enrolled. BALF samples were processed within 1 h (baseline) or stored at 4°C (4C24) or room temperature (RT24) for 24 h, or 4°C (4C48) or room temperature (RT48) for 48 h before processing. Stored BALF at RT48 had decreased TNCC compared to baseline. The RT24 and RT48 samples had greater eosinophil % and the RT24, 4C48, and RT48 samples had decreased neutrophil % compared with baseline. Cellular morphology deteriorated in all stored samples. Storage resulted in a change in cytological diagnosis in up to 57% of stored samples. We conclude that cytological analysis of BALF in cats should be performed promptly for optimal results.
Bronchoalveolar lavage fluid (BALF) collection is an important diagnostic procedure in cats with respiratory disease. Lower respiratory disease in cats can be categorized as infectious (eg, fungal, viral, bacterial, protozoal, parasitic), non-infectious inflammatory, or neoplastic in etiology. 1,2 In all cats with respiratory disease less invasive diagnostics (eg, thoracic radiographs) should be performed prior to BALF collection. Because the clinical and radiographic presentation is often similar with the aforementioned diseases, accurate cytological evaluation of BALF is a useful means of differentiating between disease processes. Additionally, BALF evaluation can also be used to monitor progression of disease or response to therapy, particularly in patients with inflammatory lower airway disease (eg, feline asthma and chronic bronchitis). 3
In human medicine, it is recommended that BALF be processed within 4 h of collection for optimal results. 4 As collection of BALF gains popularity in the veterinary private practice setting, guidelines for the storage of feline BALF prior to cytological analysis are needed. Unfortunately, a time delay is often necessary between collection and processing of BALF by commercial laboratories. There is evidence in other species that storage conditions alter BALF cytological results. 4–6 A study evaluating storage and transport conditions of equine airway lavage fluid found no difference in total nucleated cell count (TNCC) between samples stored at 4°C for up to 72 h. 5 However, storage of this fluid at higher temperatures (18°C and 38°C) resulted in a significant decrease in TNCC. 5 Additionally, bacterial growth increased and cell morphology declined with increasing storage time and temperature. 5
While studies have investigated storage time and temperature in equine and human BALF, the stability of feline BALF over time and at different temperatures has not previously been reported. The purpose of this study was to determine the effects of time and temperature on cellular evaluation of feline BALF collected from research cats with eosinophilic, neutrophilic and mixed airway inflammation, and healthy control cats lacking airway inflammation. Effects of storage time and temperature were assessed by measuring TNCC, differential cell counts (DCC), semi-quantitative cellular morphology score, bacterial score, and cytological diagnosis. We hypothesized that storage of feline BALF would alter total and differential cell counts, cell morphology, bacterial score, and cytological diagnosis regardless of the temperature and duration of storage.
Materials and methods
Animal handling
Adult research cats with eosinophilic, neutrophilic and mixed airway inflammation, and controls lacking clinical and cytological evidence of airway inflammation were included in the study. Animals were cared for according to the principles outlined in the National Institutes of Health Guide for the Care and Use of Laboratory Animals and approved by the University of Missouri Animal Care and Use Committee. Cats were given water and a dry feline maintenance diet ad libitum and were fasted prior to collection of BALF. Experimental induction of inflammatory airway disease and subsequent collection of BALF were performed for various research studies being conducted by our laboratory. 7,8 A portion of the samples were obtained from healthy research cats used as controls for various studies. These cats had no experimental interventions prior to BALF collection nor did they have evidence of respiratory disease on physical examination. Control cats were included in the present study to provide storage information on samples containing a wide range of cell types. Research cats were sensitized and challenged with Bermuda grass allergen to induce an asthmatic phenotype or endotoxin infusion was administered to induce pulmonary inflammation and collection of BALF was performed. 7,8 Depending on the predominant inflammatory cell type(s) (see cytological diagnosis below), samples were placed in the eosinophilic, neutrophilic or mixed inflammation or non-inflammatory groups.
Sample collection
BALF was collected using a blind technique. 9 Briefly, cats were anesthetized (ketamine, 10 mg/kg, IV) and intubated with a 4.0 or 4.5 mm cuffed, cold sterilized endotracheal tube. Then, a sterile open-ended eight-french polypropylene or red rubber catheter was gently advanced through the endotracheal tube until resistance was felt (ie, the catheter was wedged in a lower airway). Fifteen milliliters of sterile phosphate buffered saline (PBS) was instilled into the lobe and gently removed via suction and the sample was immediately placed on ice. BALF samples from each cat were well mixed and divided cleanly (but not sterilely) into five sealed aliquots. Aliquots were not transferred into sterile tubes under a laminar flow hood because of the desire to replicate what would happen in a veterinary private practice. One aliquot was processed within 1 h of collection for the purposes of obtaining baseline values (baseline). The remaining aliquots were stored at 4°C (refrigerator) for 24 h (4C24), 24°C room temperature (RT) for 24 h (RT24), 4°C for 48 h (4C48), and 24°C for 48 h (RT48).
Cytological analysis of BALF
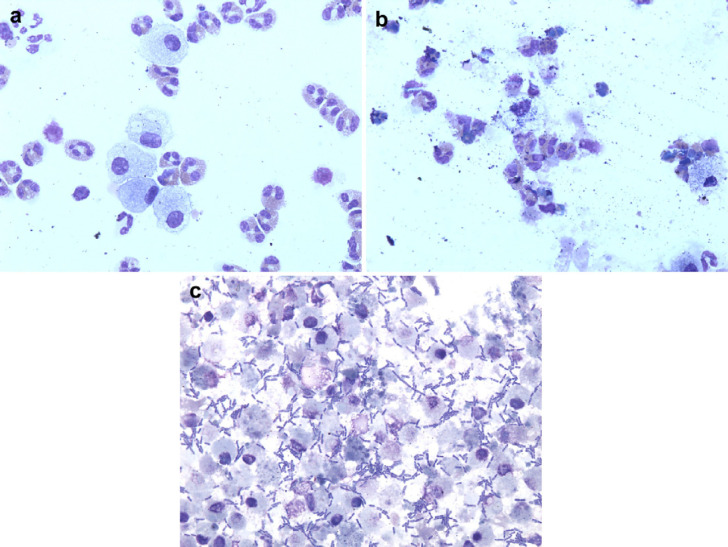
TNCC and DCC of each sample were performed immediately following collection and at each time point and storage temperature. All samples were gently mixed prior to processing. The TNCC was determined in triplicate using a Coulter counter (Z1 particle counter, Coulter Electronics, Hialeah, FL) and the three counts were averaged. BALF cytology was performed by a single investigator trained in cytological evaluation of BALF who was blinded to the origin of the cytological preparation. Two hundred nucleated cell differential counts were performed using Wright's stained cytospin preparations. Macrophages and lymphocytes, but not epithelial cells, were included in the 200 cell count performed on all samples evaluated in the present study as is standard for BALF cytological examination. However, as the focus of the study was on cats with eosinophilic, neutrophilic or mixed (ie, both) inflammation, alterations in the numbers of macrophages and lymphocytes were not specifically reported. All slides were further evaluated for the ease of counting and cell identification and a semi-quantitative morphology score was assigned on a scale of 1–4, with a score of 4 representing the most degraded cells (Table 1a, Fig 1 a and b). 5 A bacterial score was assigned based on the presence or absence of bacteria, with a bacterial score of 4 representing samples that had evidence of abundant bacteria and a bacterial score of 1 representing samples that did not have any bacteria present (Table 1b, Fig 1c). 5
Table 1a.
Semi-quantitative morphology scoring system 5 .
| Morphology score | Defined criteria |
|---|---|
| 1 | Excellent morphology, 90–100% of cells easy to identify |
| 2 | Moderately easy to count, >75% of cells easy to identify |
| 3 | Difficult to count, impossible to accurately identify 50–75% of cells |
| 4 | Unreadable, impossible to accurately identify >75% of cells |
Fig 1.
(a) Photomicrograph of BALF processed within 1 h of collection (baseline) assigned a morphology score 1 and bacterial score 1. More than 90% of the cells are easily identifiable and there is no evidence of bacteria. Wright–Giemsa stain; original magnification ×600. (b). Photomicrograph of BALF stored at RT for 48 h assigned a morphology score 4. There is a large amount of amorphous debris and it is impossible to accurately identify more than 75% of cells. Wright–Giemsa stain; original magnification ×600. (c). Photomicrograph of BALF stored at RT for 48 h assigned a bacterial score of 4. There are abundant extracellular bacteria noted. Wright–Giemsa stain; original magnification ×600.
Table 1b.
Bacterial scoring system 5 .
| Bacterial score | Defined criteria |
|---|---|
| 1 | No bacteria seen |
| 2 | Occasional bacteria detected when many fields of view are examined |
| 3 | Moderate numbers of bacteria present, noticed within first few fields of view |
| 4 | Abundant bacteria present, many bacteria in numerous fields of view |
Cytological diagnosis
All samples were assigned a diagnostic category based on the results of BALF cytology at baseline. Diagnostic categories were defined as neutrophilic inflammation (≥7% neutrophils), eosinophilic inflammation (≥17% eosinophils), mixed inflammation (≥7% neutrophils and ≥17% eosinophils), and non-inflammatory (<7% neutrophils, <17% eosinophils). 3,9 Following storage, individual samples were assigned a cytological diagnosis based on the predefined criteria.
Statistical analysis
A signed rank test was used to evaluate if the outcomes from each of the storage conditions were significantly different from baseline. As numerous variables were tested, false discovery rate (FDR) at 0.05 was used to control for type I error. 10 A McNemar's test was used to determine significant differences in categorical diagnosis between baseline and the storage conditions. Bacterial score and change in diagnosis data are presented using descriptive statistics. For samples that were so degraded that no intact cells were identified, the percentage reported for each cell type in the DCC was recorded as 0. A P<0.05 was considered statistically significant.
Results
Animals
Forty-five adult research cats with neutrophilic, (n=21) eosinophilic (n=8), and mixed (n=5) inflammation, and non-inflammatory controls (n=11) were included in the study.
BALF TNCC
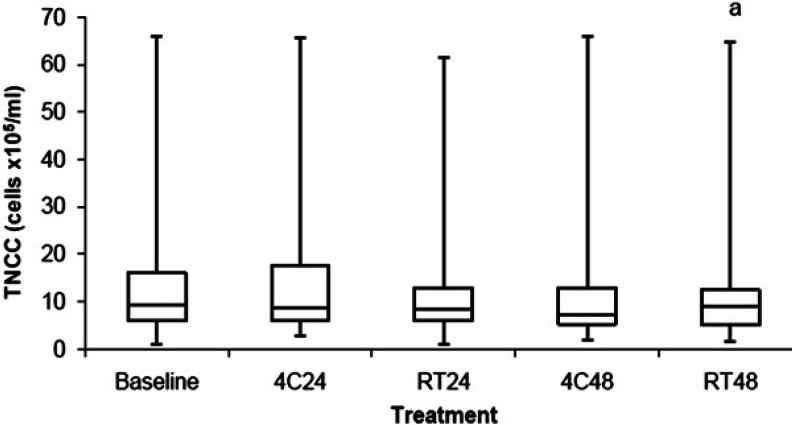
The BALF TNCC data are shown in Fig 2 and Table 2. BALF stored at RT48 had a decreased TNCC (P=0.04) when compared to baseline. There was no difference in TNCC in BALF stored at 4C24, RT24, and 4C48 when compared to baseline.
Fig 2.
Comparison of TNCC between BALF samples stored at 4°C for 24 h (4C24), RT for 24 h (RT24), 4°C for 48 h (4C48), and RT for 48 h (RT48). The upper and lower edges of the box represent the 75th and 25th percentiles respectively, whereas the line within the box is the median value. Whiskers represent the largest and smallest values. aP=0.04 compared to baseline.
Table 2.
The median (Q1, Q3) TNCC, eosinophil percent (Eos %), neutrophil percent (Neut %) and morphology score for BALF samples at baseline and stored at 4°C for 24 h (4C24), RT for 24 h (RT24), 4°C for 48 h (4C48), and RT for 48 h (RT48). This table is a numerical representation of the results presented in Figs 2–5.
| TNCC (×105/ml) | Eos % | Neut % | Morphology score | |
|---|---|---|---|---|
| Baseline | 9.5 (5.9, 16) | 8.5 (3.5, 33) | 7.5 (4, 16) | 1 (1, 2) |
| 4C24 | 8.8 (5.9, 17.5) | 14.3 (5.6, 35) | 6 (3.5, 14) | 2 (1.3, 2.8) |
| RT24 | 8.4 (5.9, 13) | 15.8 (6.6, 40.9) | 5.5 (3.4, 10.6) | 3 (2, 3) |
| 4C48 | 7.2 (5.3, 13) | 16 (4.5, 33) | 4.5 (1, 11.5) | 2 (2, 3) |
| RT48 | 8.9 (5.2, 12.5) | 17.5 (5.4, 36.8) | 4 (2.4, 9.3) | 3 (2.8, 3.3) |
BALF DCC
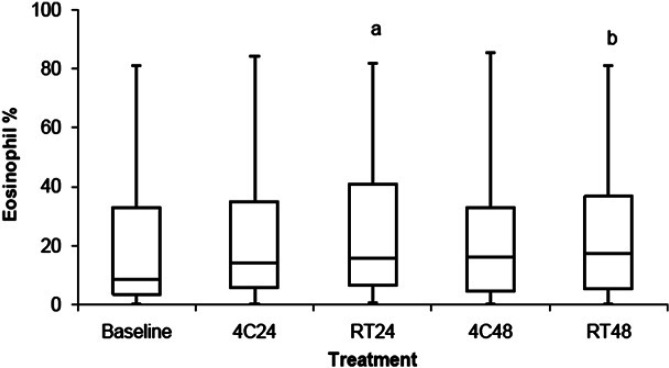
The percentage of BALF eosinophils is shown in Fig 3 and Table 2. BALF stored at RT24 (P<0.001) and RT48 (P<0.006) had a greater percentage of eosinophils in BALF when compared with baseline. There was no difference in the percentage of eosinophils in BALF stored at 4C24 and 4C48 when compared to baseline. For samples that had ≥17% eosinophils at baseline (ie, cats with eosinophilic or mixed inflammation), 8%, 38%, 23%, and 23% had a >25% increase in the percentage of BALF eosinophils when stored at 4C24, RT24, 4C48, and RT48, respectively.
Fig 3.
Comparison of the percentage of eosinophils between BALF samples stored at 4°C for 24 h (4C24), RT for 24 h (RT24), 4°C for 48 h (4C48), and RT for 48 h (RT48). The upper and lower edges of the box represent the 75th and 25th percentiles, respectively, whereas the line within the box is the median value. Whiskers represent the largest and smallest values. aP<0.001; bP<0.006 compared to baseline.
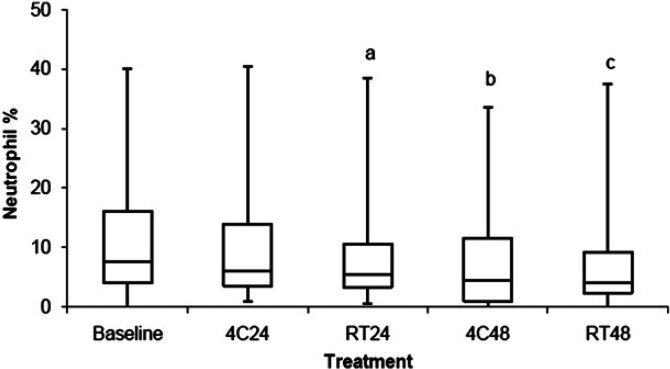
The percentage of BALF neutrophils is shown in Fig 4 and Table 2. BALF stored at RT24 (P=0.03), 4C48 (P<0.001), and RT48 (P<0.006) had a decreased percentage of neutrophils in BALF when compared with baseline. There was no difference in the percentage of neutrophils in BALF stored at 4C24 when compared to baseline. For samples that had ≥7% neutrophils at baseline (ie, cats with neutrophilic or mixed inflammation), 52%, 56%, 65%, and 77% had a >25% decrease in the percentage of BALF neutrophils when stored at 4C24, RT24, 4C48, and RT48, respectively.
Fig 4.
Comparison of the percentage of neutrophils between BALF samples stored at 4°C for 24 h (4C24), RT for 24 h (RT24), 4°C for 48 h (4C48), and RT for 48 h (RT48). The upper and lower edges of the box represent the 75th and 25th percentiles, respectively, whereas the line within the box is the median value. Whiskers represent the largest and smallest values. aP=0.03; bP<0.001; cP<0.006 compared to baseline.
Cellular morphology score
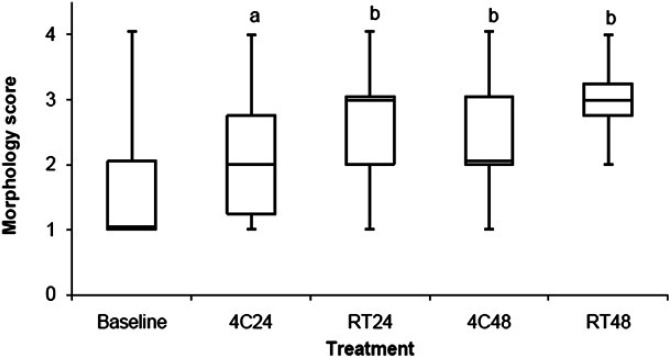
The cellular morphology score is shown in Fig 5 and Table 2. BALF stored at 4C24 (P=0.013), RT24 (P<0.001), 4C48 (P<0.001), and RT48 (P<0.001) had a significant increase in morphology score (ie, had degeneration of cells) compared to baseline. Storage resulted in a morphology score of 3/4 in 12%, 32%, 20%, and 48% and a morphology score of 4/4 in 14%, 20%, 16%, and 27% of samples stored at 4C24, RT24, 4C48, and RT48, respectively. For the samples in which storage resulted in a change in cytological diagnosis compared to baseline, 31%, 72%, 38%, and 64% had a morphology score of 3/4 or 4/4 following storage at 4C24, RT24, 4C48, and RT48, respectively. There were two samples for which the morphology was so degraded that only cellular debris was noted (ie, no identifiable intact cells). Both of these samples had undergone storage for 48 h (one at 4C and one at RT).
Fig 5.
Comparison of morphology score between BALF samples stored at 4°C for 24 h (4C24), RT for 24 h (RT24), 4°C for 48 h (4C48), and RT for 48 h (RT48). The upper and lower edges of the box represent the 75th and 25th percentiles, respectively, whereas the line within the box is the median value. Whiskers represent the largest and smallest values. aP=0.013; bP<0.001 compared to baseline.
Bacterial score
No bacteria were noted in the baseline BALF samples. Ten BALF samples had evidence of bacteria following storage at 4C48 (n=2) and RT48 (n=8). Of the samples stored at RT48 that had evidence of bacteria (predominantly rods with occasional cocci seen), 6/8 had a bacterial score of 4/4 and 2/8 had a bacterial score of 3/4. No bacteria were seen in the BALF samples stored at 4C24 and RT24.
Change in cytological diagnosis compared to baseline
The change in cytological diagnosis compared to baseline for each storage condition is shown in Table 3. Storage resulted in a change in the assigned diagnostic category (ie, neutrophilic, eosinophilic, mixed or normal/non-inflammatory) from baseline in 31%, 41%, 47%, and 57% of samples for 4C24, RT24, 4C48, RT48, respectively. The most frequent diagnostic change was from mixed inflammation to eosinophilic inflammation with 80% of samples with mixed inflammation being inappropriately categorized as eosinophilic inflammation after storage at RT24, 4C48, and RT48. Of the BALF samples that had evidence of any type of inflammation (ie, samples with ≥17% eosinophils and/or ≥7% neutrophils), 9%, 12%, 15%, and 18% would have been inappropriately categorized as non-inflammatory (ie, samples now had <17% eosinophils and/or <7% neutrophils) after storage at 4C24, RT24, 4C48, RT48, respectively. BALF samples that were categorized as non-inflammatory were misdiagnosed as inflammatory (ie, neutrophilic, eosinophilic, or mixed) in 45%, 55%, 45%, and 73% of samples stored at 4C24, RT24, 4C48, RT48, respectively, with the majority of these samples being inappropriately categorized as eosinophilic inflammation.
Table 3.
The number of samples that had a change in cytological diagnosis following storage.
| 4C24 | 4C48 | RT24 | RT48 | |
|---|---|---|---|---|
| Non-inflammatory to inflammatory | 5/11 | 5/11 | 6/11 | 8/11 |
| Inflammatory to non-inflammatory | 3/34 | 5/34 | 4/34 | 6/34 |
| Mixed inflammation to non-inflammatory | 0/5 | 1/5 | 0/5 | 0/5 |
| Mixed inflammation to eosinophilic | 3/5 | 4/5 | 4/5 | 4/5 |
| Mixed inflammation to neutrophilic | 0/5 | 0/5 | 0/5 | 0/5 |
| Neutrophilic to non-inflammatory | 3/21 | 4/21 | 4/21 | 6/21 |
| Neutrophilic to eosinophilic | 1/21 | 2/21 | 1/21 | 3/21 |
| Neutrophilic to mixed inflammation | 1/21 | 3/21 | 1/21 | 1/21 |
| Eosinophilic to non-inflammatory | 0/8 | 0/8 | 0/8 | 0/8 |
| Eosinophilic to neutrophilic | 0/8 | 1/8 | 0/8 | 0/8 |
| Eosinophilic to mixed inflammation | 0/8 | 0/8 | 1/8 | 2/8 |
| Non-inflammatory to eosinophilic | 3/11 | 5/11 | 4/11 | 6/11 |
| Non-inflammatory to mixed inflammation | 2/11 | 0/11 | 1/11 | 0/11 |
| Non-inflammatory to neutrophilic | 0/11 | 0/11 | 1/11 | 2/11 |
NB: Samples are grouped according to baseline cytological diagnosis and diagnosis following storage. Samples are further divided based on the storage condition (4C24, 4C48, RT24, RT48) at which a change in cytological diagnosis was demonstrated. The first two rows of the table represent the number of samples that had a change in cytological diagnosis from non-inflammatory to inflammatory (ie, mixed, eosinophilic, or neutrophilic inflammation) or inflammatory to non-inflammatory. As a result, these two rows include all cats included in the study and should be interpreted separate from the remaining rows which are specific to individual diagnostic categories.
Discussion
Storage of feline BALF at various time and temperature conditions alters total and DCC, cellular morphology, and cytological diagnosis. Accurate cytological evaluation of BALF is important for appropriate diagnosis and treatment of feline lower respiratory disease. 3,11 As collection of BALF gains popularity in the private practice setting, the results of the current study can provide valuable guidelines for ideal sample handling. There was a significant decrease in BALF TNCC in samples stored at RT for 48 h. In addition, storage at RT for 24 and 48 h resulted in an increase in the percentage of BALF eosinophils and storage at 4°C for 48 h and RT for 24 and 48 h resulted in a decrease in the percentage of BALF neutrophils. Cellular morphology was significantly altered in all stored samples, and a change in diagnosis occurred in 31–57% of stored samples, with the percentage of samples having a change in diagnosis increasing with an increase in storage time and temperature. These results suggest that feline BALF should be evaluated promptly after collection.
Determination of BALF TNCC is important for identifying cellular infiltration into the airways, as cats with lower airway disease (eg, inflammatory, infectious) have been shown to have increased TNCC when compared to healthy cats. 12 As expected, BALF TNCC was decreased in samples stored for 48 h at RT, providing evidence that TNCC should be performed within 24 h of collection. A Coulter particle counter was used to determine the TNCC in the present study. As a result, the TNCC reported may be falsely increased as dead cells or large portions of ruptured cells may have been included in the cell count. This is in comparison to evaluating TNCC using a manual cell count technique (eg, hemocytometer using trypan blue exclusion) resulting in a count that included only living cells. While the results of the present study correlate with those of a study evaluating equine BALF TNCC following storage, the equine study used a manual cell count technique to report TNCC. 5
Accurate cytological analysis is important when characterizing airway inflammation in cats. This is especially true when classifying non-infectious causes of feline lower airway disease. While the percentage of BALF eosinophils was increased following storage at RT for 24 and 48 h, it is important to remember that changes in the percentage of eosinophils are a reflection of changes in the number of other cell types. The relative increase in percentage of eosinophils is the result of a decrease in other cell lines (eg, neutrophils) due to cellular apoptosis accelerated with storage at RT, not an actual increase in eosinophils. Although there is little evidence regarding the ex vivo lifespan of the feline neutrophil, a study evaluating canine neutrophil survival found that >80% of neutrophils had undergone apoptosis following 16 h of storage. 13 The decrease in the percentage of BALF neutrophils in samples stored at 4°C for 48 h and RT for 24 and 48 h reflects the short lifespan of a neutrophil. 13 Further, the current study found the percentage of BALF neutrophils was not significantly altered following storage at 4°C for 24 h, suggesting lower temperature conditions may help to preserve the neutrophil cell fraction. While the authors do not recommend delaying processing of BALF, if storage is inevitable, results of our study suggest that storage at 4°C is preferred over RT.
Morphological scores were assigned based on the ease of cellular identification. Inappropriate sample handling may result in alterations in cell quality due to release of cellular enzymes, a low protein medium, and delays in sample processing. 14 A recent study evaluating storage of canine BALF found the diagnostic quality of BALF was not altered when stored at 4°C for up to 48 h. 15 In contrast, in the present study, cellular morphology deteriorated in stored BALF when compared with baseline, regardless of time and temperature conditions. Although morphology was altered regardless of the storage condition, samples stored at RT appear to be more affected, with 52% of RT24 samples and 75% of RT48 samples having a morphology score of 3/4 or 4/4. This is in comparison to 26% of 4C24 and 36% of 4C48 samples having a morphology score of 3/4 or 4/4. In addition, two samples stored for 48 h (one at 4C and one at RT) did not have any identifiable intact cells (only cellular debris was noted), and therefore, a diagnosis was unattainable. Alterations in cellular morphology may explain changes in DCC and cytological diagnosis in stored samples. Of the samples that had a morphology score of 3/4 or 4/4, 57% and 45% stored at 4C48 and RT48, respectively, resulted in an inaccurate cytological diagnosis (ie, a different diagnosis than what was reached with evaluation of baseline samples). These results emphasize the importance of timely evaluation of feline BALF to obtain an accurate diagnosis.
Human BALF stored for 4 h at ambient temperature does not result in in vitro bacterial growth. 6 However, when stored at 4°C for 24 h and RT for 8 h, equine BALF has a significant increase in bacterial score. 5 In the present study, the presence of extracellular bacteria in BALF samples stored for 48 h at 4°C (n=2) and RT (n=8) is suggestive of in vitro bacterial growth. These samples had no evidence of bacteria at baseline or at 24 h storage time points. In an effort to mimic the setting of a veterinary practice, BALF was collected using a blind technique and aliquots were made under clean but not sterile conditions. Bacterial cultures at baseline and at each time and temperature condition were not obtained so the effect of storage on culture results is not known. It is possible that samples with no identifiable bacteria at baseline would have had a positive culture; however, even if positive cultures were noted they would have been unlikely to be clinically important as degenerate neutrophils and/or intracellular bacteria were not observed in the baseline samples from the cats of this study. Nevertheless, cytological evidence of numerous bacteria after BALF storage may result in inaccurate diagnosis of a bacterial infection, resulting in unnecessary treatment with antimicrobials and/or failure to recognize the primary disease process (eg, feline asthma).
After storage, cytological analysis of BALF resulted in misclassification of inflammatory airway disease (eg, eosinophilic, neutrophilic, mixed) as non-inflammatory in 9–18% of samples, with the percentage of samples being incorrectly categorized rising with increasing storage time and temperature. Additionally, 31–57% of BALF samples had a change in cytological diagnosis following storage, similarly rising along with the increase in storage time and temperature. The results of this study have important implications for therapeutic planning and monitoring response to therapy. As many as 1/6 cats would be inaccurately categorized as non-inflammatory (ie, ‘normal’) if BALF was stored at RT for 48 h before being processing. As a result, these cats would not be treated for the presence of inflammatory airway disease, compromising the long-term health of these patients. In addition, as many as one out of every two cats would have been assigned the wrong cytological diagnosis when BALF was stored at RT for 48 h, potentially impairing appropriate therapeutic intervention, as well as compromising effective monitoring of response to treatment.
In conclusion, analysis of feline BALF should ideally be performed promptly after collection to obtain the most accurate DCC, ideal cell morphology and unadulterated cytological diagnosis. If a delay in sample analysis can not be avoided, storage at 4°C is preferred over RT, however, an accurate cytological diagnosis can not be guaranteed. The method by which the TNCC is determined (eg, manual count versus particle counter) will likely influence fluctuations in cell number over time. For laboratories using particle counters, cell counts should be performed within 24 h of collection in order to obtain the most accurate TNCC. Future studies may consider further evaluation of bacterial growth by performing microbial cultures at baseline and after storage.
Acknowledgement
The authors would like to thank Rachael Cohen and Ashley Stich for their technical support.
References
- 1.Corcoran B.M., Foster D.J., Fuentes V. Luis. Feline asthma syndrome: a retrospective study of the clinical presentation in 29 cats, J Small Anim Pract 36, 1995, 481–488. [DOI] [PubMed] [Google Scholar]
- 2.Foster S.F., Allan G.S., Martin P., Robertson I.D., Malik R. Twenty-five cases of feline bronchial disease (1995–2005), J Feline Med Surg 6, 2004, 181–188. [DOI] [PMC free article] [PubMed] [Google Scholar]
- 3.Hawkins E.C., DeNicola D.B., Kuehn N.F. Bronchoalveolar lavage in the evaluation of pulmonary disease in the dog and cat, J Vet Int Med 4, 1990, 267–274. [DOI] [PubMed] [Google Scholar]
- 4.Klech H., Pohl W. Technical recommendations and guidelines for bronchoalveolar lavage (BAL): Report of the European Society of Pneumology Task Group on BAL, Eur Respir J 2, 1989, 561–585. [PubMed] [Google Scholar]
- 5.Pickles K., Pirie R.S., Rhind S., Dixon P.M., McGorum B.C. Cytological analysis of equine bronchoalveolar lavage fluid. Part 3: the effect of time, temperature and fixatives, Equine Vet J 34, 2002, 297–301. [DOI] [PubMed] [Google Scholar]
- 6.Rankin J.A., Naegel G.P., Reynolds H.Y. Use of a central laboratory for analysis of bronchoalveolar lavage fluid, Am Rev Resp Dis 133, 1986, 186–190. [DOI] [PubMed] [Google Scholar]
- 7.Reinero C.R. Norris, Decile K.C., Berghaus R.D., et al. An experimental model of allergic asthma in cats sensitized to house dust mite or Bermuda grass allergen, Int Arch Allergy Immunol 135, 2004, 117–131. [DOI] [PubMed] [Google Scholar]
- 8.DeClue A.E., Williams K.J., Sharp C., Haak C., Lechner E., Reinero C.R. Systemic response to low-dose endotoxin infusion in cats, Vet Immunol Immunopathol 132, 2009, 167–174. [DOI] [PubMed] [Google Scholar]
- 9.Nafe L.A., DeClue A.E., Lee-Fowler T.M., Eberhardt J.M., Reinero C.R. Evaluation of biomarkers in bronchoalveolar lavage fluid for discrimination between asthma and chronic bronchitis in cats, Am J Vet Res 71, 2010, 583–591. [DOI] [PubMed] [Google Scholar]
- 10.Benjami Y., Hochberg Y. Controlling the false discovery rate: a practical and powerful approach to multiple testing, J R Stat Soc 57, 1995, 289–300. [Google Scholar]
- 11.Foster S.F., Martin P., Braddock J.A., Malik R. A retrospective analysis of feline bronchoalveolar lavage cytology and microbiology (1995–2000), J Feline Med Surg 6, 2004, 189–198. [DOI] [PMC free article] [PubMed] [Google Scholar]
- 12.Dehard S., Bernaerts F., Peeters D., et al. Comparison of bronchoalveolar lavage cytospins and smears in dogs and cats, J Am Anim Hosp Assoc 44, 2008, 285–294. [DOI] [PubMed] [Google Scholar]
- 13.Xiong Q., Bao W., Ge Y., Rikihisa Y. Ehrlichia ewingii infection delays spontaneous neutrophil apoptosis through stabilization of mitochondria, J Infect Dis 197, 2008, 1110–1118. [DOI] [PubMed] [Google Scholar]
- 14.Brinson J., McCullough S. Collection and interpretation of respiratory cytology, Clin Tech Small Anim Pract 14, 1999, 220–226. [DOI] [PubMed] [Google Scholar]
- 15.Patrick M.H., Wills T., Sellon R.K. The quality of canine bronchoalveolar lavage fluid cytology is preserved for up to 72 hours with or without autologous serum, J Vet Int Med 23, 2009, 752, [abstract] [Google Scholar]


