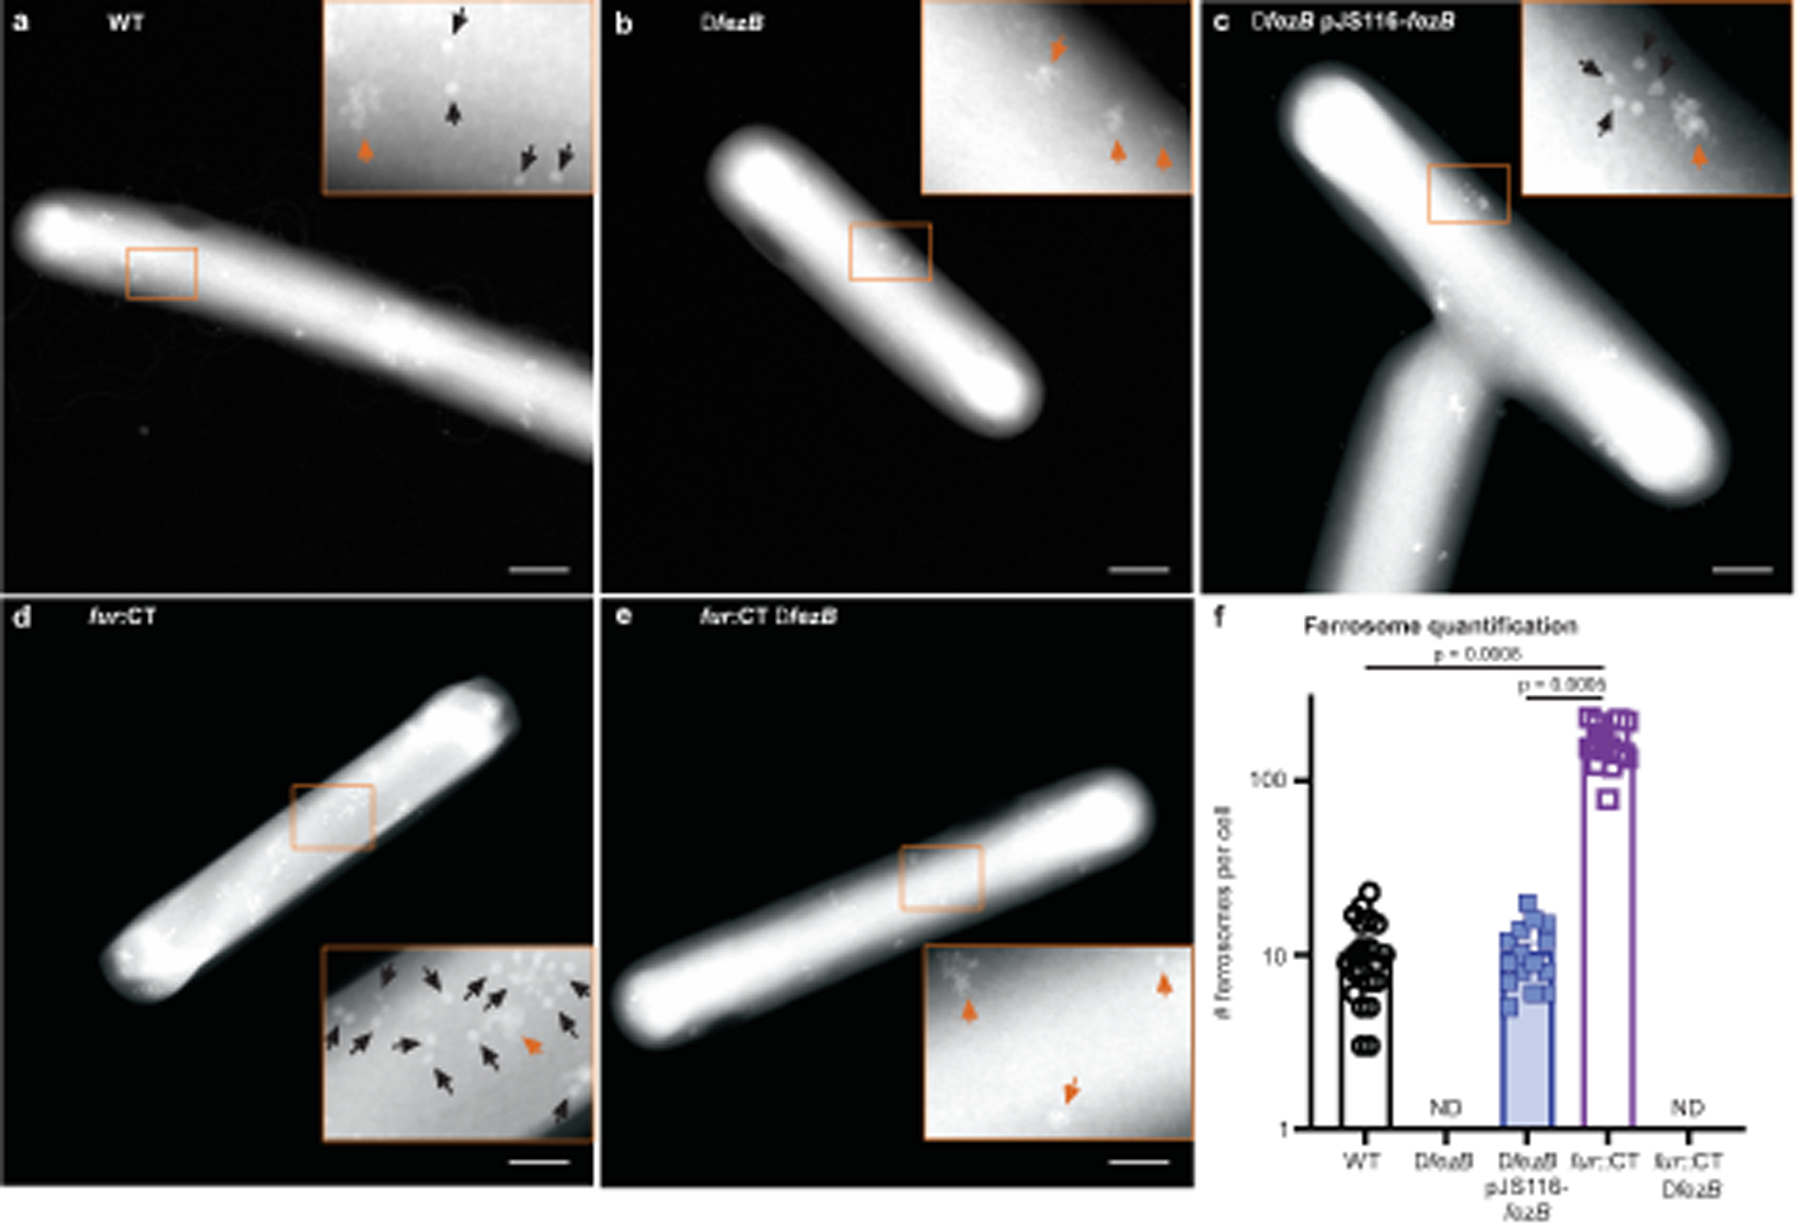
Fig. 2 |. FezB is required for intracellular biomineralization in C. difficile.

a–e, Electron-dense granules were visualized using the HAADF detector of the scanning transmission electron microscope. Representative images shown are WT (a), ΔfezB (b), ΔfezB pJS116-fezB (c), fur::CT (d) and fur::CT ΔfezB (e). Insets, the faceted granules are denoted by black arrows whereas disordered iron precipitates are indicated by orange arrows. Scale bars, 500 nm. f, Numbers of ferrosomes were quantified in individual cells of each strain and data are presented as mean ± s.e.m. (n = 20). Statistical analyses were done using one-way analysis of variance (ANOVA) and the P values are denoted in the graph. ND, not detectable.
