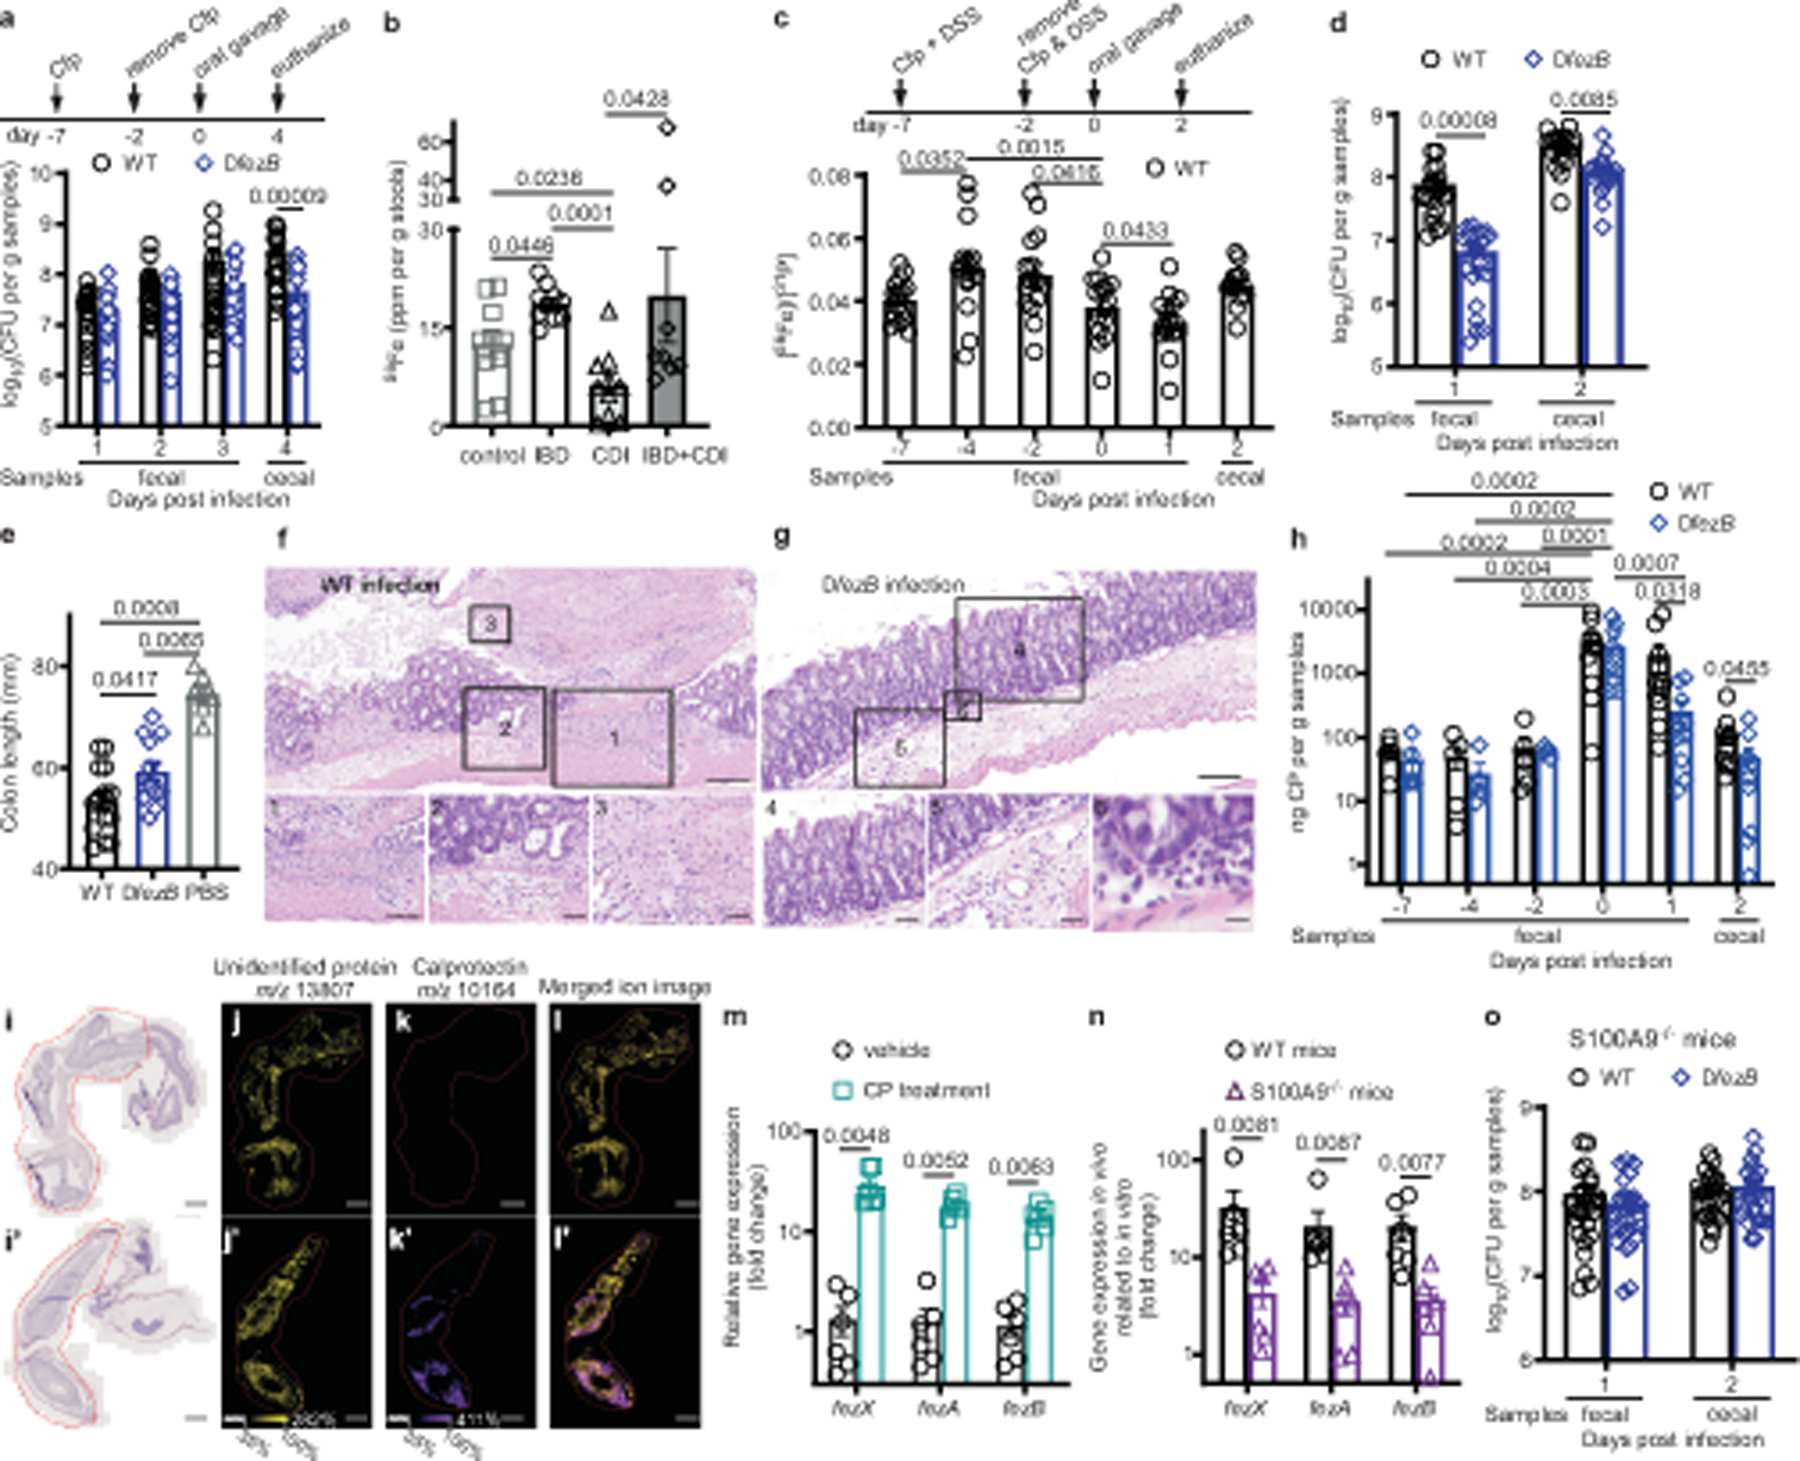
Fig. 5 |. C. difficile ferrosomes circumvent CP-mediated iron sequestration.

a, CFUs of C57BL/6J mice infected with WT or ΔfezB spores (n = 20). b, Fe levels were quantified by ICP-MS in stools. Data are expressed as ppm per gram of stools, n = 10 for all groups except IBD + CDI (n = 8). c–h, Infection studies were conducted using mice pretreated with both Cfp and DSS for 5 d. c,d, Fe levels (c) (n = 10) and CFUs (d) (n = 20) were monitored. e, Colon lengths of mice were quantified at 2 dpi (n = 10). f,g, Representative photomicrographs of H&E-stained colon slides infected with WT (f) or ∆fezB (g). f, A ‘volcano’ lesion from a mouse infected with WT. Inset 1, ulceration of the mucosa; inset 2, neutrophils and oedema; inset 3, fibrin and necrosis. g, Murine colon infected with ∆fezB showing unaffected mucosa (inset 4) and neutrophilic inflammation in the mucosa (insets 5 and 6). Scale bars, 100 μm (inset 1, 100 μm; insets 2, 4, 5, 50 μm; insets 3, 6, 20 μm). h, CP levels were quantified and presented as mean ± s.e.m. (n = 10). i–l, Distribution of CP in colons examined using matrix-assisted laser desorption/ionization (MALDI)-IMS of S100a9−/− (i–l) or C57BL/6J (i′–l′) mice infected with WT spores. i,i′, H&E staining of murine colons. Red outlines indicate areas sampled for IMS. MALDI-IMS ion images of an unidentified protein (yellow) ( j,j′), CP (purple) (k,k′) or merged (l,l′). Scale bars, 1,000 μm. m,n, Expression of fezXAB was quantified by qPCR in vitro (m) and in vivo (n). Data are presented as mean ± s.e.m. (n = 6). o, CFUs of S100a9−/− mice infected with WT or ΔfezB spores (n = 25). Data are mean ± s.e.m. f,g,i–l,i′–l′, Experiments were conducted twice independently with similar results. Statistical analyses used two-way ANOVA (a,h), one-way ANOVA (b–c,e) or two-tailed t-tests (d,m–o) and P values are denoted. Cfp, cefoperazone; CFU, colony forming units; H&E, haematoxylin and eosin.
