

Abstract
Since October 2014, the Government of India has worked towards the goal of eliminating open defecation by 2019 through the Swachh Bharat Mission. Since October 2014, the Government of India (GOI) has worked towards the goal of eliminating open defecation by 2019 through the Swachh Bharat Mission (SBM). In 2014, several of the co-authors reported on a survey of rural sanitation behaviour in North India (Coffey et al 2014) conducted by the Research Institute for Compassionate Economics (r.i.c.e.). Different statistical methods produce slightly different numbers, but results from a wide range of approaches used concur that approximately 40% to 50% of rural people in these states defecated in the open in late 2018. The 2014 survey used a multistage sampling strategy to select households: first, districts were purposively selected to match the state-level trend in rural open defecation between the 2001 and 2011 Censuses; second, villages were randomly drawn using proportional-to-size sampling from a frame taken from the Government of India’s District Level Health Survey; third, households were selected using an in-field randomisation technique similar to that used for Pratham’s Annual Status of Education Report (ASER) survey.
Since October 2014, the Government of India has worked towards the goal of eliminating open defecation by 2019 through the Swachh Bharat Mission. In June 2014, the results of a survey of rural sanitation behaviour in North India were first reported. The results from a late 2018 survey that revisited households from the 2014 survey in four states—Bihar, Madhya Pradesh, Rajasthan, and Uttar Pradesh—are presented. Although rural latrine ownership increased considerably over this period, open defecation remains very common in these four states. There is substantial heterogeneity across states in what the sbm did and how. These outcomes suggest the need for a transparent, fact-based public dialogue about the sbm, its costs and benefits, and its accomplishments and means. Since October 2014, the Government of India (GOI) has worked towards the goal of eliminating open defecation by 2019 through the Swachh Bharat Mission (SBM). By December 2018, 27 states had been declared open defecation free (ODF). In 2014, several of the co-authors reported on a survey of rural sanitation behaviour in North India (Coffey et al 2014) conducted by the Research Institute for Compassionate Economics (r.i.c.e.). Here, we report results from a late 2018 survey that revisited households from the 2014 survey in four states, Bihar, Madhya Pradesh (MP), Rajasthan, and Uttar Pradesh (UP).
Although rural latrine ownership increased considerably over this period, open defecation remains very common in these four states. Different statistical methods produce slightly different numbers, but results from a wide range of approaches used concur that approximately 40% to 50% of rural people in these states defecated in the open in late 2018. This has reduced significantly from about 70% of rural people in the 2014 survey. Much of the reduction in open defecation is driven by new latrine construction; nearly six in 10 households that did not own a latrine in 2014 acquired one by the 2018 survey. However, the fraction of people who own a latrine, but who nevertheless defecate in the open, did not change between 2014 and 2018; it was about 23% in both years.
The survey documents substantial heterogeneity across states in SBM implementation and effects. For instance, there was substantial cross-state variation in the proportion of households with newly acquired latrines, and in the proportion of latrines that were constructed by contractors rather than by households. Many respondents reported that SBM officials threatened them with fines, threatened to withhold government benefits, such as public distribution system (PDS) rations, or stopped them while defecating in the open. We discuss these three practices collectively as coercion, by which we mean persuading someone to do something using force or threats. The Scheduled Tribe (ST) and Scheduled Caste (SC) households were more likely than households from other social groups to report that they faced coercion. The variation in SBM-related coercion is correlated with variation in sanitation outcomes. In villages where more people reported coercive SBM activities, more people also reported switching to latrine use on an average. In a setting in which respondents may have feared punishment for not building or using a latrine, however, the estimates presented in this paper may understate the true levels of open defecation.
The survey reported here is well-positioned to help us understand the changes in rural open defecation during the period of the SBM. It provides an up-to-date assessment for the four states studied, even more so than the estimates available from the 2015–16 National Family Health Survey-4 (NFHS-4). We note, though, that relative to other states in India, rural open defecation is high in Bihar, MP, Rajasthan, and UP, and so our results are not representative of rural India as a whole. These four states are nevertheless important because their rural populations constitute over two-fifths of India’s rural population. We report quantitative, representative estimates based on sampling weights and demographic strategies that allow us to describe the rural populations of these four states, collectively. This paper will sometimes refer to “the focus states,” “North India,” or “the region;” these terms are used interchangeably to mean the rural population of these four states.
This paper details three main conclusions.
Much open defecation remains: In Coffey et al (2014), published in this journal, we computed a projection: if a latrine was provided for every rural household in these states, over 40% of the population would nevertheless defecate in the open. Our estimates from the 2018 data here cohere with that projection. Open defecation rates vary across North India, but despite active SBM implementation in many districts, open defecation has not been eliminated from any of the studied districts. Throughout the region, the number of rural people who defecate in the open is nearly as large as the number of people who do not. The different estimation strategies we apply to the new survey data suggest that between 42% and 57% of rural people over two years of age defecate in the open, with a preferred estimate of 44%. These findings contrast with government claims that open defecation has been entirely or largely eliminated (GOI 2018).
In its activities and its results, the SBM was diverse: Details of the SBM’s implementation varied across states. States differ in the extent to which households acquired latrines and the extent to which households constructed latrines themselves or received them from contractors organised by local government officials.1 This matters because people in households that received money to build their own latrine, rather than a government constructed latrine, were almost 10 percentage points less likely to defecate in the open. States also differ in how much officials encouraged latrine use in addition to construction.
There were commonalities in SBM implementation across states as well: Timelines for latrine construction were time-bound and short. In Rajasthan and MP, some villages were no longer implementing SBM (neither providing funds for toilet construction nor encouraging latrine use); in UP and Bihar, SBM activities had not started in some villages and were ongoing in others. Throughout the region, involvement of village, block, and district officials in SBM programme implementation had been more active than in prior sanitation programmes.
The SBM has had both benefits and costs. The reduction in open defecation it brought about is likely to improve health. But this comes at a social cost: coercion and threats were commonplace and sometimes violent. Reducing open defecation, even if it is not eliminated, is likely to improve health and contribute to economic prosperity. These are essential and worthy goals. But it is important to consider the costs of achieving these improvements. The SBM used coercion and threats to achieve toilet construction and, less often, its use. Coercion included harassment, fines, denial of public benefits (such as PDS rations), and, in some cases, even detention by the police. The ST and SC households were more likely to report coercion. Reductions in open defecation brought about through coercion may not last.
Data Sources and Fieldwork
The 2018 rural sanitation survey: The 2018 rural sanitation survey was conducted by r.i.c.e. over a four-month period from 24 August to 30 December. The survey visited Rajasthan in August, September and December, MP in September, UP in October, and Bihar in November and December.
Table 1 summarises the number of villages and households that were surveyed in each state as well as the number of people in those households. The 2018 rural sanitation survey revisited a random subset of 157 villages from the 2014 survey, in 11 districts. The 2014 survey used a multistage sampling strategy to select households: first, districts were purposively selected to match the state-level trend in rural open defecation between the 2001 and 2011 Censuses; second, villages were randomly drawn using proportional-to-size sampling from a frame taken from the Government of India’s District Level Health Survey; third, households were selected using an in-field randomisation technique similar to that used for Pratham’s Annual Status of Education Report (ASER) survey. The Rajasthan sample is smaller than that for the other states because the survey only visited two districts in Rajasthan; it visited three districts in other states.2 Of the 1,389 households that we attempted to reinterview in 2018, we were able to reinterview 1,224 (88%).
Table 1:
Description of Fieldwork and Sample
| Persons | Households | Households in 2014 Sample | Refresher Households Not in 2014 Sample | Villages | |
|---|---|---|---|---|---|
| Focus states (full sample) | 9,812 | 1,558 | 1,224 | 334 | 120 |
| Bihar | 2,669 | 367 | 293 | 74 | 30 |
| Madhya Pradesh | 2,660 | 459 | 347 | 112 | 34 |
| Rajasthan | 1,539 | 241 | 172 | 69 | 25 |
| Uttar Pradesh | 2,944 | 491 | 412 | 79 | 31 |
Data source: 2014 and 2018 rural sanitation surveys.
In addition to the households that were part of the 2014 survey, the 2018 survey also added a refresher sample, which comprises 21% of the 2018 sample. Refresher samples are common in panel studies, including the India Human Development Survey panel, collected in 2005 and 2011 (Desai et al 2012). Refresher households were added to the 2018 sample in one of three ways: first, if a household head from the 2014 survey passed away or migrated, surveyors randomly selected a household to interview from among his sons who were living in the village; second, if a household from the 2014 sample moved out of the village, a neighbouring household was randomly selected as a replacement; third, when all reinterviews and neighbour interviews were completed in the village, surveyors interviewed new households in parts of the village that had not been covered by the 2014 survey.3 These new households were selected using an in-field randomisation technique similar to the one used by Pratham’s ASER survey. The survey data from both the 2014 and the 2018 surveys are publicly available.4
We achieve representativeness of the rural population of these states by constructing weights based on the 2011 Census of India, which we describe below. One reason to be confident of our results is that, within each state, using census weights does not importantly change our summary statistics or estimates of open defecation.
Qualitative data collection: Our fieldwork also included a substantial qualitative component. This qualitative fieldwork was designed to understand how the SBM was implemented. The two leading co-authors of the paper conducted 156 qualitative interviews in the same villages and blocks as the quantitative interviews in the 2018 survey. These interviews inform our interpretation of the statistics that we present.
Case study of Udaipur, Rajasthan: Additionally we draw upon a case study of Udaipur, Rajasthan conducted by the Accountability Initiative of the Centre for Policy Research (Deshpande and Kapur 2018). The objective of the study was to assess the administrative processes by which ODF gram panchayats had become ODF and verify their current status. The 2017 Accountability Initiative study followed a larger assessment of SBM done in December 2015, in which Udaipur was one among 10 districts across five states. The fact that Accountability Initiative did fieldwork in Udaipur district at different points in SBM implementation helps build understanding of the impacts of SBM in Udaipur.
Between April and June 2017, Accountability Initiative’s Udaipur survey interviewed 505 households in 19 villages, and 60 households in two census towns (a total of 565 households in ODF catchments). The survey was self-weighted to be representative of ODF panchayats in Udaipur. Of these, 171 households were from declared and “verified” ODF panchayats; the remaining households were from declared (but not verified) ODF panchayats.
Accountability Initiative’s 2017 Udaipur survey did not have the same survey questionnaire or sampling strategy as the 2018 rural sanitation survey, nor was Udaipur district one of the Rajasthan districts visited by the 2018 survey. Although data from Accountability Initiative’s 2017 Udaipur survey are not included in the tables and figures, we summarise its findings to show that complementary evidence, collected by multiple research teams, produces reinforcing conclusions.
How Much Open Defecation Remains?
Three estimation strategies: We describe how we construct estimates of population-level open defecation for the focus states. Because villages and households were randomly selected, we can produce estimates that are representative of these states. There are multiple ways that a sample survey can extrapolate to estimates that are intended to be representative of the population. In any empirical study, each candidate estimation strategy has advantages and disadvantages. So, we report estimates of the overall fraction of people who defecate in the open using three complementary strategies:
(i) Unweighted sample means: This is the simplest strategy. We report the fraction of respondents in our sample who defecate in the open, without adjustments.
(ii) Census-weighted sample means: This is our preferred strategy, and the one that we use as a default unless otherwise stated. We report the fraction of people in our sample who defecate in the open, weighted by age and sex to be representative of the population of the region. Here, the assumption is open defecation among people in our data is comparable to open defecation of people in the same state who match on age and sex, as recorded in the 2011 Census.
(iii) Weights from matched demographic survey data: For this strategy, we conduct a person-level match—within each of the four states—to people in the 2015–16 NFHS-4 who match on demographic and socio-economic categories. The categories we use combine age, sex, whether the person has been to school, and what combination of the following assets their household owns: a television, a pressure cooker, a fan, a cooler, a mosquito net, a fridge, and a motorcycle. We assign each individual in the NFHS-4 the average open defecation rate among matched people like them in our survey data, then compute average open defecation. Here, the assumption is open defecation among people in our data is comparable to open defecation of people in the same state who match on these detailed demographic and socio-economic characteristics.
We show results using three different strategies in order to emphasise that we draw the same general policy conclusions no matter which strategy is used. Any survey’s results depend on the choice of weighting strategy, but our qualitative conclusions are robust to all three strategies. The 2018 survey questionnaire and Stata do-files used to produce estimates from the 2018 survey are publicly available on the r.i.c.e. website.
Estimates of open defecation in 2018: Table 3 (p 58) presents estimates of the frequency of open defecation among rural people over two years of age (rows labelled “all”) and among rural people over 18 years old (rows labelled “adults”) living in the focus states using each of the three strategies described earlier. Averaging over the entire region, and over people who do and do not own latrines,5 we compute that about 44% of all people defecate in the open, with our preferred census-based sampling weights. If we use only the households that were in the 2014 sample (that is, if we drop the refresher households from the analysis), we find a similar result (42%).
Table 3:
Open Defecation in Rural North India, 2018
| Sample | Latrine Owners | Weight | Focus States (%) | Bihar (%) | Madhya Pradesh (%) | Rajasthan (%) | Uttar Pradesh (%) |
|---|---|---|---|---|---|---|---|
| All | Owners and not | No weight | 42 | 59 | 24 | 52 | 38 |
| All | Owners and not | Census | 44 | 60 | 25 | 53 | 39 |
| All | Owners and not | DHS weights | 57 | 77 | 29 | 62 | 53 |
| Adults | Owners and net | No weight | 41 | 57 | 23 | 52 | 38 |
| Adults | Owners and not | Census | 43 | 57 | 23 | 54 | 38 |
| Adults | Owners and not | DHS weights | 54 | 73 | 27 | 61 | 50 |
| All | Latrine owners | Census | 23 | 21 | 16 | 40 | 21 |
| Adults | Latrine owners | Census | 23 | 19 | 15 | 41 | 21 |
| Adult F | Owners and not | Census | 41 | 57 | 21 | 53 | 34 |
| Adult F | Latrine owners | Census | 20 | 18 | 13 | 39 | 17 |
| Adult M | Owners and not | Census | 44 | 56 | 25 | 56 | 41 |
| Adult M | Latrine owners | Census | 25 | 21 | 17 | 43 | 24 |
F = Females; M = Males.
Data source: 2018 rural sanitation survey.
Notice the effect of the sampling weights in Table 3. Within states, moving from unweighted estimates to census-weighted estimates makes little difference. For example, person-level open defecation for UP is approximately 38% with or without weights. However, using census weights at the region level (for the focus states as a whole) appropriately yields a large increase in the estimate of open defecation because it is common in UP and Bihar, and these states have larger populations.
Table 3 also reports estimates of open defecation using weights constructed by matching assets in the NFHS-4, as well as age and sex. These weights produce larger estimates of open defecation because the NFHS-4 sample is asset-poorer than our sample. Using these weights has the effect of up-weighting disadvantaged households.6
Although not reported in the table, we find that 40% of households with a latrine have at least one person who defecates in the open, and 56% of all households have at least one person who defecates in the open. This, too, coheres with the central finding of Coffey et al (2014), which finds that, in rural North India, open defecation is common even in latrine-owning households.
It is important to note that the estimates in Table 3 most likely understate open defecation. Even though we designed the defecation behaviour questions to minimise social desirability bias,7 the majority of respondents reported being aware of some form of coercion being used in the village to encourage latrine construction and use. It is likely that some respondents did not disclose open defecation despite surveyors’ best attempts to encourage respondents to feel comfortable telling the truth.
Changes in open defecation, 2014–18: Table 4 summarises the changes in open defecation and latrine ownership between the two surveys. It includes all observations in the 2018 survey (including newly added households) and all observations in the 2014 survey (including those that were not reinterviewed in 2014).8 All of the estimates in Table 4 use census weights described earlier. For latrine ownership, household-level census weights are the sum of the person-level census weights of people living in the household.
Table 4:
Change in Open Defecation, 2014–18
| Focus States | Bihar | Uttar Pradesh | Madhya Pradesh | Rajasthan | |
|---|---|---|---|---|---|
| Open defecation, 2018 | 44% | 60% | 39% | 25% | 53% |
| Open defecation, 2014 | 70% | 75% | 65% | 68% | 76% |
| Open defecation, change | 26pp | 15pp | 26pp | 43pp | 26pp |
| Latrine ownership, 2018 | 71% | 50% | 73% | 90% | 78% |
| Latrine ownership, 2014 | 37% | 29% | 42% | 43% | 31% |
| Latrine ownership, change | 33pp | 21pp | 31pp | 47pp | 47pp |
| ΔOD due to behaviour | 1pp | 1pp | 3pp | 7pp | −7pp* |
| ΔOD due to ownership | 25pp | 15pp | 23pp | Z7pp | 30pp |
| % of change due to ownership | 96% | 97% | 89% | 84% | 130% |
“pp” stands for “percentage points.”
The Kitagawa decomposition has a negative component for Rajasthan because open defecation conditional on ownership increased for both latrine owners and non-owners.
Data source: 2014 and 2018 rural sanitation surveys.
In 2018, at the state level, open defecation ranged from 25% in MP to 60% in Bihar. These results contrast with government claims that these states are entirely or largely provided with latrines and open defecation free (for example, GOI 2018).9 Nevertheless, we find important reductions in open defecation. In the region as a whole, open defecation declined from approximately 70% of people over two years old in 2014, to approximately 44% of people over two years old in 2018.
This reduction of 26 percentage points in individual open defecation over a four-year period (more than 6 percentage points per year) was rapid compared to the likely rate of decline in prior years. Although there are, unfortunately, no directly comparable data on individual-level open defecation from prior surveys, the NFHS measures open defecation at the household-level (according to what people in the household usually do) and provides a roughly comparable estimate. It finds that household-level open defecation in the region declined at less than 2 percentage points per year (from about 87% of households to about 70% of households) between 2005 and 2015.
Where is the decline in open defecation coming from? How did it occur? The last three rows of Table 4 show the results of a Kitagawa decomposition of the decline of individual-level open defecation. Open defecation depends on two factors: latrine ownership, on the one hand, and behaviour among latrine owners and non-owners, on the other. A Kitagawa decomposition is a tool in demography that separates a change in a weighted average into its two component factors—the weights and the conditional means (Kitagawa 1955). In this case, latrine ownership is the weight (what fraction of the population does and does not own a latrine) and behaviour is the conditional expectation (what fraction of owners and non-owners defecate in the open).10
We find that nearly the entire change in open defecation between 2014 and 2018 comes from increases in latrine ownership, rather than from changes in behaviour (that is, differences in the proportion of owners and non-owners who defecate in the open). This finding is consistent with our qualitative interviews, which found that local officials were far more likely to stress latrine construction as a priority of the SBM than they were to stress use of latrines. Figure 1 tells a similar story to the one told by the Kitagawa decomposition. It presents local polynomial regressions of open defecation on age (separately for men and women) for the 2014 data and the 2018 data. Panels (a) and (b) show relatively large declines in open defecation among both men and women between 2014 and 2018. Panels (c) and (d) show, as the decomposition did, that latrine use among latrine owners was essentially unchanged in 2018 relative to the 2014 survey. Although not shown in the graph, we note that latrine use among owners is higher for people who have owned latrines for longer periods of time: among people in households that had latrines in 2014, 10% defecate in the open, whereas among people in households that acquired latrines between 2014 and 2018, 36% defecate in the open.
Figure 1:
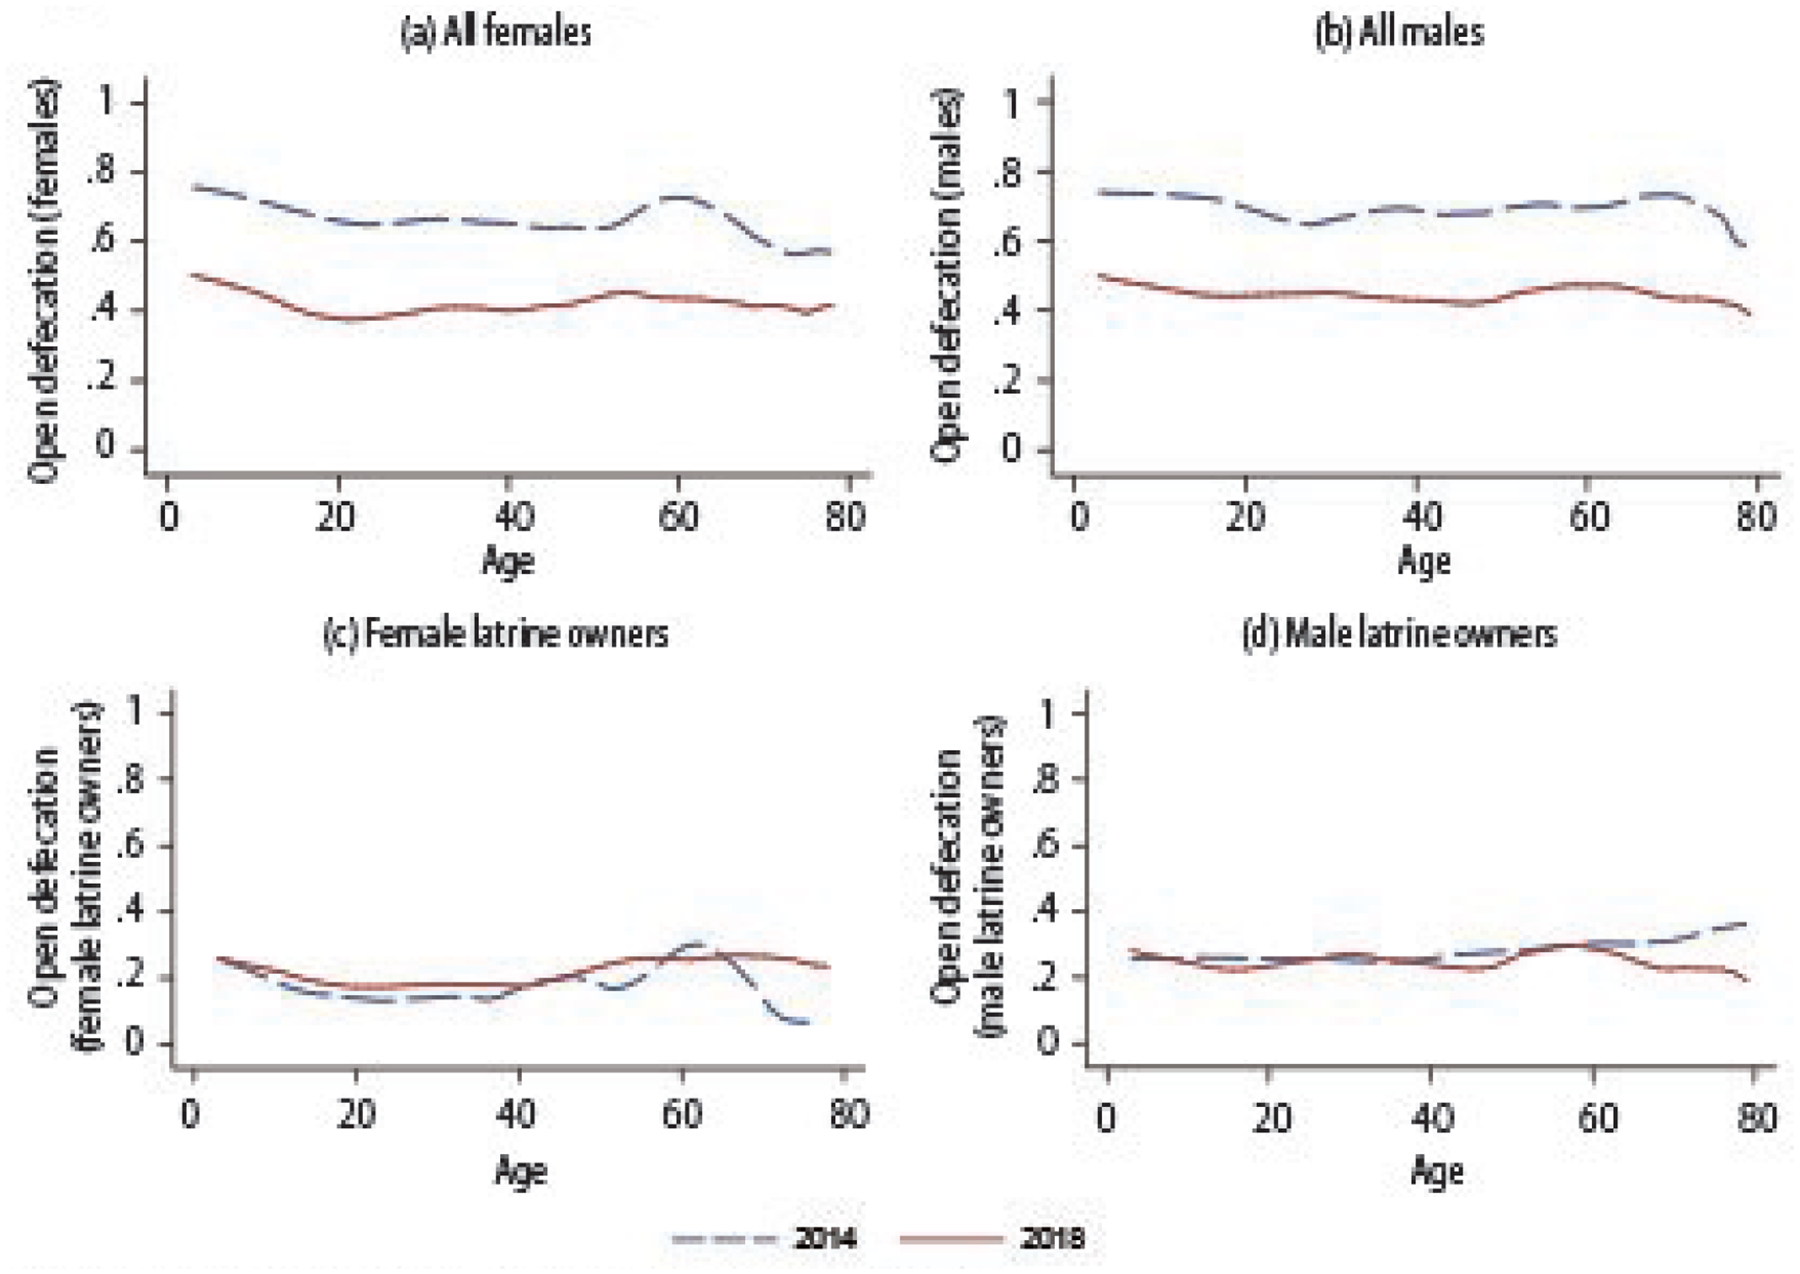
Open Defecation by Age and Sex
Computations in Figure 1 are weighted by the 2011 Census.
Data source: 2014 and 2018 rural sanitation surveys
Diverse Inputs, Diverse Outcomes
The SBM was a national campaign, but sanitation policy in India is implemented through state bureaucracies. Drawing upon the 2018 quantitative survey data and qualitative interviews, and the 2017 Accountability Initiative’s Udaipur survey, we discuss how SBM implementation differed across the focus states.
Variation in latrine construction: As we have discussed, the survey found large increases in latrine coverage in each of the focus states between 2014 and 2018. Yet, there was also considerable variation: Table 4 showed that increases in latrine ownership ranged from 21 percentage points in Bihar to 47 percentage points in MP and Rajasthan. Table 5 shows that government support for latrine construction, in the five years before the survey,11 ranged from 19% of households in Bihar to 53% of households in MP.12
Table 5:
Determinants of Choice of Credits Sources
| Variables | Coefficients | Marginal Effects | |||||
|---|---|---|---|---|---|---|---|
| Formal (F, I) | Informal (F, I) | Both (F, I) | No Credit (F, I) | Formal (F, I) | Informal (F, I) | Both (F, I) | |
| Age (ln) | −0.494* (0.269) | −1.052*** (0.297) | −0.472 (0.466) | 0.155*** (0.051) | −0.029 (0.036) | −0.125*** (0.037) | −0.001 (0.023) |
| Household size (ln) | 0.101 (0.151) | −0.005 (0.153) | −0.065 (0.232) | −0.008 (0.026) | 0.017 (0.022) | −0.004 (0.021) | −0.005 (0.012) |
| Other Backward Castes^ | 0.116 (0.174) | −0.367** (0.176) | −0.000 (0.282) | 0.021 (0.029) | 0.033 (0.026) | −0.058** (0.024) | 0.004 (0.014) |
| General castes^ | 0.542** (0.224) | −0.306 (0.255) | 0.101 (0.385) | −0.030 (0.040) | 0.095*** (0.033) | −0.067* (0.035) | 0.001 (0.019) |
| Education (years) (ln) | 0.417* (0.222) | −0.710*** (0.232) | −0.140 (0.369) | 0.025 (0.038) | 0.095*** (0.032) | −0.117*** (0.031) | −0.004 (0.019) |
| Possessing a social safety net card^ | 0.230 (0.171) | 0.499*** (0.193) | 0.317 (0.286) | −0.075** (0.029) | 0.011 (0.026) | 0.058** (0.027) | 0.006 (0.014) |
| Cultivable land (ha) (ln) | 0.859*** (0.757) | −0.193 (1.078) | 0.164*** (1.224) | −0.252 (0.154) | 0.444*** (0.105) | −0.330** (0.146) | 0.138** (0.059) |
| Awareness of loan waiver scheme^ | 0.770*** (0.208) | 0.292 (0.182) | 0.505 (0.347) | −0.116*** (0.032) | 0.101*** (0.031) | 0.005 (0.025) | 0.010 (0.018) |
| Direct cash transfer^ | 0.297* (0.172) | 0.206 (0.170) | 0.948*** (0.360) | −0.069** (0.028) | 0.023 (0.026) | 0.004 (0.024) | 0.042** (0.019) |
| Pradhan Mantri Fasal Bima Yojana^ | 0.187 (0.134) | −0.171 (0.141) | 0.058 (0.230) | −0.005 (0.023) | 0.035* (0.020) | −0.033* (0.019) | 0.003 (0.012) |
| Mahatma Gandhi National Rural Employment Guarantee Act^ | 0.269 (0.177) | 0.142 (0.183) | 0.600** (0.283) | −0.053* (0.030) | 0.027 (0.026) | 0.001 (0.025) | 0.025* (0.014) |
| Income from remittances^ | −0.317** (0.155) | 0.188 (0.148) | 0.151 (0.258) | 0.012 (0.025) | −0.060*** (0.023) | 0.037* (0.020) | 0.010 (0.013) |
| Have Jan Dhan Yojana account^ | 0.033 (0.135) | 0.406*** (0.135) | 0.481** (0.216) | −0.050** (0.023) | −0.019 (0.020) | 0.050*** (0.018) | 0.019* (0.011) |
| Have sought information from any source^ | 0.281*** (0.138) | 0.395*** (0.141) | 0.555** (0.221) | −0.076*** (0.023) | 0.020 (0.020) | 0.038** (0.019) | 0.019* (0.011) |
| Own livestock^ | 0.315* (0.177) | 0.195 (0.176) | −0.017 (0.292) | −0.049* (0.029) | 0.042 (0.026) | 0.016 (0.024) | −0.009 (0.015) |
| Distance to bank from village (in km) | 0.028 (0.043) | 0.049 (0.039) | −0.034 (0.060) | −0.006 (0.007) | 0.003 (0.006) | 0.006 (0.005) | −0.003 (0.003) |
| Constant | −9.002*** (2.129) | 6.723** (2.721) | −9.100*** (3.440) | ||||
| Block fixed effect | Yes | Yes | Yes | Yes | Yes | Yes | Yes |
| Observations | 1,940 | 1,940 | 1,940 | ||||
Circumflex (^) Indicates dummy variable.
Robust standard errors in parantheses,
p<0.01,
p<0.05,
p<0.1.
Source: IFPRI-ICAR credit survey.
Table 5 shows state-level differences in the proportion of newly constructed latrines that were constructed by the households themselves and subsidised by the government (“government money”) rather than built by a contractor (“government built”). In Rajasthan, households were almost exclusively subsidised for constructing their own latrines (including, in some cases, for latrines that existed before the SBM). In Bihar, MP, and UP, however, some households constructed their own latrines, while other households had latrines constructed for them by contractors hired by local government officials.
Whether a household built its own latrine or received a contractor-constructed latrine is of interest because contractor-constructed latrines are typically less well-constructed than latrines that households build for themselves. Both in the 2018 survey and in Accountability Initiative’s 2017 Udaipur survey, ST households were more likely than households from other groups to receive government constructed latrines rather than a subsidy to construct their own latrines.13 Latrines that households build for themselves are more likely to be used. Indeed, the 2018 survey found that people in households that received money to build their own latrine, rather than a government-constructed latrine, were almost 10 percentage points less likely to defecate in the open.
Table 5 also shows differences in the types of latrine pits that households own. A “twin pit” is recommended by the government because, if it is constructed and used properly, it allows faecal sludge management to be done safely, sustainably, and inexpensively without resorting to manual scavenging. The faeces in the first pit can be allowed to decompose while the other is in use. Decomposed faeces are less biologically hazardous than fresh faeces and can be safely emptied by hand. “Single pit” latrines cannot be emptied safely (unless the household builds a second pit) because the faecal sludge would not have time to decompose before the pit is emptied. “Containment chambers” are typically the most expensive type of pit to construct. Once full, they are typically emptied by a suction machine. This method of faecal sludge management is expensive and is done when faecal sludge is fresh. Because there are few sewage treatment plants in rural north India, sludge from containment chambers is typically disposed of unsafely.14
Panel C of Table 5 shows the fraction of latrines with different pit types among all households that own latrines; Panel D restricts the sample to households that received any form of government support to build a latrine in the five years before the survey. A common finding across states is that only a minority of latrine-owning households have a twin pit latrine. However, government-supported latrines were more likely to be twin pit latrines than latrines that were not government-supported.
Our qualitative interviews found that many local government officials were aware that twin pit latrines are recommended by the government, knew how they worked, and understood why they are better for health and sustainability than containment chambers. This should be considered an accomplishment of the programme. However, many local officials also admitted that households in their village either strongly preferred containment chambers or did not build twin pits in a way that would allow them to be emptied safely. In fact, among households that own twin pit latrines, 48% reported that both pits were in use at once, as the pits are connected to each other with a pipe. This modification to the twin pit design prevents faeces from decomposing before emptying, but permits households to have a subjectively “large” pit that takes more time to fill. Accountability Initiative’s 2017 Udaipur survey also found that that twin pits were unpopular. In that survey, only three households reported having constructed twin pit toilets.
Variation in personnel and payments: Different village-level officials were more likely to be involved in publicising the SBM in different states. In Bihar and UP, where SBM activities were ongoing at the time of the survey, swacchagrahis had been recruited. Swacchagrahis tried to convince people to build toilets and assisted with filing paperwork and geotagging for the release of subsidies. In MP and Rajasthan, where SBM activities had, for the most part, concluded by the time of the survey, swacchagrahis had not been hired. Rather, in these two states, it was common for block officials to ask panchayat officials to form “nigrani samitis” or “vigilance committees” consisting of the sarpanch, secretary, village health and nutrition workers (accredited social health activist and anganwadi workers), chowki-dars or other village officials. Nigrani samiti members were expected to explain the subsidy programme, convince people to build toilets, and stop and/or shame people who defecated in the open. Accountability Initiative’s 2017 study similarly found that, in Udaipur, the SBM was implemented through the existing front-line bureaucracy with little or no capacity augmentation. Contrary to the stated objective, samiti members often did not represent the local community, but instead operated as a downward extension of the government.
Different village-level officials were also involved in managing verification of latrine construction and applications for subsidies in different states. Whereas in Rajasthan, MP, and UP, sarpanches/pradhans and secretaries were relied upon for providing and processing the forms for latrine subsidies; in Bihar, this task fell primarily to ward members. Those officials whose signatures were required for applying for the latrine subsidy were often able to collect informal payments from households. Although we encountered instances of corruption in all states, it was most evident in Bihar, where a `2,000 bribe to the ward member was often required to secure a subsidy transfer.
In Bihar, MP, and Rajasthan, subsidy payments were almost uniformly made to beneficiary accounts; whereas in UP, pradhans and secretaries wrote checks to beneficiaries. In UP, these village officials had substantial discretion over which households received subsidy payments. When contractor latrines were built in UP, village officials could also pay contractors without routing funds through beneficiary accounts. In other states, when contractors built latrines, local officials typically collected the subsidy money from households after they received it in their bank accounts. In Bihar, local officials often mentioned a rule, which had been revoked a few months before the survey, that subsidies could not be disbursed in a particular ward until approximately 75% of households in that ward had constructed latrines. In their opinion, this rule made it very difficult to convince people to build latrines.
Commonalities in implementation across states: An important commonality in SBM implementation across states was that panchayat, block, and district level officials were far more actively engaged in SBM implementation than in the implementation of prior sanitation schemes. Village officials reported working long hours to publicise the subsidy and process forms in order to facilitate the construction of latrines. Table 5 shows that across the focus states 39% of all households, and 42% of households that did not own a latrine in 2014 received government support to construct a latrine in the five years before the survey. In 2014, many fewer households in these states—less than 10% reported having received government support for a latrine.15
This active engagement of government officials with the SBM typically stopped at latrine construction; it focused little on latrine use. Officials said the goal of the SBM was to make the village “open defecation free.” Despite the fact that the literal meaning of these words is quite different, officials explained that this phrase refers to latrine coverage in a village. Many elected leaders and village secretaries readily stated that block and district officials expected them to fill out the paperwork claiming ODF status when about 80% of the households owned latrines.
Across the states we studied, village officials were given tight deadlines for latrine construction that they often felt they could not reasonably meet. Our qualitative interviews, as well as results from Accountability Initiative’s 2017 Udaipur survey,16 suggest that rapid timelines for latrine construction imposed on local officials by block and district officials were part of the reason that coercion was such a widely used tool in SBM implementation.
What Are the Costs?
Coercion and threats: If sustained, the estimated reduction in open defecation of approximately 26 percentage points over four years of the SBM could imply important improvements for child health and economic prosperity. But it came at a social cost: coercion and threats by local officials were commonplace. Violence and bullying sometimes occurred, as documented by journalistic accounts (Indian Express 2017; Singhal 2017).
In the 2018 rural sanitation survey, we asked about three forms of coercion: whether people were prevented from defecating in the open or harassed while doing so, whether people lost or were threatened with the loss of public benefits (such as food rations),17 if they did not comply with the SBM, and whether people were fined or threatened with fines if they did not comply with the SBM.
We recognise that these forms of coercion vary both in how ethical they are, and in whether or not they can be lawfully used. For instance, local officials sometimes reported that they merely embarrassed people who defecated in the open by garlanding them (see Gupta et al 2019). In contrast, villagers sometimes reported guards with sticks being posted to chase people away from open defecation sites, or their legally entitled food rations being denied for not constructing a toilet. We also note that there was heterogeneity in what officials expected of villagers. In most places local officials threatened people who did not build latrines. However, in MP, and to some extent in UP, threats were also used to convince latrine owners to use them. We hope that the analysis we present here and the questions we raise will encourage others to analyse these tactics more carefully than we are able to, given the limited space of this paper. For each form of coercion, we ask whether it happened to the respondent’s household, and whether the respondent was aware of it happening in his or her village.
Table 6 estimates that more than half of the households in the focus states are aware of some form of coercion in their village. This coerciveness is at odds with the SBM’s claims that switching to latrine use occurred through a bottom-up “true people’s movement” (DD News 2017). Especially troubling is that about one in four households said that they had heard of government benefits being withdrawn from those that did not have latrines.
Table 6:
Survey Reports of Threats, Fines and Coercion
| (%) | ||||||
|---|---|---|---|---|---|---|
| Coercive State Action | Focus States | Bihar | Madhya Pradesh | Rajasthan | Uttar Pradesh | |
| Stopped from OD | Own household | 9 | 11 | 11 | 11 | 6 |
| Stopped from OD | Aware of in village | 47 | 40 | 67 | 54 | 42 |
| Benefits threatened | Own household | 5 | 3 | 9 | 13 | 3 |
| Benefits threatened | Aware of in village | 25 | 9 | 47 | 42 | 20 |
| Fine threatened | Own household | 2 | l | 6 | 1 | 2 |
| Fine threatened | Aware of in village | 26 | 14 | 47 | 25 | 28 |
| Any of these three | Own household | 12 | 12 | 17 | 19 | 9 |
| Any of these three | Aware of in village | 56 | 47 | 78 | 68 | 50 |
Weighted by 2011 Census.
Data source: 2018 rural sanitation survey.
Coercion followed familiar patterns of social disadvantage. Figure 2 shows that, both among latrine owners and among latrine non-owners, SC and ST households were more likely than households from other social groups to report that they personally experienced one of these three forms of coercion. Among households that own a latrine, SCs are over twice as likely as others to report that their own household received one of these three forms of coercion and STs were almost three times as likely.18 Moreover, these basic findings are unchanged if the sample is restricted only to households that did not own a latrine in 2014, so they cannot be explained away by the fact that SCs and STs are poorer than households from other backgrounds and, therefore, less likely to own latrines.
Figure 2:
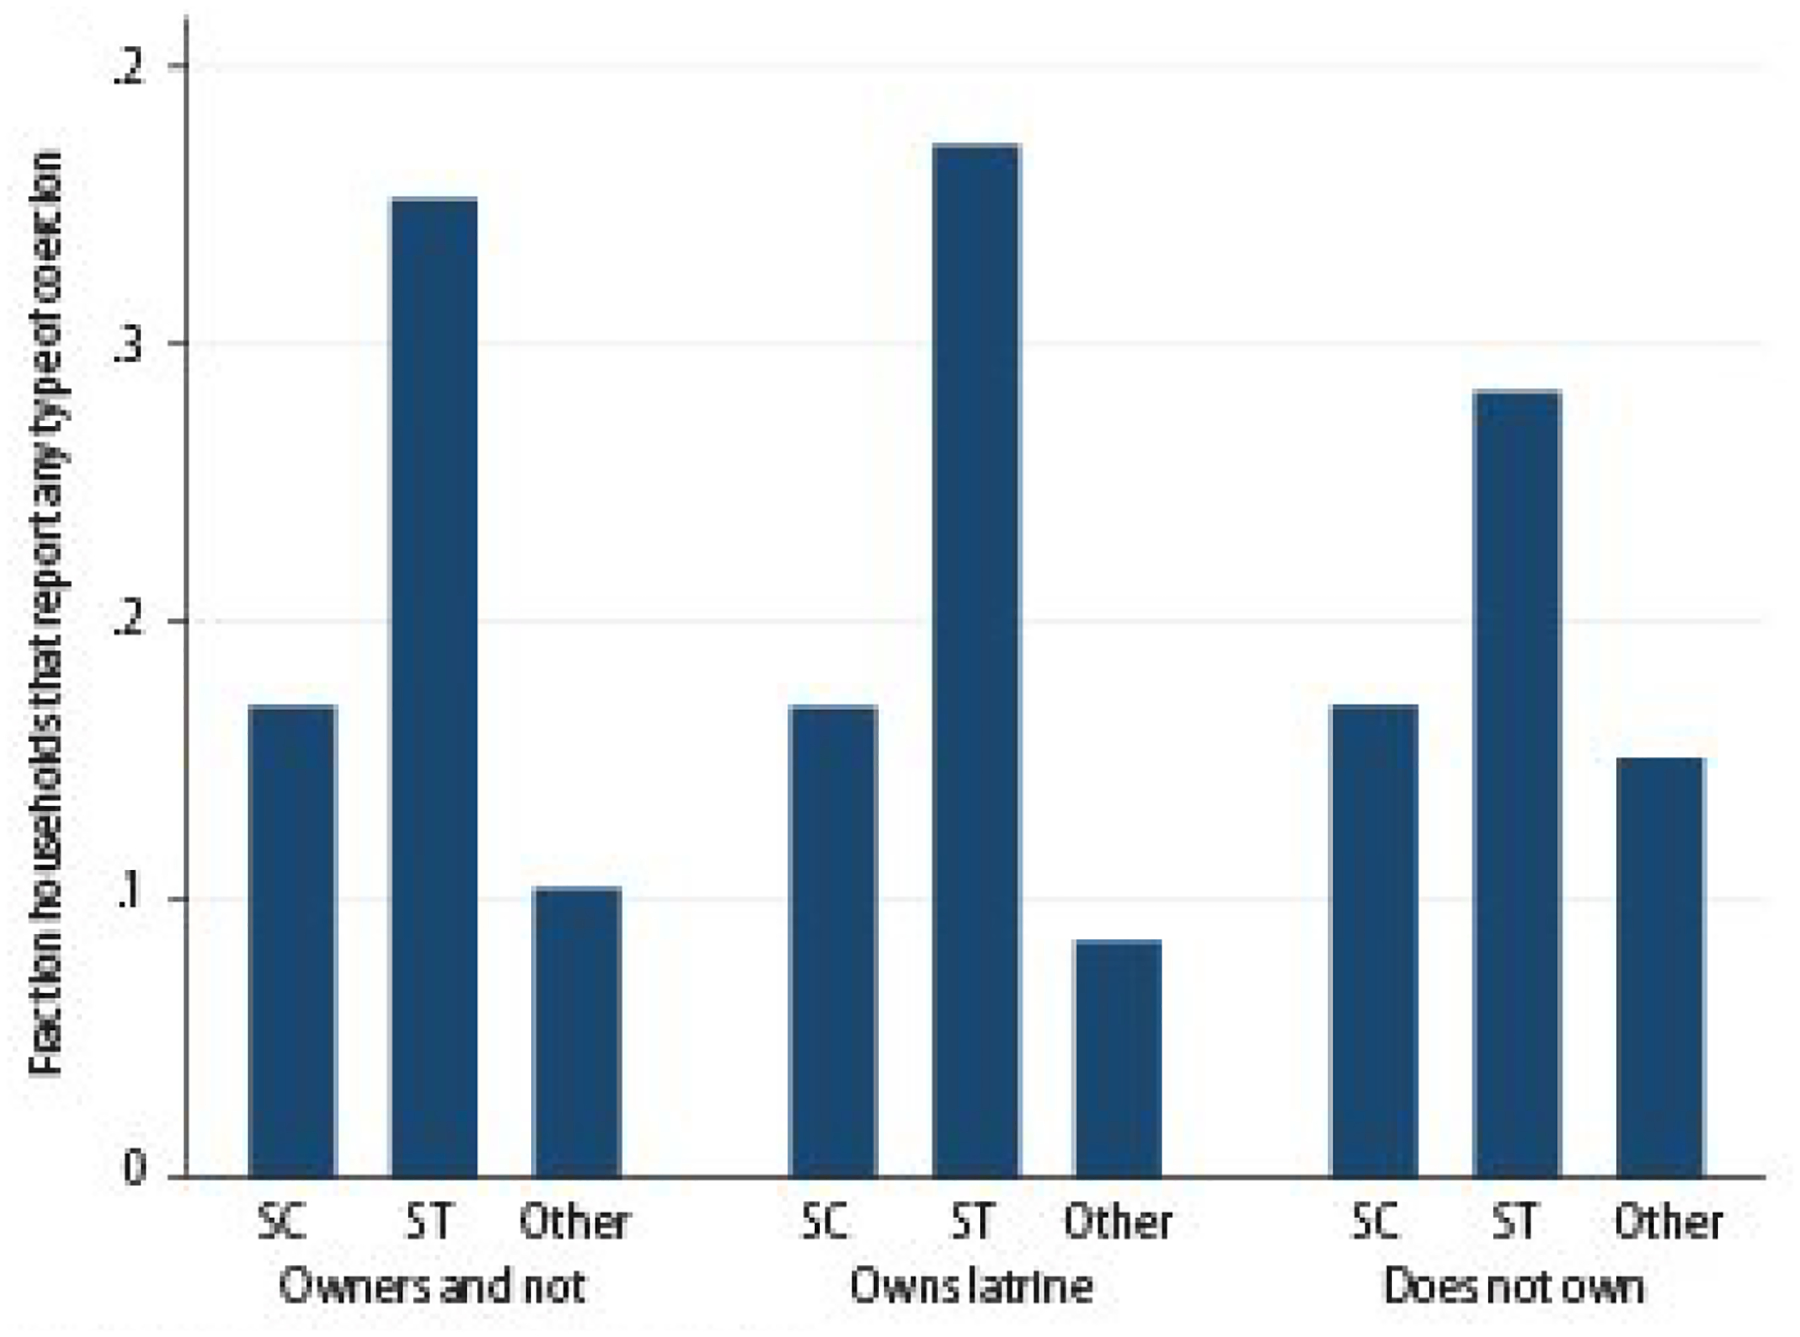
Households with Experience of SBM Coercion
Data source: 2018 rural sanitation survey.
In addition to variation within villages, the coerciveness of the SBM varied across villages. Figure 3 (p 62) shows that the village-level coerciveness of the SBM is an important predictor of latrine ownership (Panel [a]), and, through its effect on latrine ownership, of reported open defecation (Panel [b]). In both panels of Figure 3, observations are villages (the explanatory variable varies at the village level); villages are weighted by the sum of person-level weights from the 2011 Census. Latrine ownership (the vertical axis of Panel [a]) and open defecation (the vertical axis of Panel [b]) are representative of rural persons in the focus states.
Figure 3:
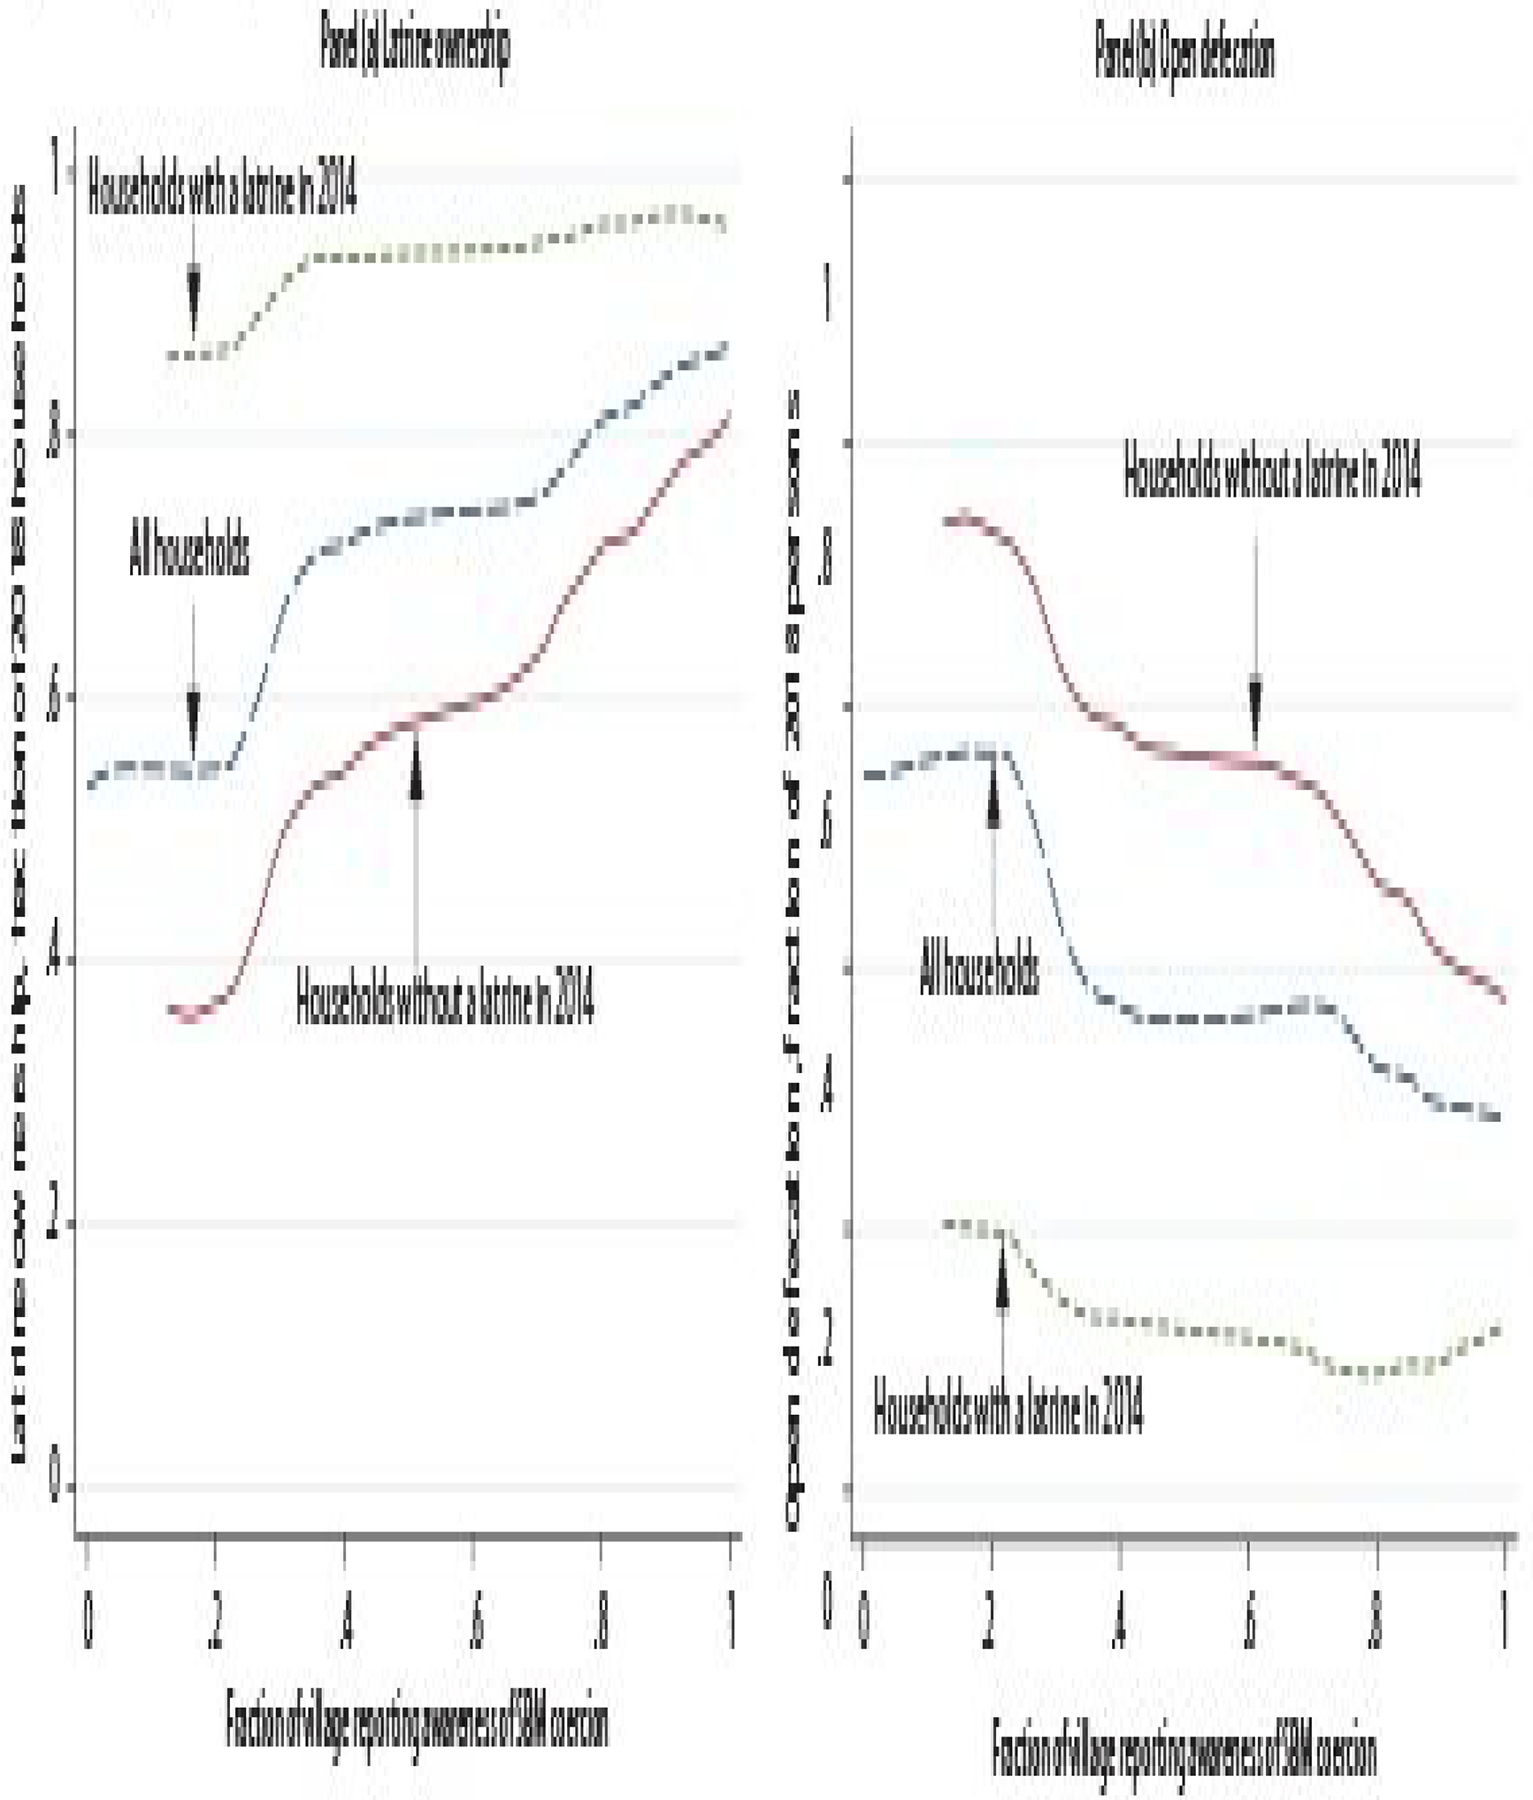
Village-level Reported SBM Coerciveness Strongly Predicts Sanitation Outcomes
Data source: 2014 and 2018 rural sanitation surveys.
Figure 3, combined with our qualitative interviews and with evidence from Accountability Initiative’s 2017 Udaipur study, provides strong evidence that coercion was central to what the SBM did in practice. Indeed, although many local SBM implementers said that they had been trained on talking points about benefits of latrine use, they were also familiar with a variety of coercion tactics, which were routinely shared and encouraged through meetings and WhatsApp groups. Very few local officials expressed the view that such tactics were inappropriate or extreme. These tactics, especially the denial of food and other government benefits, are different from community-led attempts to stop behaviours with social costs and to “nudge” people towards desirable behaviours. The qualitative interviews, combined with evidence from Accountability Initiative’s 2017 Udaipur study, suggest that the use of coercion and threats, rather than sustained persuasion and outreach, were relied upon heavily and that village officials were pressured by block, district, and state officials to achieve toilet construction targets in unreasonably short periods of time.
These findings raise uncertainty about whether latrine use among new latrine owners will be sustained when the environment of enforcement and coercion diminishes. Accountability Initiative’s 2017 Udaipur survey provides evidence that it may not. The survey, which was done many months after SBM implementation, found that only 45% of people in households where the primary reason for building a latrine was pressure from village officials used it, compared with about 80% latrine use among people in households where convenience or lack of open spaces was the primary cause for construction.
These findings suggest the need for transparent, fact-based public dialogue about the SBM: its costs and benefits, its accomplishments and means. Reducing open defecation offers a benefit for the health of children and others who would be otherwise exposed to faecal germs. Through improvements in health, reduction in open defecation will also likely improve long-run economic prosperity. Subsidised provision of latrines also benefit people who would like to use a latrine but who are not able to build one for themselves, especially older and disabled people (Coffey and Spears 2017). Yet, as we found, the SBM was coercive. Worse still, threats and sanctions were most likely to fall on ST and SC families. It also matters whether citizens can trust what the government claims. Finally, another cost is the opportunity cost. When officials were working on the SBM, they were not serving citizens in other ways. Of course, our data cannot fully resolve whether the benefits of the SBM were worth its costs. But we hope that our data can inform public debate on this question.
Sanitation in Rural North India
Open defecation is far more prevalent in rural India than in other, poorer countries. Factors such as ritual purity and the caste system realised in fears about latrine pits filling up and needing emptying combined with high population density to make open defecation a potent threat to health and well-being in rural India (Routray et al 2015; Coffey et al 2017).
The new survey data suggests that the SBM, unfortunately, did not focus on addressing these social attitudes and ideas about latrine pits. If it had, it may have achieved a more sustainable decline in open defecation, and may also have done a better job laying the groundwork for safe and sustainable faecal sludge management practices in the future. Figure 4 reveals that some of the most important social predictors of latrine use, documented in 2014, remain in 2018.
Figure 4:
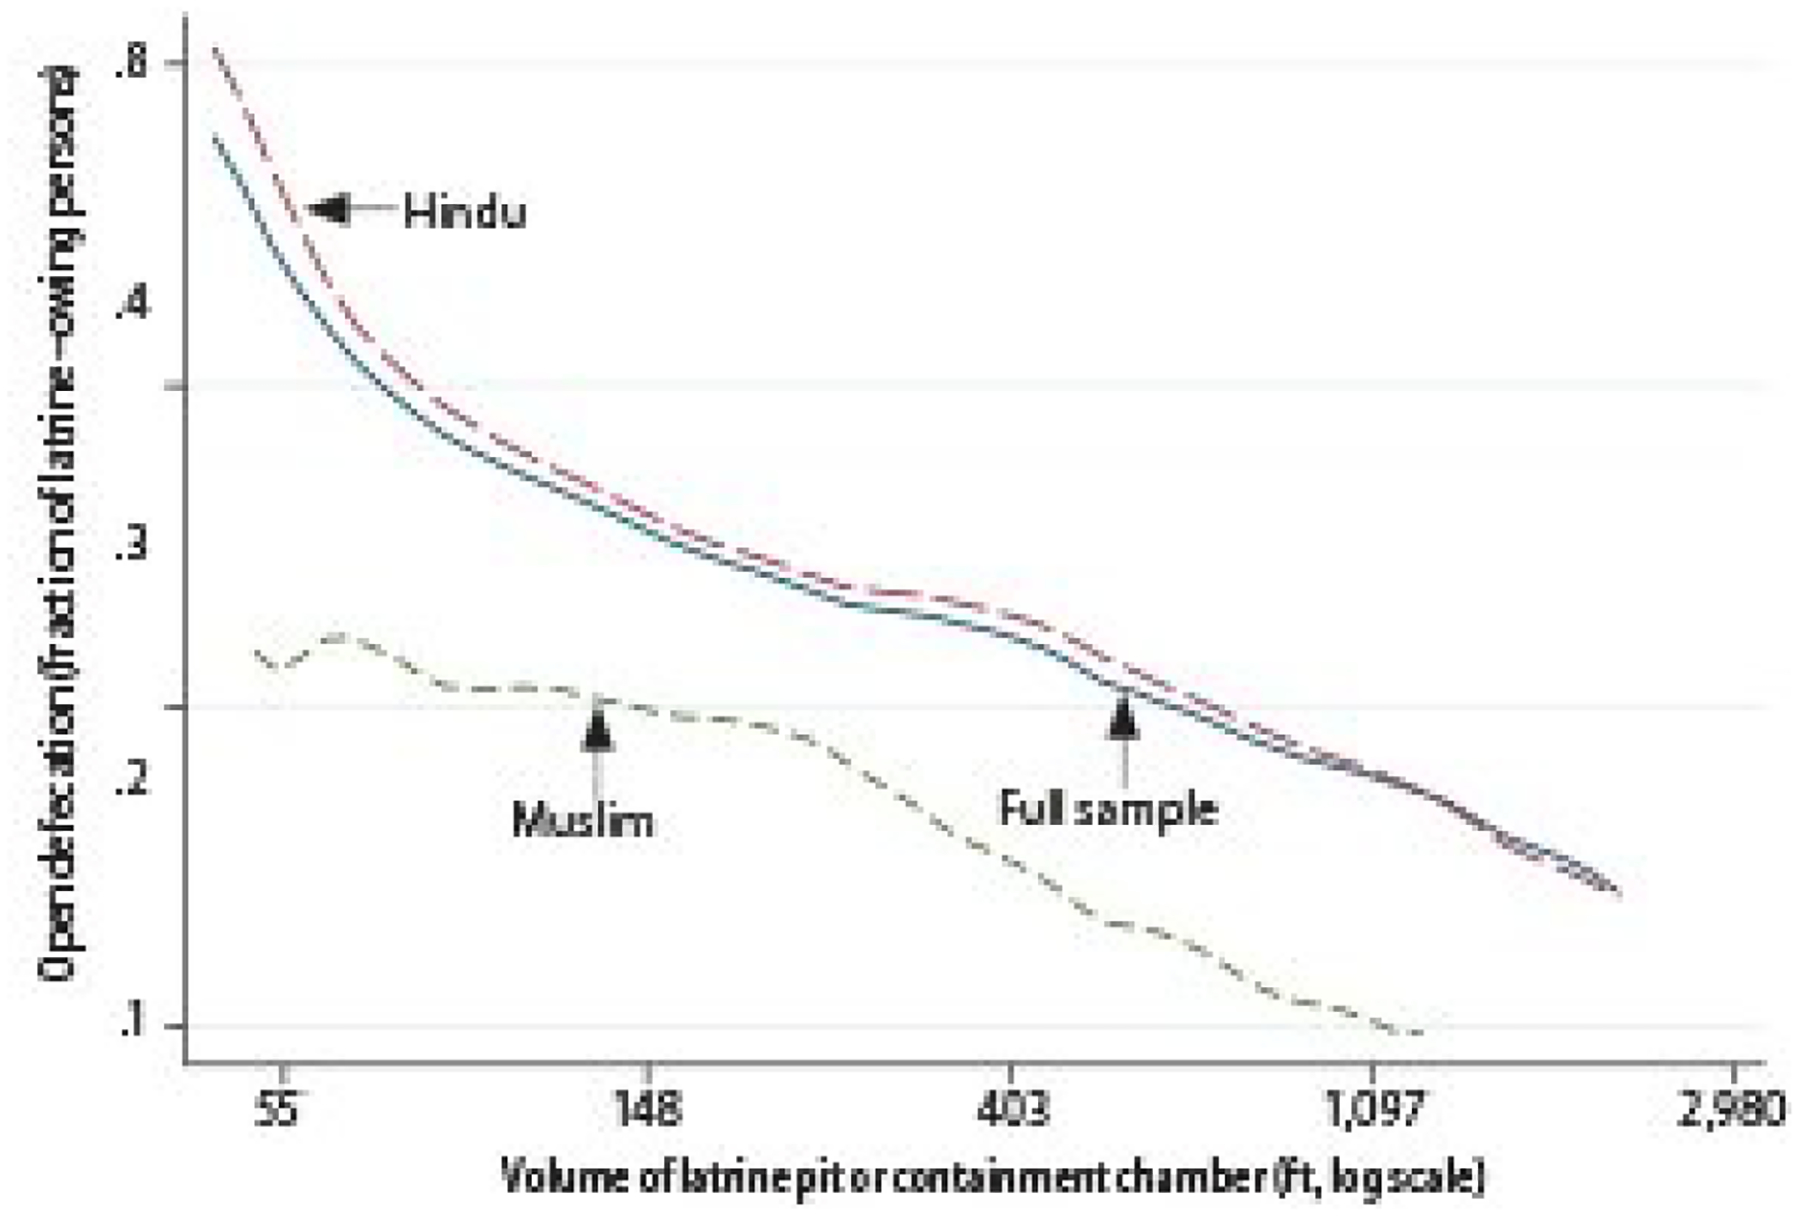
Open Defecation among Latrine Owners by P It Size and Religion, 2018
Data source: 2018 rural sanitation survey.
Figure 4 plots the prevalence of open defecation among latrine owners against the volume of their latrine pits or containment chamber. Households are split by religion: across the distribution, Hindus in latrine-owning households are more likely to defecate in the open than Muslims in latrine-owning households.19 It finds that open defecation is much less common in households with larger latrine pits, especially among Hindu households. One reason for this pattern is that smaller pits are perceived to require frequent emptying, an activity which is associated with caste impurity. Large pits, in contrast, do not require emptying as frequently, and therefore, their use does not invoke the same worries about contact with faeces or hiring a manual scavenger. Figure 4 replicates a graph that we first made using the 2014 data (see Coffey et al 2014). Efforts to convince people in villages to use more affordable latrines and manage faecal sludge disposal properly should be at the centre of the next rural sanitation policy.
Conclusions
Our 2018 survey documents that open defecation declined more rapidly over the past five years than it did before the SBM. This is because more latrines were built; latrine use among latrine owners is similarly common as it was five years ago. However, SBM latrine construction was far from universal in UP and Bihar, two states which, due to their population sizes, are quantitatively influential in determining India’s overall open defecation rate. Further, latrine construction was often accomplished through coercion. It remains to be seen whether latrine use achieved through coercion will be sustained.
Despite claims to the contrary, open defecation is still a pressing problem in rural India. The health of children is still threatened by the germs in the faeces around them, so it matters enormously what rural sanitation policies are tried next. A wide literature now documents the implications of social ideas of caste and untouchability for latrine-pit emptying and use. In our new data, we can see that well-studied predictors and patterns of latrine use that reflect these causes remain intact and that relatively few households have built the sorts of latrines that allow faecal sludge to be managed safely and sustainably.
The next rural sanitation policy for North India could choose a different course. To eliminate open defecation from rural India, coercive tactics should be stopped and latrine use should be encouraged alongside efforts to transform the social attitudes that have made open defecation so prevalent and challenging to address in the past.
Table 2:
Summary of Qualitative Interviews in Each State
| Bihar | Madhya Pradesh | Rajasthan | Uttar Pradesh | |
|---|---|---|---|---|
| Pradhan/sarpanch/mukhiya | 9 | 11 | 6 | 14 |
| Secretary/assistant secretary | 1 | 12 | 5 | 1 |
| Ward member | 15 | 0 | 1 | 0 |
| Health/nutrition worker | 2 | 9 | 6 | 2 |
| Ration dealer | 0 | 3 | 5 | 1 |
| Block official | 6 | 2 | 1 | 4 |
| Swacchagarhi | 5 | 0 | 0 | 7 |
| Chowkidar | 0 | 5 | 0 | 1 |
| Rozghar sevak | 0 | 0 | 1 | 4 |
| Other | 2 | 5 | 6 | 3 |
| Total | 40 | 47 | 32 | 37 |
Footnotes
There was also substantial variation in SBM implementation across districts within the same state.
We show subsequently that the proportion of people who defecate in the open changes little whether or not we use census weights on the Rajasthan sample. This suggests that our conclusions are not much affected by having a smaller sample for Rajasthan.
Where the 2014 study had covered all parts of the village, new households were sampled using a list of random numbers and a randomly selected 2014 household as a reference point.
https://riceinstitute.org/data/2014-and-2018-rural-sanitation-surveys/. STATA code that reproduces the results in this paper is available at the same link.
In order to capture people using public toilets or neighbours’ latrines, the 2018 rural sanitation survey asked people where they defecated whether nor not they owned a latrine. We note that public toilets are uncommon in rural India—we did not encounter any functioning public toilets in our fieldwork.
The fact that households in the NFHS-4 are asset-poorer than households in our sample suggests that we may have oversampled better-off households. If so, open defecation is probably more common in the full population than among sampled households. Another possible reason for the discrepancy may be because of differences in timing between the NFHS-4 (2015–16) and our sample (2018)—that is, wealth, electricity, and other dimensions of well-being improved over those 30 months—but given the magnitude of the difference it is likely that much of the discrepancy occurs due to oversampling better-off households.
The preface to the defecation behaviour questions was: “We have seen that some people use a latrine to defecate in, and some people like to defecate in the open. Now I want to ask you about where you and your family members defecate.” Then, for each individual in the household, the surveyor asked the following question: “Does ____ usually defecate in the open or use the latrine?”
Among households that were in the 2014 sample (that is, not considering refresher households), latrine ownership is 73%.
Bihar is an exception among these states. The sbm.gov.in dashboard reported “ODF Coverage” of Bihar at “47.70%” on 2 January 2019. Official claims do not always distinguish between open defecation behaviour (ODF stands for “open defecation free”) and latrine ownership. In the case of Lok Sabha Unstarred Question No 1818, where these are clearly distinguished, “Sanitation Coverage as on 17.12.2018” for Bihar is 90.75%, which is intended as a measure of households with latrines. Note that we find 49% household latrine ownership in Bihar. For MP, Rajasthan, and UP, sanitation coverage of “100.00” is claimed.
See the working paper version for technical details for this Kitagawa decomposition.
This includes money, materials, or government construction of a latrine.
According to the response to Lok Sabha Starred Question 236 (27 December 2018), expenditure on IHHLs from the central share in Bihar in FY 2018–19 (`2,608 crore) is almost three times as much as the money spent over the previous three fiscal years.
In fact, in Accountability Initiative’s 2017 Udaipur study, only one Accountability Initiative’s five ST households in villages visited by the survey received a monetary subsidy to construct a toilet.
See Coffey and Spears 2017 for more on latrine pits in North India.
This refers to latrines that were present at the time of the survey; it does not include latrines that households had received but did not report because they had been taken apart or become defunct.
As a part of the efforts to publicise SBM implementation in Udaipur and build momentum, 30 GPs were declared ODF in a period of 30 days.
Other examples include old age and widows’ pensions, MGNREGA work, Bhamashah entitlements (in Rajasthan), electricity, and other programmes that would require the cooperation of panchayat officials.
With standard errors appropriately clustered by village, these differences are statistically significant with a p-value of 0.04 for SCs and less than 0.001 for STs.
This pattern has also been documented elsewhere (Geruso and Spears 2018; Vyas and Spears 2018).
References
- Coffey D, Gupta A, Hathi P, Khurana N, Spears D, Srivastav N and Vyas S (2014): “Revealed Preference for Open Defecation,” Economic &Political Weekly, Vol 49, No 38, p 43. [Google Scholar]
- Coffey D, Gupta A, Hathi P, Spears D, Srivastav N and Vyas S (2017): “Understanding Open Defecation in Rural India: Untouchability, Pollution, and Latrine Pits,” Economic &Political Weekly, Vol 52, No 1, pp 59–66. [PMC free article] [PubMed] [Google Scholar]
- Coffey D and Spears D (2017): Where India Goes: Abandoned Toilets, Stunted Development and the Costs of Caste, India: Harper Collins. [Google Scholar]
- — (2018): “Open Defecation in Rural India, 2015–16: Levels and Trends in the NFHS-4,” Economic &Political Weekly, Vol 53, No 9, p 11. [Google Scholar]
- DD News (2017): “‘Swacch Bharat Abhiyan’ is Truly Becoming a People’s Movement: PM,” 11 April, http://ddnews.gov.in/national/swachh-bharat-abhiyan-truly-becoming-peopl.…
- Desai Sonalde, Vanneman Reeve and National Council of Applied Economic Research (2012): India Human Development Survey-II (IHDS-II), ICPSR36151-v2, Ann Arbor, MI: Inter-university Consortium for Political and Social Research; [distributor], 31 July 2015, 10.3886/ICPSR36151.v2. [DOI] [Google Scholar]
- Deshpande D and Kapur A (2018): Unpacking the Process of Achieving Open Defecation Free Status: A Case Study of Udaipur, Rajasthan, Research Report, Accountability Initiative, Centre for Policy Research. [Google Scholar]
- Geruso M and Spears D (2018): “Neighborhood Sanitation and Infant Mortality,” American Economic Journal: Applied Economics, Vol 10, No 2, pp 125–62. [DOI] [PMC free article] [PubMed] [Google Scholar]
- GoI, Ministry of Drinking Water and Sanitation (2018): “Lok Sabha Unstarred Question No 1818, To Be Answered on 20-12-2018: Allocations and Utilisations Under SBM-G,” Government of India, http://164.100.47.190/loksabhaquestions/annex/16/AU1818.pdf.
- Gupta A, Khalid N, Hathi P, Srivastav N, Vyas S and Coffey D (2019): “Coercion, Construction, and ‘ODF paper pe’: Swachh Bharat According to Local Officials,” India Forum, 5 April. [Google Scholar]
- Hathi P, Spears D and Coffey D (2016): “Can Collective Action Strategies Motivate Behaviour Change to Reduce Open Defecation in Rural India?” Waterlines, Vol 35, No 2, pp 118–35. [Google Scholar]
- Indian Express (2017): “No Coercion, Please,” Editorial Board, 27 September, https://indianexpress.com/article/opinion/editorials/swachh-bharat-missi.…
- Kitagawa E (1955): “Components of a Difference between Two Rates,” Journal of the American Statistical Association, Vol 50, No 272, pp 1168–94. [Google Scholar]
- Routray P, Schmidt WP, Boisson S, Clasen T and Jenkins MW (2015): “Socio-cultural and Behavioural Factors Constraining Latrine Adoption in Rural Coastal Odisha: An Exploratory Qualitative Study,” BMC Public Health, Vol 15, No 1, p 880. [DOI] [PMC free article] [PubMed] [Google Scholar]
- Singhal Akanksha (2017): “Coercive Measures under Swacch Bharat Mission Impinging on People’s Freedom,” Down to Earth, 20 June, https://www.downtoearth.org.in/news/governance/coercive-measures-under-s.…
- Vyas S and Spears D (2018): Sanitation and Religion in South Asia: What Accounts for Differences across Countries?” Journal of Development Studies, Vol 54, No 11, pp 2119–35. [DOI] [PMC free article] [PubMed] [Google Scholar]