Abstract
The main objectives of this study were to uncover the pathways used for methanogenesis in three different boreal peatland ecosystems and to describe the methanogenic populations involved. The mesotrophic fen had the lowest proportion of CH4 produced from H2-CO2. The oligotrophic fen was the most hydrogenotrophic, followed by the ombrotrophic bog. Each site was characterized by a specific group of methanogenic sequences belonging to Methanosaeta spp. (mesotrophic fen), rice cluster-I (oligotrophic fen), and fen cluster (ombrotrophic bog).
Northern peatlands are important emitters of the green house gas methane (CH4) produced by methanogenic archaea (3, 18, 30). Methanogens utilize a limited number of substrates, the most important of which are acetate and H2-CO2 (38). In peatlands, H2-CO2-dependent methanogenesis is thought to be the main pathway for CH4 production (20, 21, 26, 37), but in some minerotrophic peatlands (fens), acetoclastic methanogenesis is often predominant in upper peat layers (4, 23, 31). The diversity of methanogenic communities of fen (15, 17) and bog (2, 16, 35) ecosystems has recently been described, but data on the combined investigation of methanogenic pathways and methanogen populations are scarce. To the best of our knowledge, community studies have never been associated with the detection of methanogenic pathways in fen ecosystems, and only one study of an acidic bog ecosystem has been published (20). The aim of our study was to determine the precursors used for methanogenesis in three peatland ecosystems (a mesotrophic fen, an oligotrophic fen, and an ombrotrophic bog) and to describe the diversity of methane-producing archaea by using molecular methods that target the functional methyl coenzyme M reductase gene (mcrA).
Replicate samples from depths with the highest potential CH4 production rates were taken from a mesotrophic fen, an oligotrophic fen, and an ombrotrophic bog at the Lakkasuo mire complex in central Finland (61°48′N, 24°19′E) in August 2003. The fraction of CH4 produced from H2-CO2 was estimated at each site by a tracer experiment (8, 11) and by the inhibition of acetoclastic methanogenesis with CH3F (methyl fluoride) (6, 14, 22). The Gibbs free energy (ΔG) of H2-dependent methanogenesis was calculated (10, 12), and potential CH4 production was measured as described earlier (17). Fatty acids and alcohols dissolved in the pore water were analyzed by high-pressure liquid chromatography (25). All experiments were conducted on triplicate samples from each peat ecosystem. DNA was extracted directly from peat samples (17), and a portion of the methanogen-specific mcrA was amplified with the primer pair ML (28). Clone libraries were subjected to restriction fragment length polymorphism (RFLP) analysis with the restriction enzymes MspI and TaqI, and representatives of the biggest RFLP groups were sequenced for phylogenetic analysis.
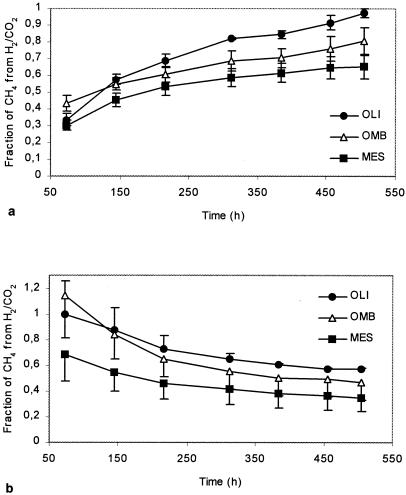
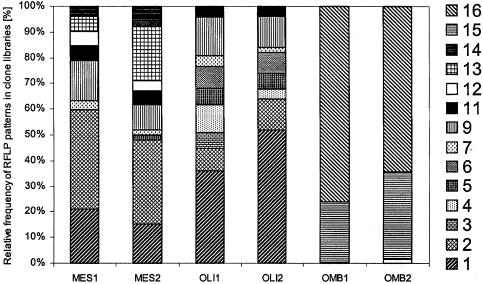
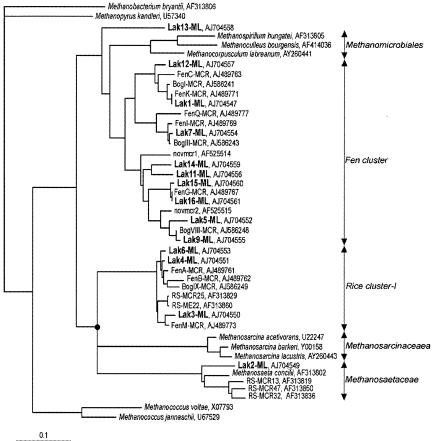
The contributions of H2-CO2-dependent methanogenesis to total CH4 production varied clearly among the three peatland ecosystems (Fig. 1). The mesotrophic fen had the lowest proportion of CH4 formed from H2-CO2. Since H2-CO2 and acetate are the main precursors for methanogenesis in wetlands (7, 38), the fraction of CH4 which is not produced from H2-CO2 predominantly results from acetoclastic methanogenesis. Acetotrophy has been described previously as an important pathway for CH4 formation in nutrient-rich fens (23) and in fens covered with Carex sedges (4, 31). Vascular plants, primarily sedges such as Carex spp. and Eriophorum spp., were the dominant field layer vegetation at the Lakkasuo mesotrophic fen site. Vascular plant species, as an adaptation to wetland conditions, develop a cortical oxygen-transporting gas space (aerenchyma), which transports oxygen (O2) to the roots situated in O2-depleted layers of soil (1, 24). The root systems of vascular plants tend to be less shallow than those of nonaerenchymatous peatland plants. Thus, the roots of vascular plants penetrate into anoxic layers and allow the entrance of potential carbon substrates, like acetate, into the deeper peat layers (29). The presence of vascular plants in peatland ecosystems has been suggested to favor acetoclastic methanogenesis by providing acetate to the anaerobic peat layers. Strom et al. (34), for example, pointed out that acetate is the main labile carbon exudation from the roots of the sedge Eriophorum scheuchzeri in an arctic wetland; consequently, acetoclastic methanogenesis is the dominant reaction in the vicinity of that sedge. Interestingly, our phylogenetic analysis showed that the mcrA clone libraries of the mesotrophic fen were dominated by RFLP group 2 (Fig. 2), which had the closest similarity to obligate acetotrophic methanogens of the family Methanosaetaceae, order Methanosarcinales (Fig. 3). Sequences from the family Methanosarcinaceae were not detected in the mesotrophic fen; rather, the acetotrophic methanogen sequences belonged exclusively to Methanosaeta spp. The low concentration of acetate in the mesotrophic peat (≤0.65 mM) probably favors Methanosaeta spp., which have a lower threshold for acetate than other acetotrophs belonging to the family Methanosarcinaceae. In ecosystems where acetate concentrations are high, Methanosaeta spp. are outcompeted by Methanosarcina spp. (5, 13, 36). The mesotrophic site had, by far, the highest rates of CH4 production (Table 1). Nutrient-rich peat at the site promotes vegetation growth; consequently, decomposition of organic matter and exudates from plant roots increase the quantity of carbon substrates available for methanogenesis.
FIG. 1.
Fraction of CH4 produced from H2-CO2 in mesotrophic (MES), oligotrophic (OLI), and ombrotrophic (OMB) peatlands as determined by tracer (a) and inhibition (b) experiment. Data are means of results of triplicate experiments ± standard errors.
FIG. 2.
Methanogen community structure in upper layers of mesotrophic (MES), oligotrophic (OLI), and ombrotrophic (OMB) peatland soils. Communities are represented by the relative abundances of RFLP patterns in mcrA clone libraries. Two replicate peat samples (1 and 2) were analyzed at each site.
FIG. 3.
Phylogenetic dendrogram representing 137-amino-acid-long mcrA sequences retrieved from three different boreal peatlands (boldface) in relation to other sequences of methanogenic archaea. The number in the sequence name corresponds to the RFLP pattern. The tree was constructed using FITCH distance matrix analysis. The full circle indicates a manually adjusted consensus trifurcation. GenBank accession numbers are indicated for all sequences. Methanopyrus kandleri was used as outgroup. The scale bar represents 10% sequence divergence.
TABLE 1.
Water table depths, peat pHs, average potential CH4 production, and ΔG values for H2-dependent methanogenesis calculated for oligotrophic, mesotrophic, and ombrotrophic peatland sites
| Peatland type | Water table depth (cm) | Pore water pH (SE) | Potential CH4 productiona (nmol g [dry wt]−1 h−1) (SE) | ΔG (kJ mol−1) (SE) (nmol g [dry wt]−1 h−1) |
|---|---|---|---|---|
| Mesotrophic | 0 | 5.27 (0.13) | 209.73 (76.65) | −26.7 (1.9) |
| Oligotrophic | 33 | 5.16 (0.05) | 14.88 (3.63) | −15.7 (1) |
| Ombrotrophic | 25 | 3.89 (0.19) | 39.93 (13.37) | −17.2 (1.4) |
Three parallel peat profiles were taken at each site; CH4 production was calculated from control samples from inhibition experiment and from tracer experiment samples incubated at 10°C.
In contrast, the oligotrophic fen had low potential CH4 production (Table 1), and a high fraction of CH4 was produced from H2-CO2 (Fig. 1). The site is nutrient poor, the concentration of fatty acids in peat pore water is low (<0.07 [±0.02] mM), and few vascular plants are present. Little labile carbon from plant exudates is introduced to the anaerobic layers of the peat, and recalcitrant old peat is the main carbon source for methanogenesis. In natural environments, most of the H2 used by hydrogenotrophs for CO2 reduction is obtained directly from syntrophic bacteria by interspecies transfer (8, 9, 19). This process results in a low partial pressure of H2, which is necessary for the metabolism of syntrophs (32). The partial pressure of H2 in the gas phase of the incubated oligotrophic peat samples was low (result not shown). This result provides additional evidence of the predominance of H2-CO2-dependent methanogenesis at the site. RFLP groups 3, 4, and 6 were found exclusively in the oligotrophic clone libraries (Fig. 2) and the corresponding sequences grouped with rice cluster-I (Fig. 3). Members of rice cluster-I were selectively enriched earlier with H2-CO2 as the energy source (27, 33), indicating that the group includes hydrogenotrophs. One of the sequences (Lak1) dominating the oligotrophic clone libraries belonged, however, to fen cluster-III; the function of that subcluster remains unknown (17).
The ombrotrophic bog also had a high proportion of CH4 production that originated from H2-CO2 (Fig. 1). This result is consistent with earlier findings, which showed hydrogenotrophy to be the dominant reaction in bogs (4, 20, 26). The characteristic vegetation cover of the ombrotrophic bog can explain the small proportion of acetotrophic methanogenesis at the site. The plant species covering the Lakkasuo bog are almost exclusively Sphagnum mosses. Sphagnum-dominated bogs have been identified previously as peatlands where CO2 reduction is an important pathway (23). Mosses have a shallow rhizoid system and lack aerenchyma; as a result, they do not introduce any labile carbon substrates to anaerobic peat layers. The methanogenic community at the bog site differed significantly from the communities characteristic of fen ecosystems. The methanogen diversity at the bog site was extremely low; only two RFLP groups dominated all libraries (RFLP groups 15 and 16) (Fig. 2), and their corresponding sequences belonged to a cluster named fen cluster-IV (17) (Fig. 3). Previous studies of bog methanogen communities have revealed higher methanogen diversity and have detected sequences belonging to the orders Methanomicrobiales, Methanobacteriales, and Methanosarcinales (2, 20, 35). The low diversity observed at the Lakkasuo bog may be induced by the specific characteristics of the peat at the site. The peat pH, for example, was much lower at Lakkasuo (pH <4) (Table 1) than at other bogs studied (2, 20), which may be a factor in the selection of populations that are dominated by acid-tolerant methanogens. Further experiments should be conducted with ombrotrophic bogs in order to confirm the observed low diversity and to define possible selection factors.
Nucleotide sequence accession numbers.
The mcrA sequences obtained in this study were deposited in the EMBL database under accession no. AJ704547 to AJ704561.
Acknowledgments
We thank Eeva-Stiina Tuittila and Jukka Laine (Forest Ecology, Helsinki, Finland) for their advice and support while samples were being taken and Melanie Klose (MPI Marburg) for giving technical instructions during the tracer and inhibition experiments.
This work was funded by the Finnish Academy and by a FEMS fellowship.
REFERENCES
- 1.Armstrong, W., S. H. F. W. Justin, P. M. Beckett, and S. Lythe. 1991. Root adaptation to soil waterlogging. Aquat. Bot. 39:57-73. [Google Scholar]
- 2.Basiliko, N., J. B. Yavitt, P. M. Dees, and S. M. Merkel. 2003. Methane biogeochemistry and methanogen communities in two northern peatland ecosystems, New York State. Geomicrobiol. J. 20:563-577. [Google Scholar]
- 3.Cao, M., S. Marshall, and K. Gregson. 1996. Global carbon exchange and methane emissions from natural wetlands: application of a process-based model. J. Geophys. Res. 101:14399-14414. [Google Scholar]
- 4.Chasar, L. S., J. P. Chanton, P. H. Glaser, D. I. Siegel, and J. S. Rivers. 2000. Radiocarbon and stable carbon isotopic evidence for transport and transformation of dissolved organic carbon, dissolved inorganic carbon, and CH4 in a northern Minnesota peatland. Global Biogeochem. Cycles 14:1095-1108. [Google Scholar]
- 5.Chin, K.-J., T. Lueders, M. W. Friedrich, M. Klose, and R. Conrad. 2004. Archaeal community structure and pathway of methane formation on rice roots. Microb. Ecol. 47:59-67. [DOI] [PubMed] [Google Scholar]
- 6.Chin, K.-J., and R. Conrad. 1995. Intermediary metabolism in methanogenic paddy soil and the influence of temperature. FEMS Microbiol. Ecol. 18:85-102. [Google Scholar]
- 7.Conrad, R. 1999. Contribution of hydrogen to methane production and control of hydrogen concentrations in methanogenic soils and sediments. FEMS Microbiol. Ecol. 28:193-202. [Google Scholar]
- 8.Conrad, R., H. P. Mayer, and M. Wust. 1989. Temporal change of gas metabolism by hydrogen-syntrophic methanogenic bacterial association in anoxic paddy soil. FEMS Microbiol. Ecol. 62:265-274. [Google Scholar]
- 9.Conrad, R., T. J. Phelps, and J. G. Zeikus. 1985. Gas metabolism evidence in support of the juxtaposition of hydrogen-producing and methanogenic bacteria in sewage sludge and lake sediments. Appl. Environ. Microbiol. 50:595-601. [DOI] [PMC free article] [PubMed] [Google Scholar]
- 10.Conrad, R., B. Schink, and T. J. Phelps. 1986. Thermodynamics of H2-producing and H2-consuming metabolic reactions in diverse methanogenic environments under in situ conditions. FEMS Microbiol. Ecol. 38:353-360.
- 11.Conrad, R., and H. Schutz. 1988. Methods of studying methanogenic activities in aquatic environments, p. 301-343. In B. Austin (ed.), Methods in aquatic bacteriology. Wiley, Chichester, United Kingdom.
- 12.Conrad, R., and B. Wetter. 1990. Influence of temperature on energetics of hydrogen metabolism in homoacetogenic, methanogenic, and other anaerobic bacteria. Arch. Microbiol. 155:94-98. [Google Scholar]
- 13.Fey, A., and R. Conrad. 2000. Effect of temperature on carbon and electron flow and on the archaeal community in methanogenic rice field soil. Appl. Environ. Microbiol. 66:4790-4797. [DOI] [PMC free article] [PubMed] [Google Scholar]
- 14.Frenzel, P., and U. Bosse. 1996. Methyl fluoride, an inhibitor of methane oxidation and methane production. FEMS Microbiol. Ecol. 21:25-36. [Google Scholar]
- 15.Galand, P. E., H. Fritze, and K. Yrjälä. 2003. Microsite-dependent changes in methanogenic populations in a boreal oligotrophic fen. Environ. Microbiol. 5:1133-1143. [DOI] [PubMed] [Google Scholar]
- 16.Galand, P. E., H. Juottonen, H. Fritze, and K. Yrjälä. Methanogen communities in a drained bog: effect of ash fertilization. Microb. Ecol., in press. [DOI] [PubMed]
- 17.Galand, P. E., S. Saarnio, H. Fritze, and K. Yrjälä. 2002. Depth related diversity of methanogen Archaea in Finnish oligotrophic fen. FEMS Microbiol. Ecol. 42:441-449. [DOI] [PubMed] [Google Scholar]
- 18.Harris, R. 1993. Methane emissions from northern high-latitude wetlands, p. 449-486. In R. S. Oremlands (ed.), Biochemistry of global change: radiatively active trace gases. Chapman & Hall, New York, N.Y.
- 19.Hoehler, T. M., M. J. Alperin, D. B. Albert, and C. S. Martens. 2001. Apparent minimum free energy requirements for methanogenic Archaea and sulfate-reducing bacteria in an anoxic marine sediment. FEMS Microbiol. Ecol. 38:33-41. [Google Scholar]
- 20.Horn, M. A., C. Matthies, K. Küsel, A. Schramm, and H. L. Drake. 2003. Hydrogenotrophic methanogenesis by moderately acid-tolerant methanogens of a methane-emitting acidic peat. Appl. Environ. Microbiol. 69:74-83. [DOI] [PMC free article] [PubMed] [Google Scholar]
- 21.Hornibrook, E. R. C., F. J. Longstaffe, and W. S. Fyfe. 1997. Spatial distribution of microbial methane production pathways in temperate zone wetland soils: stable carbon and hydrogen isotope evidence. Geochim. Cosmochim. Acta 61:745-753. [Google Scholar]
- 22.Janssen, P., and P. Frenzel. 1997. Inhibition of methanogenesis by methyl fluoride: studies of pure and defined mixed cultures of anaerobic bacteria and archaea. Appl. Environ. Microbiol. 63:4552-4557. [DOI] [PMC free article] [PubMed] [Google Scholar]
- 23.Kelley, C. A., N. B. Dise, and C. S. Martens. 1992. Temporal variations in the stable carbon isotopic composition of methane emitted from Minnesota peatlands. Global Biogeochem. Cycles 6:263-269. [Google Scholar]
- 24.Koncalova, H. 1990. Anatomical adaptations to waterlogging in roots of wetland graminoids: limitations and drawbacks. Aquat. Bot. 38:127-134. [Google Scholar]
- 25.Krumboeck, M., and R. Conrad. 1991. Metabolism of position-labelled glucose in anoxic methanogenic paddy soil and lake sediment. FEMS Microbiol. Ecol. 85:247-256. [Google Scholar]
- 26.Lansdown, J. M., P. D. Quay, and S. L. King. 1992. CH4 production via CO2 reduction in a temperate bog: a source of 13-C-depleted CH4. Geochim. Cosmochim. Acta 56:3493-3503. [Google Scholar]
- 27.Lueders, T., K. J. Chin, R. Conrad, and M. Friedrich. 2001. Molecular analyses of methyl-coenzyme M reductase alpha-subunit (mcrA) genes in rice field soil and enrichment cultures reveal the methanogenic phenotype of a novel archaeal lineage. Environ. Microbiol. 3:194-204. [DOI] [PubMed] [Google Scholar]
- 28.Luton, P. E., J. M. Wayne, R. J. Sharp, and P. W. Riley. 2002. The mcrA gene as an alternative to 16S rRNA in the phylogenetic analysis of methanogen populations in landfill. Microbiology 148:3521-3530. [DOI] [PubMed] [Google Scholar]
- 29.Malmer, N., B. M. Svensson, and B. Wallen. 1994. Interactions between Sphagnum mosses and field layer vascular plants in the development of peat-forming systems. Folia Geobot. Phytotaxon. 29:483-496. [Google Scholar]
- 30.Matthews, E., and I. Fung. 1987. Methane emissions from natural wetlands: global distribution, area and environmental characteristics of sources. Global Biogeochem. Cycles 1:61-86. [Google Scholar]
- 31.Popp, T. J., and J. P. Chanton. 1999. Methane stable isotope distribution at a Carex dominated fen in north central Alberta. Global Biogeochem. Cycles 13:1063-1077. [Google Scholar]
- 32.Schink, B. 1997. Energetics of syntrophic cooperation in methanogenic degradation. Microbiol. Mol. Biol. Rev. 61:262-280. [DOI] [PMC free article] [PubMed] [Google Scholar]
- 33.Sizova, M. V., N. S. Panikov, T. P. Tourova, and P. W. Flanagan. 2003. Isolation and characterization of oligotrophic acido-tolerant methanogenic consortia from a Sphagnum peat bog. FEMS Microbiol. Ecol. 45:301-315. [DOI] [PubMed] [Google Scholar]
- 34.Strom, L., A. Ekberg, M. Mastepanov, and T. B. Christensen. 2003. The effect of vascular plants on carbon turnover and methane emissions from a tundra wetland. Global Change Biol. 9:1185-1192. [Google Scholar]
- 35.Upton, M., B. Hill, C. Edwards, J. R. Saunders, D. A. Ritchie, and D. Lloyd. 2000. Combined molecular ecological and confocal laser scanning microscopic analysis of peat bog methanogen populations. FEMS Microbiol. Lett. 193:275-281. [DOI] [PubMed] [Google Scholar]
- 36.Weber, S., T. Lueders, M. W. Friedrich, and R. Conrad. 2001. Methanogenic populations involved in the degradation of rice straw in anoxic paddy soil. FEMS Microbiol. Ecol. 38:11-20. [Google Scholar]
- 37.Whiticar, M. J., E. Faber, and M. Schoell. 1986. Biogenic methane formation in marine and freshwater environments: CO2 reduction versus acetate fermentation-isotope evidence. Geochim. Cosmochim. Acta 50:693-709. [Google Scholar]
- 38.Zinder, S. H. 1993. Physiological ecology of methanogens, p. 128-206. In J. G. Ferry (ed.), Methanogenesis: ecology, physiology, biochemistry and genetics. Chapman & Hall, New York, N.Y.


