Abstract
Transcription of the nirK and nirS genes coding for dissimilatory bacterial nitrite reductases was analyzed by reverse transcription PCR (RT-PCR) of mRNA isolated from rhizosphere samples of three economically important grain legumes at maturity: Vicia faba, Lupinus albus, and Pisum sativum. The nirK gene and transcripts could be detected in all the rhizosphere samples. In contrast, nirS could not be detected. Sampling variations were analyzed by comparing denaturing gradient gel electrophoresis profiles derived from nirK RT-PCR products. High similarity was observed between the replicates, and so one representative product per legume was cloned. Clones with the correct insert size were screened by restriction fragment length polymorphism by using the restriction enzyme MspI. The clones could be distributed into 12 different patterns. Patterns 1, 3, 4, 5, and 7 were common in clone libraries of the three rhizosphere types under study. Patterns 2, 9, 10, and 11 were absent from Pisum rhizospheres, while patterns 6, 8, and 12 were absent from the Vicia library. Pattern 1, which was the most dominant in the Vicia and Lupinus libraries, constituted about 25% of all clones. The Lupinus library had clones representing all 12 patterns, indicating it to be the most diverse among the three. Clones representative of each pattern were sequenced. All patterns grouped together forming a distinct cluster, which was divergent from previously described nirK sequences in the database. The study revealed a hitherto unknown diversity of denitrifiers in legume rhizospheres. A plant-dependent rhizosphere effect on the transcripts of a gene was evident.
Legumes in agriculture contribute substantially to the overall N economy of the soil by sequestering atmospheric N through symbiotic N2-fixation and through subsoil N retrieval (13). This is important mainly in legume crop rotations in sequential cropping practices that rely on fast-growing fallow species that are capable of accumulating large amounts of foliage rich in N (11, 12). In addition to food value, the legumes Vicia faba, Lupinus albus, and Pisum sativum are used extensively as green manure in Central Europe in organic farming. In a study by Mayer et al. (17) considerable differences, both in quantity and quality, among the N rhizodeposits of these three legumes were reported. In such a nitrogen-enriching system, it is important to study how differences in rhizodeposition could affect the underlying denitrifying bacterial community.
Biological denitrification is a respiratory process defined as the enzymatic, stepwise reduction of the nitrogen oxides associated with electron transport phosphorylation and evolution of the gases nitric oxide (NO), nitrous oxide (N2O), and molecular nitrogen (N2). These end products are concomitantly released, leading to a loss to the environment of fixed nitrogen (3). Furthermore, the accumulation of the intermediates NO and N2O contributes to global warming and the destruction of the stratospheric ozone layer (8). NO and N2O fluxes between soil and atmosphere result from complex and little-understood microbial activities that proceed simultaneously in soil. Thus, the underlying communities of denitrifying bacteria and their responses to environmental conditions need to be studied in detail. Analyzing the process of denitrification in a system, e.g., the rhizosphere of a grain legume, that is known to enrich soil by fixing nitrogen is, therefore, highly relevant.
Denitrifying bacteria are phylogenetically diverse. Defined as a physiological group, these facultative anaerobes can switch from oxygen to nitrogen oxides as terminal electron acceptors when kept under anoxic conditions. The reduction of nitrite to nitric oxide by nitrite reductase is the first step that distinguishes denitrifiers from nitrate-respiring bacteria, which do not reduce nitrite to gas. Nitrite reductase is one of the key enzymes in the dissimilatory denitrification process. Two structurally different nitrite reductases are found among denitrifiers (35): one contains copper (Cu-Nir) encoded by the nirK gene, and the other contains heme c and heme d1 (cd1-Nir) encoded by the nirS gene. The two genes seem to occur mutually exclusively in a given strain, but both types have been found in different strains of the same species (9). No functionally significant differences between the two nitrite reductases have been reported.
Detection of mRNAs, which typically have short half-lives, provides a strong indication of specific gene expression at the time of sampling (25). More recently, in a number of studies, workers have used reverse transcription PCR (RT-PCR) approaches to investigate gene expression in a variety of environments, including expression of nahA (30) and pmoA (7) in groundwater; nifH expression in termite guts and lake water (21, 34); rbcL expression in lake water (32); merR expression in lake water sediment (20); narG, napA, nirS, nirK, and nosZ expression in estuarine sediments (22); and expression of the Desulfovibrio [NiFe] hydrogenase gene in anaerobic reactor (29).
In the present study we investigate the diversity of transcripts of the nirK and nirS genes in the rhizospheres of three economically important grain legumes, V. faba, L. albus, and P. sativum, and the occurrence of plant rhizosphere-specific phylotypes. The presence and expression of the genes were initially checked by amplification of the nirK and nirS genes with specific primers. The amplified products were then resolved by the technique of denaturing gradient gel electrophoresis (DGGE) to screen for variations between the replicates and also to calculate the level of similarities or differences among the three legumes under study. Representative samples were further cloned to identify the differences or similarities between the legumes.
MATERIALS AND METHODS
Experimental design and sampling.
Soil samples from a site in north-west Germany (52°31′N, 8°13′E) were taken from the top 0 to 20 cm of a eutric cambisol. The field had been cultivated by organic farming management for 10 years. The soil was characterized as a sandy loam with 17.3% clay, 30.1% silt, 52.6% sand, pH (0.01 M CaCl2) 6.0, 1.58% total C, 0.15% total N, 140 mg of P kg−1 of soil (calcium lactate [CaL]), 208 mg of K kg−1 (CaL), and 100 mg of Mg kg−1 (CaL). The water-holding capacity (10-mm sieved soil) was 309 g of H2O kg−1 of dry soil. Fresh soil samples were sieved through a 10-mm mesh prior to use.
Ten rectangular boxes (60 by 45 by 40 cm) per legume were prepared with about 70 kg of soil per box. Seeds of faba beans (V. faba L., cv. Scirocco; Saaten-Union, Iserlohn, Germany), white lupin (L. albus L., cv. Amiga; Saaten-Union), and peas (P. sativum L., cv. Duel; Saatbau Linz, Linz, Austria) were inoculated with legume-specific Rhizobium inoculants (Rhizobium leguminosarum bv. viciae for V. faba and P. sativum and Rhizobium lupini for L. albus from Radicin Institute, Iserlohn, Germany) according to the manufacturer's instructions, and three seeds were sown in each box. The plants were grown at 18°C with 70% humidity and a photoperiod consisting of 16 h of light and 8 h of darkness. The plants were watered equally every alternate day. The health of the plants was monitored during this period by visual observation of the color of their leaves. Sampling was performed after fruiting (5 months from the date of sowing). Plants and soil were removed from the pots. Subsequently, excess bulk soil was removed from the roots by shaking, leaving firmly adhering soil, which was defined as rhizosphere soil. Thirty replicates (10 pots with three plants in each) for each legume were sampled. Samples were stored separately at −80°C.
Nucleic acid extraction.
Nucleic acid extraction from the rhizosphere soil was performed by using the method of coextraction of DNA and RNA described by Griffiths et al. (14) with a few modifications (2). Prior to nucleic acid extraction, water was treated overnight with 0.1% diethyl pyrocarbonate, and all solutions were prepared in diethyl pyrocarbonate-treated water. Also, the glassware was baked at 180°C for 4 h. The method principally involved bead beating and solvent extraction of the nucleic acids. To prevent the degradation of mRNA, all incubations were performed on ice. To obtain pure DNA, incubation for 10 min at 37°C with RNase A (Sigma) at a final concentration of 100 μg ml−1 of water was performed. Prior to RT, DNA was removed from RNA by treatment with DNase (1 U μl−1) (RNase free; Promega) according to the manufacturer's instructions.
PCR and RT-PCR amplification.
PCR and RT-PCR targeting nirK and nirS were performed with the primers nirK1F-nirK5R and nirS1F-nirS6R, respectively (5). RT was performed as described below. Two microliters of total RNA sample was added to an 18-μl RT mixture prepared according to the manufacturer's instructions (Omniscript RT Kit; Qiagen, Hilden, Germany). nirK5R and nirS6R were used in the reaction for the nirK and nirS genes, respectively. Synthesized cDNA and DNA were further used for amplification according to the following protocol. One microliter of cDNA/DNA was added to a 48.5-μl PCR mixture that consisted of 29 μl of nuclease-free water, 5 μl of 10× reaction buffer, 5 μl of 2 mM deoxyribonucleoside triphosphate mixture, 1 μl each of 10 μM primers (nirK1F-nirK5R or nirS1F-nirS6R primer for nirK or nirS, respectively), 5 μl of 3% bovine serum albumin, and 2.5 μl of dimethyl sulfoxide. For DGGE fingerprinting, a 40-bp GC clamp (23) was attached to the 5′ end of the forward primer, nirK1F. The reaction involved a hot start at 95°C for 10 min, followed by the addition of 0.5 μl of cloned Pfu DNA polymerase (2.5 U μl−1; Stratagene, Amsterdam, The Netherlands). The cycling parameters for 30 cycles were 94°C for 1 min, 56°C for 1 min, and 72°C for 1 min, followed by a final extension at 72°C for 10 min. DNase-treated nucleic acids, without being subjected to RT, were used as controls in PCR to check for residual DNA in RNA preparations. The amplification products were analyzed by electrophoresis on 1.5% (wt/vol) agarose gels, followed by a 15-min staining with ethidium bromide (0.5 mg l−1). Bands were excised and purified by using a QIAEX II gel extraction kit (Qiagen).
DGGE of RT-PCR products.
DGGE was performed by using 6% polyacrylamide gels (ratio of acrylamide to bisacrylamide, 37:1) with a 50 to 60% denaturant. A 100% denaturant is defined as 7 M urea plus 40% formamide (1). Appropriate volumes containing about 2 μg of the purified RT-PCR products, measured by absorbance at 260 nm, were loaded. The gels were electrophoresed at 60°C at 50 V for 17 h by using a D-Gene system (Bio-Rad Laboratories, Munich, Germany). The gels were silver stained according to the protocol described by Heukeshoven and Dernick (15). Dried gels were scanned by an HP Scanjet 7400c. The DGGE profiles obtained were analyzed by clustering via the unweighted pair group method with mathematical averages (Dice coefficient of similarity) by using GelCompar II software (Applied Maths, Kortrijk, Belgium). The position tolerance was set at 1%, and background subtraction was applied. Both strong and weak bands were included in the analysis, thus taking into account the presence and absence of bands at specific positions.
Cloning and restriction fragment length polymorphism (RFLP).
Three microliters of purified amplification products was cloned into the pCR-Blunt II-TOPO vector of a Zero Blunt TOPO PCR cloning kit (Invitrogen, Karlsruhe, Germany) according to the manufacturer's instructions. Ligations were transformed into chemically competent One Shot DH5α-T1 cells provided in the kit. A total of 100 clones were randomly selected and inoculated in Luria-Bertani medium (supplemented with 50 μg of kanamycin ml−1), and plasmid was isolated by using a Qiagen Plasmid Mini Kit. Purified plasmids were tested for inserts by EcoRI (MBI Fermentas, Heidelberg, Germany) digestion with 1 U in a 50-μl reaction mixture.
Inserts were amplified by using the M13 forward and reverse primers provided in the Zero Blunt TOPO PCR Cloning Kit (Invitrogen) according to the manufacturer's instructions. Amplicons (2 μl each) were then screened by RFLP by digestion with 0.3 U of the restriction enzyme MspI (MBI Fermentas) in a final volume of 20 μl at 37°C overnight according to Braker et al. (6). The digested products were separated by gel electrophoresis on 4% (wt/vol) QA-Agarose High Resolution gels (Qbiogene, Heidelberg, Germany). To assess the number of clones sufficient to encompass the bacterial diversity, the collector's curve or species abundance curve (the number of operational taxonomic units detected plotted versus the number of clones analyzed) was constructed by using the software Analytic Rarefaction (http://www.uga.edu/∼strata/software/Software.html). The RFLP types obtained were defined as operational taxonomic units (OTUs).
Sequencing and sequence analysis.
Inserts of representative samples for each RFLP type were sequenced on an ABI PRISM 310 genetic analyzer (Applied Biosystems, Foster City, Calif.) according to the standard protocol. Sequences were compared by using the National Center for Biotechnology Information BLAST program and aligned by using the ClustalW program of the European Molecular Biology Laboratory. Phylogenetic analysis was performed with a neighbor-joining algorithm and distance calculation according to Jukes and Cantor (16) by using TREECON version 1.3b (28). The aniA gene from Neisseria gonorrhoeae (accession no. M97926) was used as an outgroup for phylogenetic analysis, and tree topology was evaluated by bootstrap analysis by using 100 replicates.
Nucleotide sequence accession numbers.
The clone sequences determined in this study have been submitted to the GenBank database under accession numbers AY386223 to AY386234.
RESULTS
Amplification of nir genes and transcripts.
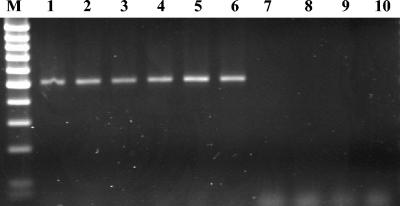
The presence and expression of nir (nirK and nirS) genes and transcripts were investigated for triplicates in the same pot as well as for the 10 different pots studied for each legume. nirK gene fragments of 514 bp were successfully amplified from the rhizospheres of the three legumes (Fig. 1) from all 90 samples (30 samples per legume). No amplification of the nirS gene could be achieved with DNA and cDNA for any of the 30 replicates of the three legumes (data not shown). However, the desired band of 890 bp for the nirS fragment could be obtained for PCR with Azospirillum brasilense Sp7, which was used as a positive control.
FIG. 1.
Agarose gel for detection of PCR and RT-PCR fragments for nirK. Lane M, 100-bp markers; lanes 1 to 3, PCR products for Vicia, Lupinus, and Pisum rhizospheres, respectively; lanes 4 to 6, RT-PCR products for Vicia, Lupinus, and Pisum rhizospheres, respectively; lanes 7 to 9: PCR products of DNase-treated nucleic acids not subjected to RT for Vicia, Lupinus, and Pisum rhizospheres, respectively; lane 10, negative control.
DGGE fingerprinting of RT-PCR products.
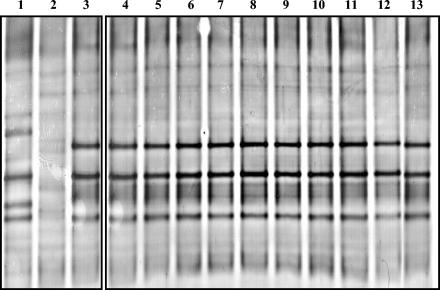
The nirK RT-PCR products were subsequently resolved by DGGE. The DGGE profiles of 30 plants for each rhizosphere soil type (10 pots per legume and three plants per pot) were compared to identify sampling variations for RT-PCR products. More than 95% similarity was observed between the profiles of the plants in the same pot and also for the 10 different pots for each legume (Fig. 2). Each of the three legume rhizospheres compared produced a distinct molecular profile, which was largely, but not completely, different from the profile generated by the other two plant rhizosphere samples (Fig. 2). A comparison of the profiles by GelCompar II software revealed that the profiles of Vicia and Lupinus were more similar to each other (50% similar) than to the profile derived from the nirK RT-PCR product of Pisum (data not shown). In Lupinus 19 bands were obtained, but the number decreased to 12 in Pisum and 13 in Vicia cDNA-derived profiles. A number of less intense bands were present in the three plants with only five to six dominant bands.
FIG. 2.
DGGE profiles of nirK RT-PCR products obtained from the three legumes. Lanes 1 to 3, profiles of Vicia, Lupinus, and Pisum, respectively; lanes 4 to 13, profiles obtained from 10 different pots of Pisum.
RFLP analysis of clones and sequence analysis of representative patterns.
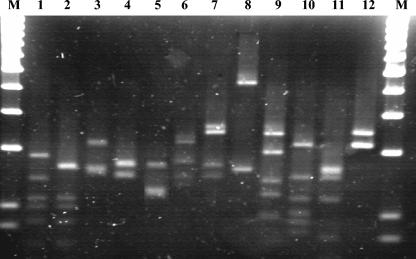
As the DGGE profiles of replicates for each legume were similar to each other, the RT-PCR products of nirK from one representative sample of each legume were cloned, and 100 clones were screened from each rhizosphere type. A total of 266 clones (83, 92, and 91 from the libraries of Vicia, Lupinus, and Pisum, respectively) with inserts of the correct sizes were used for further studies. Inserts amplified from the plasmids were subjected to restriction digestion by using MspI. The digested products were resolved on 4% (wt/vol) QA-Agarose High Resolution gels. The patterns could be grouped into 12 different types (Fig. 3). Each pattern was considered as one phylotype.
FIG. 3.
RFLP patterns of nirK inserts generated by using the restriction enzyme MspI. Lane M, 100-bp markers; lanes 1 to 12, the 12 different patterns into which all the clones could be grouped.
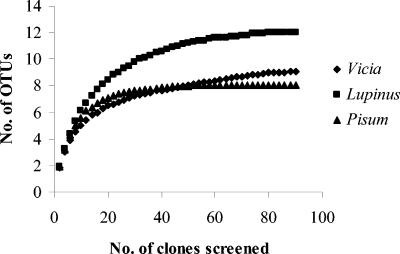
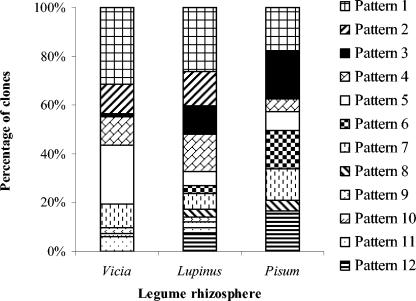
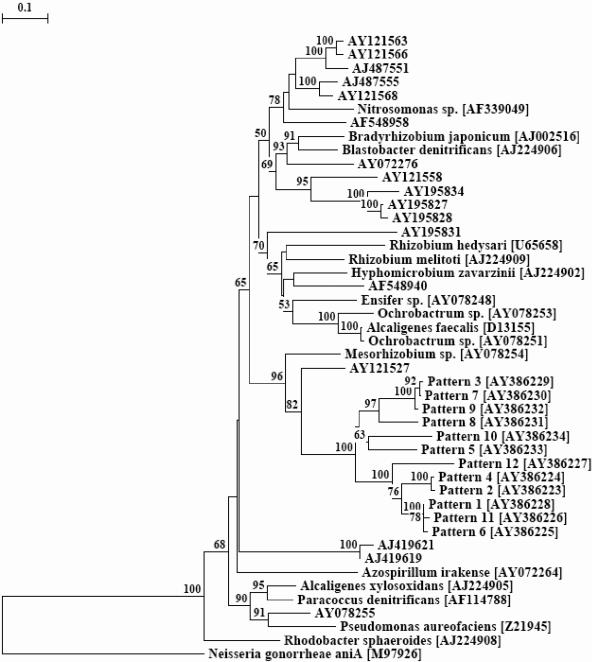
Phylotypes were considered as OTUs and a collector's curve was plotted with the number of clones screened versus the number of OTUs obtained. A plateau, as expected for full coverage of the libraries, was obtained after screening 80 clones (Fig. 4). Patterns 1, 3, 4, 5, and 7 were found in the clone libraries of the three rhizosphere types under study (Fig. 5). Patterns 2, 9, 10, and 11 were observed among both Vicia and Lupinus rhizospheres in different proportions. Patterns 6, 8, and 12 were restricted to the Lupinus and Pisum libraries. Pattern 1, which was the most dominant in the Vicia and Lupinus libraries, constituted about 25% of all clones. Pattern 3, which was the most dominant in the Pisum library, was represented only once in the Vicia library. Patterns 2 and 4 together constituted about 20% of all clones. All the patterns were found in the Lupinus libraries, indicating that Lupinus is the most diverse with respect to nirK transcripts. Vicia and Pisum had nine and eight different RFLP patterns, respectively. nirK gene fragment (514 bp) of representative clones of each pattern was sequenced. Phylogenetic analysis of these sequences grouped all the patterns in one major group, which was divergent from previously described nirK sequences (Fig. 6). The cluster formed by the patterns grouped with nirK sequence of Mesorhizobium sp. (accession no. AY078254).
FIG. 4.
Collector's curve obtained by plotting the number of different OTUs obtained versus the number of clones analyzed for the clone libraries of Vicia, Lupinus, and Pisum.
FIG. 5.
Relative distribution of phylotypes (RFLP patterns) in the rhizospheres of Vicia, Lupinus, and Pisum.
FIG. 6.
Phylogram for nirK based on partial gene fragments. The tree is based on distance matrix analysis and a neighbor-joining method. The GenBank accession numbers follow pattern numbers. For environmental clones NCBI accession numbers have been given. The accession numbers of reference organisms have been indicated in brackets beside the names of the organisms. The scale bar indicates the expected number of changes per sequence position. Bootstrap values greater than 50 from 100 replicate trees are reported at the nodes. The sequence of aniA from N. gonorrhoeae (accession no. M97926) served as an outgroup to root the phylogram.
DISCUSSION
Biofertilizers play an important role in sustainable agriculture. The nitrogen available to plants can be introduced to agricultural soils either by fertilization or by biological nitrogen fixation. A part of the nitrogen is lost due to nitrate leaching and/or by the emission of gaseous forms of nitrogen. The latter process is mainly caused by denitrification. As the group of denitrifying microbes is highly diverse, the analysis of denitrifying communities by 16S ribosomal genes is not appropriate. Therefore, genes involved in denitrification have been used to describe the community structure of denitrifiers. The genes commonly investigated in such studies are narG, nirS, nirK, and nosZ (27, 31, 33). In the present study both forms of the nitrite reductase (nirS and nirK) genes were analyzed as the activity of these leads to the loss of nitrogen. Studies of the genes involved in denitrification have been based mainly on analysis at the gene pool level (27, 31, 33). However, the presence of a gene does not imply its expression. Therefore, analysis of the transcript is of great relevance in understanding denitrification in a given system.
The three legumes used for the analysis of nir transcript diversity were selected because of reports on differences in rhizodeposition among the three plants (17, 18). Studies of microbial diversity based on 16S analysis from the rhizospheres of the legumes revealed major differences among the bacterial communities of the three legume rhizospheres under investigation (26), which formed the basis for detailed analysis of specific genes in the systems.
In the present study, successful amplification of nirK from both DNA and mRNA revealed not only its presence in the gene pool but also its expression in the rhizospheres of the three legumes under investigation. In contrast, the nirS gene fragment could not be detected even with rhizosphere DNA, thus indicating the absence of denitrifiers containing nirS sequences similar to those that can be targeted by the primer pair used. The apparent predominance of either nirK or nirS in rhizosphere soils may reflect differences in denitrifier enzyme properties in the rhizosphere, where this process is strongly selected, or it may be due to traits of the organism that are not connected to denitrification (24). However, the presence of nirS genes or transcripts in very low numbers, which go undetected by PCR, cannot be ruled out. Another possible explanation for the lack of detection of nirS from the three rhizospheres might be that the nirS primers selectively amplify nirS genes closely related to those used for the development of the primers (5). Thus, they may not have detected more distantly related nirS fragments, which might have been present in the rhizosphere soils under investigation. Therefore, it is not surprising that other authors who have used the same primer pair as the present study could not amplify nirS from soil samples. Avrahami et al. (4) could not detect nirS fragments from a silt loam soil from Germany, while Priemé et al. (24) could not detect nirS from a mixed deciduous upland forest soil in Michigan. Wolsing and Priemé (31) were able to detect nirS at only one time point from soil sites receiving mineral fertilizer.
The DGGE profiles for the three legumes contained 12 to 20 bands. This number is lower than that obtained by Throbäck et al. (27) on analysis of denitrifiers in arable soil. The discrepancy could be attributed to the fact that we used a cDNA-derived profile, which is a measure of only the active denitrifiers in the present study and not the total denitrifying potential present in the community. Furthermore, a rhizosphere effect, which causes selection of only a few genotypes, might have caused a further reduction in bands compared to the number obtained by Throbäck et al. (27), wherein bulk soil was analyzed. Similar to the results reported by Throbäck et al. (27), most of the visible bands had similar intensities while only a couple of bands were comparatively more intense. Interestingly, clear differences were visible among the profiles of the three legumes investigated. Vicia and Lupinus rhizosphere samples were more similar to each other than to the Pisum profile. The fingerprint generated by the Lupinus nirK RT-PCR product consisted of the maximum number of bands, indicating its denitrifying population to be the most diverse compared to the other two legumes under investigation. In a study by Sharma et al. (26) of structural bacterial diversity based on 16S rDNA and rRNA analysis of the three rhizosphere samples, the same trend was revealed, indicating a possible correlation between the structural community and the diversity of denitrifiers. However, DGGE has the limitations resulting from the comigration of fragments and formation of heteroduplexes, which may obscure the number of truly different observable bands (27). In a related study, Mayer et al. (17, 18) reported a rhizodeposition value of 21 mg kg−1 of soil in Pisum, while the value was 61 and 52 mg kg−1 of soil in Vicia and Lupinus, respectively. The percentages of N derived from rhizodeposition that could be traced in microbial biomass in Vicia and Lupinus were 20 and 22%, respectively; in Pisum the value was only 8%. The similarity in the profiles of active denitrifying communities in the rhizospheres of Vicia and Lupinus could be attributed to similar N rhizodeposition values between these two legumes compared to the value in Pisum.
RFLP analysis revealed that the 266 clones (83, 92, and 91 from the libraries of Vicia, Lupinus, and Pisum, respectively) could be grouped into 12 different patterns. The Lupinus library was the most diverse, with all 12 phylotypes represented. This confirmed the result obtained by the DGGE analysis of nirK products wherein Lupinus was found to be the most diverse when the banding patterns were observed. Priemé et al. (24) reported a higher diversity of nir genes from upland and marsh soils. In upland soil, 18 different phylotypes could be observed from the analysis of 50 clones. In marsh habitat the number of phylotypes increased to 37 when 93 clones were screened. This study was based on DNA analysis from bulk soil. In the rhizosphere, unlike in bulk soil, plant roots directly influence the survival, growth, and activity of bacteria in their vicinity (10). This explains the relatively reduced number of phylotypes observed in the present study. The representative sequences for each pattern were very divergent from those described for cultured denitrifiers forming a distinct cluster. Mesorhizobium sp. (accession no. AY078254) was the nearest culturable denitrifier according to the phylogram. This finding could be explained either by the lack of nirK gene sequences in the database or as an indication that only a particular group of bacteria that has a distinct nir operon is involved in denitrification in the rhizosphere of the three legumes. In a study by Mayer et al. (18) almost identical values for the mineral nitrogen content in the rhizospheres of the three legumes under investigation were reported.
These results reflect the diversity of active denitrifiers in the rhizospheres of grain legumes. A plant-dependent rhizosphere effect on the transcripts of a gene could be shown. Furthermore, the approach used here and the quantification of gene dosages, demonstrated for nitrate reductase genes (4, 19), should significantly enhance our understanding of bacterial denitrification in the environment. However, to use these data in agricultural practices to reduce the emission of N2O back to the environment, data about the correlation between transcription and expression are necessary. Additional research about the described denitrifying bacterial communities, mainly their distribution in time and space, and possibilities for the repression of their nir gene clusters are of great importance. The results of the present study, however, are an important step toward understanding denitrification in the rhizospheres of grain legumes.
Acknowledgments
The study was supported by research grant MU 831/10-1 from the Deutsche Forschungsgemeinschaft (DFG), Bonn, Germany.
REFERENCES
- 1.Abrams, E. S., and V. P. Stanton. 1992. Use of denaturing gradient gel electrophoresis to study conformational transitions in nucleic acids. Methods Enzymol. 212:71-104. [DOI] [PubMed] [Google Scholar]
- 2.Aneja, M. K., S. Sharma, J. C. Munch, and M. Schloter. 2004. RNA fingerprinting—a new method to screen for differences in plant litter degrading microbial communities. J. Microbiol. Methods 59:223-231. [DOI] [PubMed] [Google Scholar]
- 3.Aulakh, M. S., J. W. Doran, and A. R. Mosier. 1992. Soil denitrification-significance, measurement and effects of management. Adv. Soil Sci. 18:1-57. [Google Scholar]
- 4.Avrahami, S., R. Conrad, and G. Braker. 2002. Effect of soil ammonium concentration on N2O release and on the community structure of ammonia oxidizers and denitrifiers. Appl. Environ. Microbiol. 68:5685-5692. [DOI] [PMC free article] [PubMed] [Google Scholar]
- 5.Braker, G., A. Fesefeldt, and K. P. Witzel. 1998. Development of PCR primer systems for amplification of nitrite reductase genes (nirK and nirS) to detect denitrifying bacteria in environmental samples. Appl. Environ. Microbiol. 64:3769-3775. [DOI] [PMC free article] [PubMed] [Google Scholar]
- 6.Braker, G., J. Zhou, L. Wu, A. H. Devol, and J. M. Tiedje. 2000. Nitrite reductase genes (nirK and nirS) as functional markers to investigate diversity of denitrifying bacteria in Pacific Northwest marine sediment communities. Appl. Environ. Microbiol. 66:2096-2104. [DOI] [PMC free article] [PubMed] [Google Scholar]
- 7.Cheng, Y. S., J. L. Halsey, K. A. Fode, C. C. Remsen, and M. L. P. Collins. 1999. Detection of methanotrophs in groundwater by PCR. Appl. Environ. Microbiol. 65:648-651. [DOI] [PMC free article] [PubMed] [Google Scholar]
- 8.Conrad, R. 1996. Soil microorganisms as controllers of atmospheric trace gases (H2, CO, CH4, OCS, N2O and NO). Microbiol. Rev. 60:609-640. [DOI] [PMC free article] [PubMed] [Google Scholar]
- 9.Coyne, M. S., A. Arunakumari, A. Averill, and J. M. Tiedje. 1989. Immunological identification and distribution of dissimilatory heme cd1 and nonheme copper nitrite reductases in denitrifying bacteria. Appl. Environ. Microbiol. 55:2924-2931. [DOI] [PMC free article] [PubMed] [Google Scholar]
- 10.Duineveld, B. M., G. A. Kowalchuk, A. Keijzer, J. D. Van Elsas, and J. A. Van Veen. 2001. Analysis of bacterial communities in the rhizosphere of chrysanthemum via denaturing gradient gel electrophoresis of PCR-amplified 16S rRNA as well as DNA fragments coding for 16S rRNA. Appl. Environ. Microbiol. 67:172-178. [DOI] [PMC free article] [PubMed] [Google Scholar]
- 11.Garland, J. L. 1996. Patterns of potential C sources utilization by rhizosphere communities. Soil Biol. Biochem. 28:223-230. [Google Scholar]
- 12.Gathumbi, S. M., G. Cadisch, and K. E. Giller. 2002. 15N natural abundance as a tool for assessing N2-fixation of herbaceous, shrub and tree legumes in improved fallows. Soil Biol. Biochem. 34:1059-1071. [Google Scholar]
- 13.Gathumbi, S. M., J. K. Ndufa, K. E. Giller, and G. Cadisch. 2002. Do mixed species-improved fallows increase above- and below-ground resources capture? Agron. J. 94:518-526. [Google Scholar]
- 14.Griffiths, R. I., A. S. Whiteley, A. G. O'Donnell, and M. J. Bailey. 2000. Rapid method for coextraction of DNA and RNA from natural environments for analysis of ribosomal DNA- and rRNA-based microbial community composition. Appl. Environ. Microbiol. 66:5488-5491. [DOI] [PMC free article] [PubMed] [Google Scholar]
- 15.Heukeshoven, J., and R. Dernick. 1986. Neue ergebnisse zum mechanismus der silberfaerbung, p. 22-27. In B. J. Radola (ed.), Electrophorese forum '86. Technische Universitaet Muenchen, Munich Germany.
- 16.Jukes, T. H., and C. R. Cantor. 1969. Evolution of protein molecules. p. 21-132. In H. H. Munro (ed.), Mammalian protein metabolism. Academic Press, New York, N.Y.
- 17.Mayer, J., F. Buegger, E. S. Jensen, M. Schloter, and J. Heβ. 2003. Estimating N rhizodeposition of grain legumes using a 15N in situ labelling method. Soil Biol. Biochem. 35:21-28. [Google Scholar]
- 18.Mayer, J., F. Buegger, E. S. Jensen, M. Schloter, and J. Heβ. 2003. Residual nitrogen contribution from grain legumes to succeeding wheat and rape and related microbial process. Plant Soil 255:541-554. [Google Scholar]
- 19.Mergel, A., O. Schmitz, T. Mallmann, and H. Bothe. 2001. Relative abundance of denitrifying and dinitrogen-fixing bacteria in layers of a forest soil. FEMS Microbiol. Ecol. 36:33-42. [DOI] [PubMed] [Google Scholar]
- 20.Miskin, I. P., P. Farrimond, and I. M. Head. 1999. Identification of novel bacterial lineages as active members of microbial populations in a freshwater sediment using a rapid RNA extraction procedure and RT-PCR. Microbiology 145:1977-1987. [DOI] [PubMed] [Google Scholar]
- 21.Noda, S., M. Ohkuma, R. Usami, K. Horikoshi, and T. Kudo. 1999. Culture-independent characterization of a gene responsible for nitrogen fixation in the symbiotic microbial community in the gut of the termite Neotermes koshunensis. Appl. Environ. Microbiol. 65:4935-4942. [DOI] [PMC free article] [PubMed] [Google Scholar]
- 22.Nogales, B., K. N. Timmis, D. B. Nedwell, and A. M. Osborn. 2002. Detection and diversity of expressed denitrification genes in estuarine sediments after reverse transcription-PCR amplification from mRNA. Appl. Environ. Microbiol. 68:5017-5025. [DOI] [PMC free article] [PubMed] [Google Scholar]
- 23.Nübel, U., B. Engelen, A. Felske, J. Snaidr, A. Wieshuber, R. I. Amann, W. Ludwig, and H. Backhaus. 1996. Sequence heterogeneities of genes encoding 16S rRNAs in Paenibacillus polymyxa detected by temperature gradient gel electrophoresis. J. Bacteriol. 178:5636-5643. [DOI] [PMC free article] [PubMed] [Google Scholar]
- 24.Priemé, A., G. Braker, and J. M. Tiedje. 2002. Diversity of nitrite reductase (nirK and nirS) gene fragments in forested upland and wetland soils. Appl. Environ. Microbiol. 68:1893-1900. [DOI] [PMC free article] [PubMed] [Google Scholar]
- 25.Robinson, A. D., D. B. Nedwell, R. M. Harrison, and B. G. Ogilvie. 1998. Hypernutrified estuaries as sources of N2O emission to the atmosphere: the estuary of the River Colne, Essex, UK. Mar. Ecol. Prog. Ser. 164:59-71. [Google Scholar]
- 26.Sharma, S., M. K. Aneja, J. Mayer, J. C. Munch, and M. Schloter. Characterization of bacterial community structure in rhizosphere soil of grain legumes. Microbial Ecol., in press. [DOI] [PubMed]
- 27.Throbäck, A. N., K. Enwall, Å. Jarvis, and A. Hallin. 2004. Reassessing PCR primers targeting nirS, nirK and nosZ genes for community surveys of denitrifying bacteria with DGGE. FEMS Microbiol. Ecol. 49:401-417. [DOI] [PubMed] [Google Scholar]
- 28.Van de Peer, Y., and R. De Wachter. 1994. TREECON for Windows: a software package for the construction and drawing of evolutionary trees for the Microsoft Windows environment. Comput. Appl. Biosci. 10:569-570. [DOI] [PubMed] [Google Scholar]
- 29.Wawer, C., M. S. M. Jetten, and G. Muyzer. 1997. Genetic diversity and expression of the [NiFe] hydrogenase large-subunit gene of Desulfovibrio spp. in environmental samples. Appl. Environ. Microbiol. 63:4360-4369. [DOI] [PMC free article] [PubMed] [Google Scholar]
- 30.Wilson, M. S., C. Bakermans, and E. L. Madsen. 1999. In situ, real-time catabolic gene expression: extraction and characterization of naphthalene dioxygenase mRNA transcripts from groundwater. Appl. Environ. Microbiol. 65:80-87. [DOI] [PMC free article] [PubMed] [Google Scholar]
- 31.Wolsing, M., and A. Priemé. 2004. Observation of high seasonal variation in community structure of denitrifying bacteria in arable soil receiving artificial fertilizer and cattle manure by determining T-RFLP of nir gene fragments. FEMS Microbiol. Ecol. 48:261-271. [DOI] [PubMed] [Google Scholar]
- 32.Xu, H. H., and F. R. Tabita. 1996. Ribulose-1,5-bisphosphate carboxylase/oxygenase gene expression and diversity of Lake Erie planktonic microorganisms. Appl. Environ. Microbiol. 62:1913-1921. [DOI] [PMC free article] [PubMed] [Google Scholar]
- 33.Yan, T., M. W. Fields, L. Wu, Y. Zu, J. M. Tiedje, and J. Zhou. 2003. Molecular diversity and characterization of nitrite reductase gene fragments (nirK and nirS) from nitrate- and uranium-contaminated groundwater. Environ. Microbiol. 5:13-24. [DOI] [PubMed] [Google Scholar]
- 34.Zani, S., M. T. Mellon, J. L. Collier, and J. P. Zehr. 2000. Expression of nifH genes in natural microbial assemblages in Lake George, New York, detected by reverse transcriptase PCR. Appl. Environ. Microbiol. 66:3119-3124. [DOI] [PMC free article] [PubMed] [Google Scholar]
- 35.Zumft, W. G. 1997. Cell biology and molecular basis of denitrification. Microbiol. Mol. Biol. Rev. 61:533-616. [DOI] [PMC free article] [PubMed] [Google Scholar]


