Abstract
Purpose
To describe the design, conduct, and results of the Breast Multiparametric MRI for prediction of neoadjuvant chemotherapy Response (BMMR2) challenge.
Materials and Methods
The BMMR2 computational challenge opened on May 28, 2021, and closed on December 21, 2021. The goal of the challenge was to identify image-based markers derived from multiparametric breast MRI, including diffusion-weighted imaging (DWI) and dynamic contrast-enhanced (DCE) MRI, along with clinical data for predicting pathologic complete response (pCR) following neoadjuvant treatment. Data included 573 breast MRI studies from 191 women (mean age [±SD], 48.9 years ± 10.56) in the I-SPY 2/American College of Radiology Imaging Network (ACRIN) 6698 trial (ClinicalTrials.gov: NCT01042379). The challenge cohort was split into training (60%) and test (40%) sets, with teams blinded to test set pCR outcomes. Prediction performance was evaluated by area under the receiver operating characteristic curve (AUC) and compared with the benchmark established from the ACRIN 6698 primary analysis.
Results
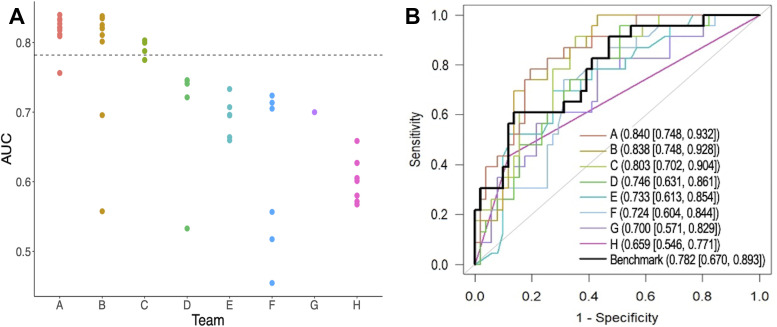
Eight teams submitted final predictions. Entries from three teams had point estimators of AUC that were higher than the benchmark performance (AUC, 0.782 [95% CI: 0.670, 0.893], with AUCs of 0.803 [95% CI: 0.702, 0.904], 0.838 [95% CI: 0.748, 0.928], and 0.840 [95% CI: 0.748, 0.932]). A variety of approaches were used, ranging from extraction of individual features to deep learning and artificial intelligence methods, incorporating DCE and DWI alone or in combination.
Conclusion
The BMMR2 challenge identified several models with high predictive performance, which may further expand the value of multiparametric breast MRI as an early marker of treatment response.
Clinical trial registration no. NCT01042379
Keywords: MRI, Breast, Tumor Response
Supplemental material is available for this article.
© RSNA, 2024
Keywords: MRI, Breast, Tumor Response
Summary
The Breast Multiparametric MRI for prediction of neoadjuvant chemotherapy Response (BMMR2) challenge resulted in imaging-based models with high performance for predicting response to neoadjuvant chemotherapy for breast cancer, suggesting the value of functional breast MRI as an early marker of treatment response.
Key Points
■ Eight teams from four countries completed the Breast Multiparametric MRI for prediction of neoadjuvant chemotherapy Response, or BMMR2, challenge using modeling approaches ranging from simple tumor volume measures to radiomics and unsupervised deep learning methods.
■ Models from three teams demonstrated higher point estimators of the areas under the receiver operating characteristic curve (AUCs, 0.803 [95% CI: 0.702, 0.904], 0.838 [95% CI: 0.748, 0.928], and 0.840 [95% CI: 0.748, 0.932]) than the benchmark model identified by the original American College of Radiology Imaging Network 6698 trial (AUC, 0.782 [95% CI: 0.670, 0.893]) for predicting pathologic response.
■ Although modeling approaches varied, all incorporated information was derived from multiparametric breast MRI examinations performed at midtreatment or earlier, with or without other clinical characteristics.
Introduction
Breast cancer is the most common cancer worldwide, with nearly 2.3 million new cases and 685 000 deaths in 2020 (1). In the United States, breast cancer affects one in eight women and is the second deadliest cancer in women after lung cancer (2). Neoadjuvant chemotherapy (NAC) has become a standard-of-care treatment for locally advanced breast cancer, allowing less aggressive surgery and enabling noninvasive monitoring of tumor response using longitudinal imaging, such as MRI. Quantitative MRI metrics have shown promise for predicting individual treatment outcome, which could aid in personalizing therapies both for de-escalation of treatment for those who respond well and for adjustment or escalation of treatment for poor responders.
The American College of Radiology Imaging Network (ACRIN) 6698 trial was performed as a substudy of the multicenter I-SPY 2 TRIAL (Investigation of Serial Studies to Predict Your Therapeutic Response with Imaging and Molecular Analysis 2) to test the value of diffusion-weighted MRI as an early marker of breast cancer response to NAC. The primary analysis of the trial, evaluated in 272 women enrolled at 10 institutions, showed that the percentage change in tumor apparent diffusion coefficient (ADC) measured from diffusion-weighted imaging (DWI) at midtreatment (12 weeks) was predictive of pathologic complete response (pCR) (3). Mean ADC is the most commonly used DWI quantitative biomarker for cancer detection and response assessment (4,5). However, alternative DWI metrics may be more sensitive to treatment-induced changes in the tumor microenvironment. In addition, information from other sequences, such as dynamic contrast-enhanced (DCE) MRI and T2-weighted imaging performed as part of the multiparametric breast MRI examination, may provide valuable complementary information to DWI on physiologic response to treatment.
To take full advantage of the rich ACRIN 6698 data set acquired at multiple sites using a variety of MRI platforms (field strengths and vendors), the Breast Multiparametric MRI for prediction of neoadjuvant chemotherapy Response (BMMR2) imaging challenge was conducted. The challenge was sponsored by the Quantitative Imaging Network, a National Cancer Institute–supported network promoting quantitative imaging methods in clinical trials. The challenge was hosted by MedICI (Medical Imaging Challenge Infrastructure; https://github.com/QTIM-Lab/MedICI) (6), a Quantitative Imaging Network–sponsored open-source platform for running computational competitions; data for the challenge were provided through The Cancer Imaging Archive (TCIA; https://www.cancerimagingarchive.net/). The purpose of the challenge was to provide a platform and data set to enable the development of multiparametric MRI–based predictive models for improved early prediction of pCR treatment outcomes in women undergoing NAC for invasive breast cancer. Herein, we report the design, conduct, and results of the BMMR2 challenge.
Materials and Methods
Timeline
BMMR2 is a retrospective challenge that used data from a Health Insurance Portability and Accountability Act (HIPAA)–compliant, multi-institution study (3). The challenge was officially started on May 28, 2021, and closed on December 21, 2021. It consisted of three phases: training, testing, and open validation.
Data
The BMMR2 challenge included a subset of MRI studies from the ACRIN 6698 trial primary analysis cohort. The ACRIN 6698 imaging trial was a prospective, HIPAA-compliant, multicenter study (ClinicalTrials.gov: NCT01042379). The ACRIN 6698 study was approved by institutional review boards at all participating sites, and all participants enrolled gave written informed consent.
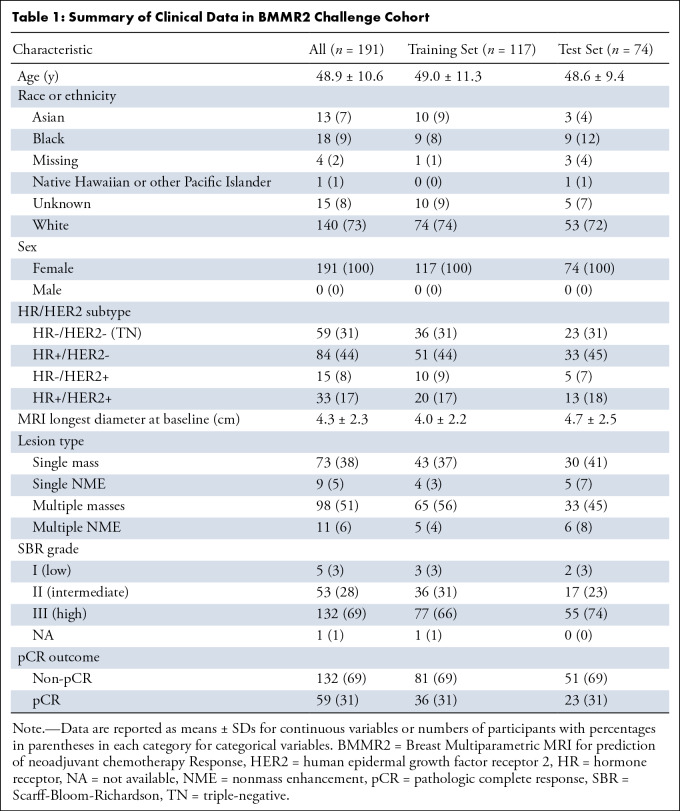
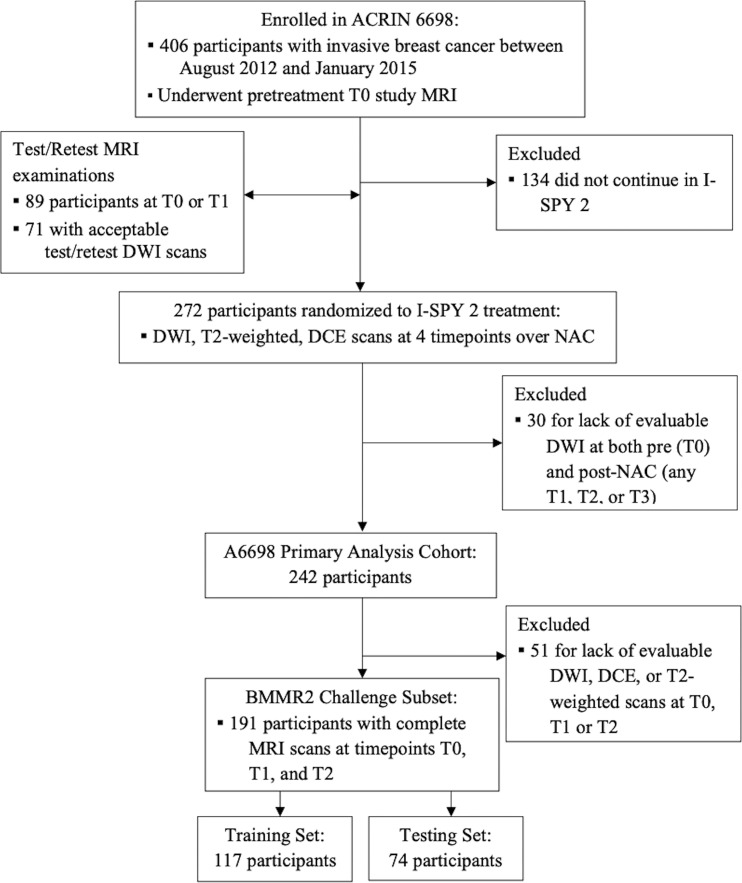
A total of 191 participants with analyzable DWI and DCE scans at all time points up through midtreatment (T0: pretreatment; T1: early treatment, after three cycles of the first therapy regimen; and T2: midtreatment between first and second regimens) were included in the BMMR2 challenge (3). T0 was approximately 1 week before start of treatment, and T1 and T2 were approximately 3 weeks and 12 weeks after initiation of treatment, respectively. Clinical data characteristics of the cohort are shown in Table 1. The participant cohort was then randomly split into a training set (60% [117 of 191]) and a test set (40% [74 of 191]), balancing proportions of pCR and hormone receptor (HR)/human epidermal growth receptor 2 (HER2) status between each set (Fig 1).
Table 1:
Summary of Clinical Data in BMMR2 Challenge Cohort
Figure 1:
BMMR2 challenge cohort flowchart. ACRIN = American College of Radiology Imaging Network, BMMR2 = Breast Multiparametric MRI for prediction of neoadjuvant chemotherapy Response, DCE = dynamic contrast-enhanced, DWI = diffusion-weighted imaging, I-SPY 2 = Investigation of Serial Studies to Predict Your Therapeutic Response with Imaging and Molecular Analysis 2, NAC = neoadjuvant chemotherapy.
In addition, a repeatability data set of 71 test and retest acquisition pairs acquired at T0 or T1 were provided. In this data set, the unenhanced sequences (T2-weighted and DWI) were performed twice in a “coffee-break” style, in which the patient was removed from the scanner after the first acquisition, then repositioned as before for the second acquisition and completion of the full ACRIN 6698 protocol with DCE (7). The purpose was to test the reproducibility of the ADC measurement. In the BMMR2 challenge, repeatability data were provided as an optional data set for biomarker and model development.
All imaging and clinical data used in the BMMR2 challenge were available to participants through TCIA and open to public access from May 2022 (8). Clinical data included age, race, HR and HER2 status, longest diameter of tumor at baseline MRI, tumor index lesion type, and tumor grade. The outcome was a binary variable (true or false) indicating whether the patient had a pCR evaluated at the time of surgery, approximately 24 weeks after the treatment was initiated. pCR was defined as no residual invasive disease in either breast or axillary lymph nodes (ypT0/is, ypN0). Outcome data were accessible to participants only for the training set, not the test set.
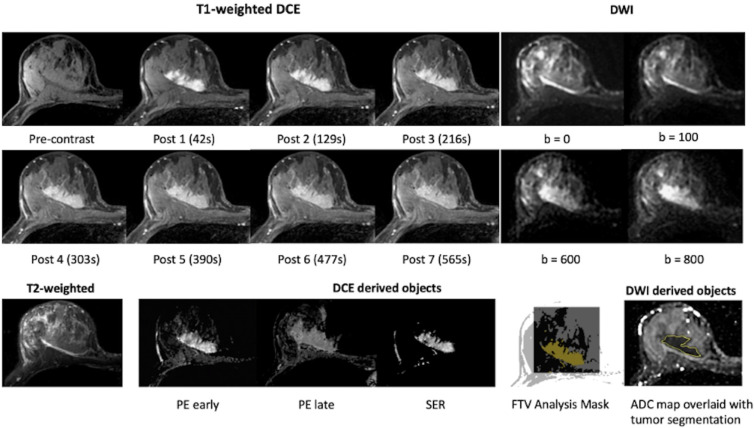
Each multiparametric MRI study on TCIA contained the original T2-weighted, DW, and DCE images. In addition, derived maps and segmentation objects were provided for the DWI (trace images, ADC maps, whole-tumor segmentations) and DCE (percentage enhancement and signal enhancement ratio kinetics maps and functional tumor volume [FTV] segmentations) acquisitions. Complementary information related to postprocessing was also included in private attributes in the derived Digital Imaging and Communications in Medicine, or DICOM, objects, including DCE timing information, DCE tumor volume of interest, signal enhancement ratio analysis parameters, FTV results, DCE acquisition, and ADC map calculation information. The imaging data available at each treatment time point are summarized in Table S1, and further information on all data objects is provided on the TCIA wiki (8). Example images at T0 from a participant are shown in Figure 2.
Figure 2:
Example MRI data shared through the BMMR2 challenge. All images were from the same individual (female, age 57 years) at pretreatment (T0). T1-weighted dynamic contrast-enhanced (DCE) images, diffusion-weighted images (DWI), and T2-weighted images are original images. Percentage enhancement (PE) early was derived from precontrast and post 2 (129 seconds after the administration of contrast agent). PE late was derived from precontrast and post 6 (477 seconds after the administration of contrast agent). Signal enhancement ratio (SER) was derived from precontrast, post 2, and post 6. Tumor segmentations were provided as image masks in DCE images and manually defined contours in DWI. ADC = apparent diffusion coefficient, BMMR2 = Breast Multiparametric MRI for prediction of neoadjuvant chemotherapy Response, FTV = functional tumor volume.
Challenge Management
The challenge was managed through MedICI. During the training phase, submissions of the model predictions were optional, unlimited submissions were allowed, and an area under the receiver operating characteristic curve (AUC) result of each submission was returned and displayed on the team’s challenge dashboard. The purpose was to test the consistency of AUC calculations between MedICI and team’s software. For the test phase, each team could submit up to 10 test set predictions, where every submission was final (editing or resubmission was not allowed).
After the challenge closed, individual teams who submitted test set results were asked to complete a voluntary survey (Appendix S1) regarding their modeling approach, including input data and software tools used and experience with participating in the challenge. Responses from all teams on the survey were compiled and summarized in the results reported below.
Challenge participants had exclusive access to the data, with the understanding that results generated from any data set provided could not be made public before the public release of the entire ACRIN 6698 data collection or publication of the primary BMMR2 challenge manuscript, whichever came first.
Predictive Metrics
Teams were asked to submit one or more quantitative metrics that were predictive of the primary outcome (pCR). Metrics had to be a scalar numeric value calculable for every individual in the test set, with larger values indicating a higher likelihood of a positive pCR outcome. Any provided image modality (T2-weighted, DWI, DCE) or clinical variable could be used to generate the submitted value. There were no restrictions on metrics generation, so metrics could represent simple measurements (eg, mean ADC), outputs from machine learning models, or any computational method that produces a per-subject scalar value. Each submission could contain only one metric.
Statistical Analysis
The participants used the MRI and clinical data in the training set to develop metrics predictive of pCR status, which were subsequently evaluated in the test set. Prediction accuracy was evaluated using the AUC and associated nonparametric 95% CIs. The AUC of the model that was used for the ACRIN 6698 primary analysis (3) and retrained on the challenge training set was used as a benchmark AUC for evaluating the challenge results. The teams were not aware of the benchmark AUC for the test set before the close of the challenge. Although point estimates alone were used for ranking model performances and determining challenge primary outcomes, differences between AUCs of team models and benchmark AUC were also evaluated using a two-sided DeLong test at a significance level of .05. AUC analyses were performed by using R, version 4.2.2 (R Foundation for Statistical Computing) and SAS/STAT software, version 9.4 (SAS Institute).
Results
BMMR2 Challenge Participants
A total of 36 teams registered for the challenge and obtained data access. Nine teams, representing both academic and nonacademic and/or industry organizations from four countries (United States, Israel, Germany, China), submitted test set results. One team subsequently voluntarily withdrew from the challenge because of inadvertent exposure to test set pCR outcomes via a shared datasheet of an I-SPY 2 publication on GEO (Gene Expression Omnibus). The remaining eight teams confirmed that they were blinded to all outcomes for the duration of the challenge and submitted a total of 51 predictive metrics for the test set. The repeatability results are not reported here because of low participation in this segment of the challenge, with only one team contributing an interpretable submission. The 53 parameters for reporting the BMMR2 challenge, as suggested by Maier-Hein et al (9), are listed in Table S2.
Performance of Team Models
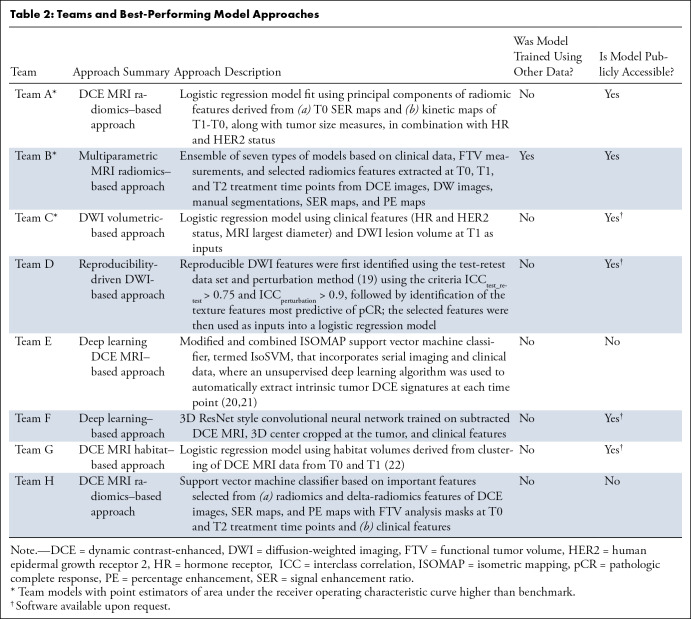
The benchmark was the primary model reported by the original ACRIN 6698 trial, which was a logistic regression model combining mean ADC (using hand-drawn, three-dimensional regions of interest) with a single clinical parameter (tumor HR/HER2 subtype); the model yielded an AUC of 0.782 (95% CI: 0.670, 0.893) in the challenge test set. Figure 3 shows the test performance of all submissions. Only the highest AUC from each team contributed to the final ranking in the challenge. Across the eight teams, the maximum AUCs ranged from 0.659 to 0.840, with three teams (teams A, B, and C) achieving point estimators of AUCs above the benchmark metric (although not reaching statistical significance: P = .30, .36, and .71, respectively; Table S3). Among the top three teams, the AUCs of the first- and second-place finishers were very close, with a narrow difference of 0.002. For the purpose of simplicity, we use letter IDs of A through H to denote the eight teams. Table 2 summarizes the teams’ best-performing model approaches. More details of models from teams A, B, C, and E can be found in Appendix S2.
Figure 3:
Performance of test set predictions submitted by the eight teams. (A) Area under the receiver operating characteristic curves (AUCs) of all test set submissions for each team. The numbers of submissions per team were as follows: team A, n = 10; team B, n = 10; team C, n = 4; team D, n = 5; team E, n = 6, team F, n = 6, team G, n = 1, and team H, n = 9. The dotted horizontal line indicates the AUC value of the benchmark. (B) Receiver operating characteristic curves with the highest AUC for each team. AUCs and 95% CIs are given in the key.
Table 2:
Teams and Best-Performing Model Approaches
Imaging Data, Clinical Data, and Approaches Used for Team Models
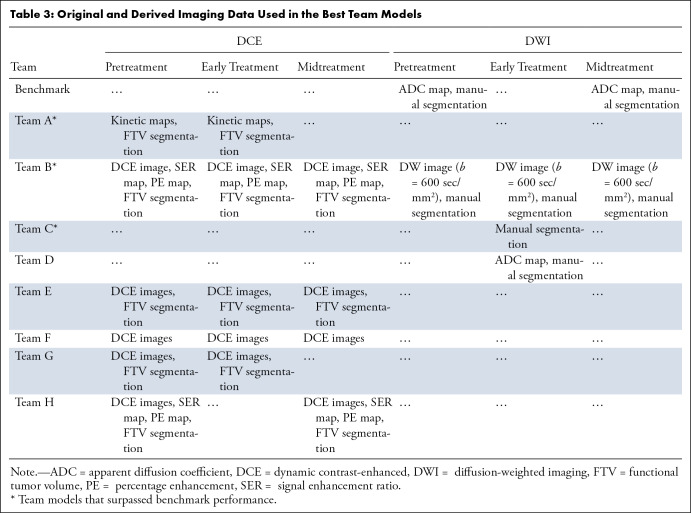
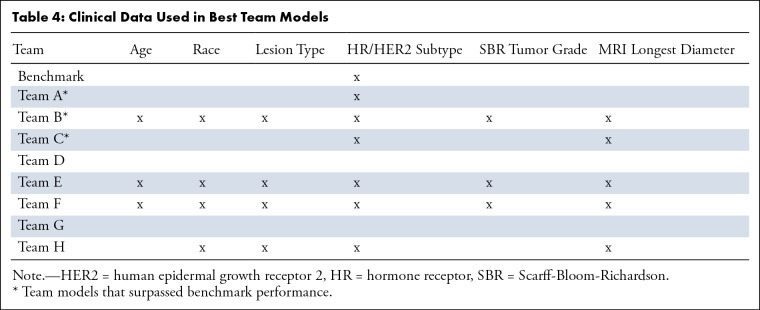
Imaging data and clinical data used in each team’s best-performing model, represented by the receiver operating characteristic curves in Figure 3, are reported in Table 3 and Table 4, respectively. Five of eight teams used only DCE images (teams A, E, F, G, and H), and two teams used only DW images (teams C and D). A single team used both DCE and DWI in the model (team B); two other teams tried both modalities in their model training but not for their best models (teams C and F). No team used the T2-weighted images. All teams used segmentations from either DWI (manually drawn whole-tumor segmentations from ACRIN 6698 primary analysis) or DCE (automated FTV analysis), or both.
Table 3:
Original and Derived Imaging Data Used in the Best Team Models
Table 4:
Clinical Data Used in Best Team Models
Two teams did not use any clinical data (teams D and G), whereas the other six teams used at least HR/HER2 subtype in their best-performing models. Among the six teams that used clinical data, three used all provided clinical parameters (teams B, E, and F). Overall, HR/HER2 subtype was the most used clinical data element (in agreement with the benchmark ACRIN 6698 model), followed by MRI longest diameter as measured by the site radiologist.
Computational approaches used for the eight “team best” models can be found in Table S4. Six of eight teams used a logistic regression model output as their final metric. All teams except team G used feature selection methods. When reported, computation times were generally under 2 seconds per case, except for teams B and H (5 seconds per case). In terms of software tools, teams most commonly used Python for feature selection and radiomics extraction.
Postchallenge Survey
On the basis of team feedback provided in the postchallenge survey, six of eight teams reported the complexity of the multimodality and multivendor data and image quality variation to be the biggest obstacles for completing the challenge; they reported that these aspects necessitated extra time for data sorting and image processing. Two teams reported that a major issue was that the sample size of the training data was insufficient to reliably train a deep learning algorithm. One team reported that they could not test the reproducibility and reliability of their model because test-retest DCE data were not available. One additional team reported difficulty submitting their results to MedICI, the challenge management site. Team sizes varied from two to 10 members. Only one team (team B) reported using other data to train their models. Six of eight teams had plans to make their models publicly accessible. Two team models were available on Github by the time the challenge ended, and four other teams promised to share models upon request (Table 2).
Discussion
The results of the BMMR2 challenge demonstrate the potential for improving prediction of treatment outcomes using computational approaches for analyzing longitudinal, multiparametric MRI data sets. Treatment trials such as ACRIN 6698/I-SPY 2 produce rich and complex data sets, with a variety of image types and clinical measurements acquired at multiple time points. The diversity of approaches and data used by the participants in this challenge demonstrates the difficulty of determining an optimal approach for extracting the maximum clinically useful information from such a data set, warranting larger-scale crowdsourcing methods offered by such a computational challenge. Overall, final test set predictions were submitted from eight teams comprising an international group of academic and nonacademic institutions. Across these teams, the maximum AUCs ranged from 0.659 to 0.840. Three of the participating teams (teams A, B, and C) submitted metrics that were higher than the trial benchmark, although the differences did not reach statistical significance. The predictive performance of these methods, with AUC point estimators of 0.803 (95% CI: 0.702, 0.904), 0.838 (95% CI: 0.748, 0.928), and 0.840 (95% CI: 0.748, 0.932), are among the highest values reported in multisite breast imaging trials using DWI or DCE MRI (3,10).
Interestingly, among the three top models, one (team C) used DWI alone, as did the benchmark ACRIN 6698 model. Although a DWI-only imaging marker holds compelling interest, because it would avoid the need for the gadolinium-based contrast agent required for DCE MRI, the predefined manual regions of interest used to compute DWI characteristics were defined by referencing DCE images; therefore, it remains to be determined whether DWI could truly serve as a stand-alone noncontrast modality for prediction of treatment outcome. The models that achieved the lowest and highest performance (AUCs, 0.659 [95% CI: 0.546, 0.771] by team H and 0.840 [95% CI: 0.748, 0.932] by team A) used similar data approaches based on DCE MRI as the only imaging data, along with various clinical imaging factors. The main difference between the lowest- and highest-performing methods was that the former method used support vector machine models, whereas the latter method used logistic regression models, which indicates that linear models may perform better than nonlinear machine learning models when sample size is limited.
Computational challenges offer a powerful platform for teams to develop and compare their tools on the same shared data set. The motivation of hosting such challenges is to accelerate solutions to research and clinical problems. A recent review of biomedical imaging challenges reported segmentation and classification to be the most common challenges conducted in medical imaging (9,11–13), with MRI being the most commonly applied imaging technique (9). Relatively few challenges have focused on prediction of treatment outcomes (14,15). To the best of our knowledge, the BMMR2 challenge is the first computational challenge with the purpose of predicting treatment response for breast cancer using multiparametric (DCE and DWI) MRI data acquired from multiple centers.
The ACRIN 6698 data set is the first publicly available data set from a multicenter study using longitudinal DWI for breast cancer treatment response. One previous report of a smaller (n = 39) three-center study described a diffusion-based metric with an AUC of 0.964 (CI or standard error not reported) (16), which is higher than the AUCs reported from this challenge. Comparing results between trials is difficult because of the wide variation in trial designs and methods. In a recent systematic review, van der Hoogt et al (17) reported AUCs ranging from 0.50 to 0.93 across multiple single-center trials using DWI. Over time, we anticipate additional analyses of the ACRIN 6698 data set will yield metrics with higher performance. Refinement of the models is ongoing by several participating teams and other groups with public release of the data set (18), and performance is expected to improve further as more serial breast MRI data sets become available from I-SPY 2 and other clinical trials.
The results of the BMMR2 challenge, especially the winning models, demonstrate great potential for multiparametric breast MRI to monitor response in patients undergoing neoadjuvant treatment. Importantly, many of the challenge participants have agreed to make their models available to the research community, which will help bring these methods closer to clinical practice. However, there are still obstacles to overcome before these models can be clinically integrated to guide therapies. The models still require further validation in independent data sets. DWI is not yet part of standard-of-care breast MRI protocols, and midtreatment MRI examinations are not routinely performed. Depending on the model, further validation may rely on data from controlled multicenter trials, such as that emerging from I-SPY 2. Beyond that, standardization of image acquisition and systematic quality control processes are needed to ensure consistent model performance.
The BMMR2 challenge had some limitations. The first limitation was the complexity of the multimodality and multivendor data used in the challenge, as expressed by participants in the survey. Inherent misalignment between images from different modalities (ie, DCE vs DWI) made it difficult to apply radiomics analysis to both modalities. Some teams spent a long time interpreting DICOM headers across multiple vendors and matching tumor masks with original images. The complexity of the cross-vendor multicenter data also made it difficult for some teams to sort out DCE data, so they used DWI only in the interest of time. A second potential limitation was the modest sample size for training, which may have limited the use of deep learning and more data-intensive approaches. For this reason, one team (team B) used data from another source to train their models. A third limitation was the time constraints, which ultimately limited the number of model refinements and final submissions for some teams. Only 25% (nine of 36) of the registered teams completed the challenge and submitted test set results. Although the specific reasons for the low submission rate are not known, communications between challenge organizers and teams that failed to submit final results indicated time limitations were a major factor. In addition, each team entered the challenge on a different date, resulting in variable time constraints per team, which likely contributed to differences in final model performances. A fourth limitation was that the inadvertent exposure to treatment outcomes caused one team to withdraw, highlighting the difficulty of running such a challenge (and maintaining necessary blinding) using a clinical trial data set, as publications emanating from the trial commonly require public sharing of the source data.
In summary, the BMMR2 challenge successfully resulted in imaging-based models with high performance for predicting response to NAC for breast cancer. The models developed by three participating teams demonstrated higher AUCs (based on point estimators of AUC) than the benchmark predictive model set by the ACRIN 6698 trial, from which the challenge data set was created. Although modeling approaches varied, all incorporated information was derived from multiparametric breast MRI examinations performed at midtreatment or earlier, with or without other clinical characteristics. Outcomes of the BMMR2 challenge provide further compelling evidence of the value of functional breast MRI as an early marker of treatment response that may aid in critical escalation and de-escalation decisions. Future goals are to incorporate and validate highly predictive models developed through the challenge in prospective clinical trials.
Acknowledgments
Acknowledgments
We would like to acknowledge the individuals and institutions that have made this collection possible. We thank the patients who have volunteered to participate in the ACRIN 6698 and I-SPY 2 trials. We would like to thank the extensive network of I-SPY 2 investigators, patient advocates, study coordinators, and I-SPY 2 site radiology teams that have contributed substantially to the value of this challenge.
Supported by National Institutes of Health funding: U01 CA225427, R01 CA132870, U01 CA180820, U01 CA180794, R01 CA248192, 5R01CA197000-05, 5P30CA006973, U01CA140204, U24CA226110, U01CA142565, and U01CA174706. Doctoral grant of the Spanish Ministry of Innovation and Science FPU17/01993, Defense Advanced Research Projects Agency (DARPA) under contract no. HR00112190130, Cancer Prevention and Research Institute of Texas (CPRIT) for funding through CPRIT RR160005.
Data sharing: Data generated by the authors or analyzed during the study are available at https://doi.org/10.7937/TCIA.KK02-6D95
Organizing team: U01 CA225427 and R01 CA132870 (N.M.H.), U01 CA180820 and U01 CA180794 (ECOG-ACRIN Cancer Research Group), R01 CA248192 (S.C.P.).
Team A: National Institutes of Health 5R01CA197000–05. This was a true team project, with valuable contributions from Rhea Chitalia, Snekha Thakran, Alex Nguyen, Hannah Horng, Elizabeth S. McDonald, Michael Feldman, and Angela DeMichele.
Team B: Amir Egozi and Efrat Hexter from IBM Research Israel, who made significant contributions to the team’s models.
Team C: Doctoral grant of the Spanish Ministry of Innovation and Science FPU17/01993. Dimitrios Bounias and Michael Baumgartner made equal contributions to the team’s model.
Team E: 5P30CA006973 (Imaging Response Assessment Team [IRAT]), U01CA140204, and Defense Advanced Research Projects Agency (DARPA) under contract no. HR00112190130.
Team G: Gratefully acknowledges the support of the National Cancer Institute through U24CA226110, U01CA142565, and U01CA174706 and the support of the Cancer Prevention and Research Institute of Texas (CPRIT) for funding through CPRIT RR160005. T.E.Y. from team G is a CPRIT Scholar of Cancer Research.
Disclosures of conflicts of interest: W.L. No relevant relationships. S.C.P. Grants from NIH/National Cancer Institute ((R01 CA248192, U01 CA225427) paid to institution; research grants from GE HealthCare paid to institution; single payment for consulting from Guerbet; honoraria for grand rounds lecture from Stanford University; honoraria for invited lecture from Global Breast Cancer Conference; payment for grant review panel from DOD CDMRP Programmatic Review Panel and NIH Study Section; travel reimbursement for attending meeting (ECOG-ACRIN); travel reimbursement for attending grant review panel (NIH/NCI); travel reimbursement for attending grant review panel (DOD CDMRP); travel reimbursement for attending meetings (Society of Breast Imaging and Global Breast Cancer Conference); patent submitted June 29, 2022 (application 63/356,977), under review; title: Using a Thermal Camera for Detection of Arthritis; scientific advisory board/consultant for Multisite Clinical Screening Trial (NCT03835897) for Seoul National University Hospital; co-chair of executive committee for NIH/NCI Quantitative Imaging Network (unpaid); co-chair of Imaging Working Group Diffusion Subgroup for I-SPY 2 Treatment Trial (unpaid); in-kind research support to institution from Philips Healthcare, Microsoft AI for Good, and Guerbet; associate editor of Radiology: Imaging Cancer. D.C.N. Grant support to institution from National Institutes of Health/NCI grants U01 CA225427 and R01 CA132870 and National Institutes of Health/Quantum Leap Healthcare Collaborative (I-SPY2 TRIAL sponsor). J.S. No relevant relationships. H.S.M. ECOG-ACRIN grant. P.J.B. NIH EB029985. M.H. No relevant relationships. B.A.B. No relevant relationships. J.K.C. NIH/NCI grants and Leidos contract to institution; contracts/grants from GE and Genetech to institution; AI software for diagnosis of retinopathy of prematurity licensed to BostonAI; consultant to Siloam Vision; deputy editor for Radiology: Artificial Intelligence. M.A.B. Grant 5U24CA180803. X.T. No relevant relationships. J.Z. No relevant relationships. J.C. No relevant relationships. D.K. National Institutes of Health (NIH R01 CA197000); honoraria for invited presentations from Memorial Sloan Kettering Cancer Center, Stanford University, and Society of Breast Imaging; support for traveling to meetings from University of Hawaii, Society of Breast Imaging, and SPIE Medical Imaging Symposium; deputy editor for Radiology: Artificial Intelligence. E.A.C. No relevant relationships. W.C.M. No relevant relationships. M.L. No relevant relationships. R.H. No relevant relationships. O.J.P.V. No relevant relationships. K.M.H. No relevant relationships. S.R.C. No relevant relationships. T.T. No relevant relationships. M.O.F. No relevant relationships. V.S.P. No relevant relationships. M.A.J. Grants U01CA140204, P30CA006973, DARPA HR00112190130; U01DK127400, and 1R01HL149742; royalties or license from US patents 8,380,286, 8,380,281; patents planned, issued, or pending: US patent 8,380,286, 8,380,281, 9,008,462, 9,256,966, 20,160,132,754, 10,388,017 B2, 11324469 B2, WO2013177586, WO2015017632, WO2015164517, and WO2022225794A1; editorial board of Expert Review of Precision Medicine and Drug Development; editorial board of Radiology. R.Y. No relevant relationships. K.S. No relevant relationships. A.S.K. No relevant relationships. J.C.D. National Cancer Institute funding U24CA226110, U01CA142565, and U01CA174706; Cancer Prevention and Research Institute of Texas (CPRIT) funding through CPRIT RR160005; co-chair of the Quantitative Imaging Network MRI working group (unpaid). T.E.Y. No relevant relationships. T.L.C. Grant from NIH (funding is to develop technology with MRI vendors to improve diffusion MRI, including breast DWI); co-inventor of intellectual property assigned to and managed by the University of Michigan (UM). UM has licensed this technology to MRI vendors (no royalties received from this IP); US Patent # 9,851,426 B2 (relates to improvement of diffusion MRI, though this technology was not relevant for this submitted article); co-chair of MR Coordinating Committee of Quantitative Imaging Biomarker Alliance (QIBA) of the RSNA (unpaid); associate editor for Radiology: Imaging Cancer. N.M.H. Grants from General Electric Medical Systems, National Institutes of Health, Quantum Leap Healthcare Collaborative (I-SPY2 TRIAL sponsor) paid to institution; National Institutes of Health (grant numbers U01 CA225427, R01 CA132870, and P01 CA210961) paid to institution; Quantum Leap Healthcare Collaborative (I-SPY2 TRIAL sponsor); member of RSNA Science Council.
Abbreviations:
- ACRIN
- American College of Radiology Imaging Network
- ADC
- apparent diffusion coefficient
- AUC
- area under the receiver operating characteristic curve
- BMMR2
- Breast Multiparametric MRI for prediction of NAC Response
- DCE
- dynamic contrast-enhanced
- DWI
- diffusion-weighted imaging
- FTV
- functional tumor volume
- HER2
- human epidermal growth factor receptor 2
- HR
- hormone receptor
- NAC
- neoadjuvant chemotherapy
- pCR
- pathologic complete response
- TCIA
- The Cancer Imaging Archive
References
- 1. World Health Organization . Breast cancer . https://www.who.int/news-room/fact-sheets/detail/breast-cancer. Published 2022. Accessed March 23, 2022 .
- 2. Breastcancer.org . Breast cancer facts and statistics . https://www.breastcancer.org/facts-statistics Published 2022. Accessed December 13, 2023 .
- 3. Partridge SC , Zhang Z , Newitt DC , et al . Diffusion-weighted MRI findings predict pathologic response in neoadjuvant treatment of breast cancer: the ACRIN 6698 multicenter trial . Radiology 2018. ; 289 ( 3 ): 618 – 627 . [DOI] [PMC free article] [PubMed] [Google Scholar]
- 4. Newitt DC , Amouzandeh G , Partridge SC , et al . Repeatability and reproducibility of ADC histogram metrics from the ACRIN 6698 breast cancer therapy response trial . Tomography 2020. ; 6 ( 2 ): 177 – 185 . [DOI] [PMC free article] [PubMed] [Google Scholar]
- 5. McDonald ES , Romanoff J , Rahbar H , et al . Mean apparent diffusion coefficient is a sufficient conventional diffusion-weighted MRI metric to improve breast MRI diagnostic performance: results from the ECOG-ACRIN Cancer Research Group A6702 diffusion imaging trial . Radiology 2021. ; 298 ( 1 ): 60 – 70 . [DOI] [PMC free article] [PubMed] [Google Scholar]
- 6. Prevedello LM , Halabi SS , Shih G , et al . Challenges related to artificial intelligence research in medical imaging and the importance of image analysis competitions . Radiol Artif Intell 2019. ; 1 ( 1 ): e180031 . [DOI] [PMC free article] [PubMed] [Google Scholar]
- 7. Newitt DC , Zhang Z , Gibbs JE , et al . Test-retest repeatability and reproducibility of ADC measures by breast DWI: Results from the ACRIN 6698 trial . J Magn Reson Imaging 2019. ; 49 ( 6 ): 1617 – 1628 . [DOI] [PMC free article] [PubMed] [Google Scholar]
- 8. Newitt DC , Partridge SC , Zhang Z , et al . The Cancer Imaging Archive . ACRIN 6698/I-SPY 2 Breast DWI [data set] . 10.7937/tcia.kk02-6d95. Published 2021. Accessed December 13, 2023 . [DOI] [Google Scholar]
- 9. Maier-Hein L , Eisenmann M , Reinke A , et al . Why rankings of biomedical image analysis competitions should be interpreted with care . Nat Commun 2018. ; 9 ( 1 ): 5217 . [Published correction appears in Nat Commun 2019;10(1):588.] [DOI] [PMC free article] [PubMed] [Google Scholar]
- 10. Hylton NM , Blume JD , Bernreuter WK , et al . Locally advanced breast cancer: MR imaging for prediction of response to neoadjuvant chemotherapy--results from ACRIN 6657/I-SPY TRIAL . Radiology 2012. ; 263 ( 3 ): 663 – 672 . [DOI] [PMC free article] [PubMed] [Google Scholar]
- 11. Zheng G , Chu C , Belavý DL , et al . Evaluation and comparison of 3D intervertebral disc localization and segmentation methods for 3D T2 MR data: a grand challenge . Med Image Anal 2017. ; 35 : 327 – 344 . [DOI] [PubMed] [Google Scholar]
- 12. Setio AAA , Traverso A , de Bel T , et al . Validation, comparison, and combination of algorithms for automatic detection of pulmonary nodules in computed tomography images: the LUNA16 challenge . Med Image Anal 2017. ; 42 : 1 – 13 . [DOI] [PubMed] [Google Scholar]
- 13. Bron EE , Smits M , van der Flier WM , et al . Standardized evaluation of algorithms for computer-aided diagnosis of dementia based on structural MRI: the CADDementia challenge . Neuroimage 2015. ; 111 : 562 – 579 . [DOI] [PMC free article] [PubMed] [Google Scholar]
- 14. Bakas S , Reyes M , Jakab A , et al . Identifying the best machine learning algorithms for brain tumor segmentation, progression assessment, and overall survival prediction in the {BRATS} challenge . arXiv 1811.02629 [preprint] https://arxiv.org/abs/1811.02629. Published November 5, 2018. Accessed December 13, 2023 . [Google Scholar]
- 15. MICCAI/M.D . Anderson Cancer Center Head and Neck Quantitative Imaging Working Group . Matched computed tomography segmentation and demographic data for oropharyngeal cancer radiomics challenges . Sci Data 2017. ; 4 ( 1 ): 170077 . [DOI] [PMC free article] [PubMed] [Google Scholar]
- 16. Galbán CJ , Ma B , Malyarenko D , et al . Multi-Site Clinical Evaluation of DW-MRI as a Treatment Response Metric for Breast Cancer Patients Undergoing Neoadjuvant Chemotherapy . PLoS One 2015. ; 10 ( 3 ): e0122151 . [DOI] [PMC free article] [PubMed] [Google Scholar]
- 17. van der Hoogt KJJ , Schipper RJ , Winter-Warnars GA , et al . Factors affecting the value of diffusion-weighted imaging for identifying breast cancer patients with pathological complete response on neoadjuvant systemic therapy: a systematic review . Insights Imaging 2021. ; 12 ( 1 ): 187 . [DOI] [PMC free article] [PubMed] [Google Scholar]
- 18. Gilad M , Freiman M . PD-DWI: Predicting response to neoadjuvant chemotherapy in invasive breast cancer with physiologically-decomposed diffusion-weighted MRI machine-learning model . In: Wang L , Dou Q , Fletcher PT , Speidel S , Li S , eds. Medical Image Computing and Computer Assisted Intervention – MICCAI 2022 . MICCAI 2022. Lecture Notes in Computer Science , vol 13433 . Cham, Switzerland: : Springer; , 2022. ; 36 – 45 . [Google Scholar]
- 19. Zwanenburg A , Leger S , Agolli L , et al . Assessing robustness of radiomic features by image perturbation . Sci Rep 2019. ; 9 ( 1 ): 614 . [DOI] [PMC free article] [PubMed] [Google Scholar]
- 20. Parekh VS , Macura KJ , Harvey SC , et al . Multiparametric deep learning tissue signatures for a radiological biomarker of breast cancer: preliminary results . Med Phys 2020. ; 47 ( 1 ): 75 – 88 . [DOI] [PMC free article] [PubMed] [Google Scholar]
- 21. Jacobs MA , Umbricht CB , Parekh VS , et al . Integrated multiparametric radiomics and informatics system for characterizing breast tumor characteristics with the OncotypeDX gene assay . Cancers (Basel) 2020. ; 12 ( 10 ): 2772 . [DOI] [PMC free article] [PubMed] [Google Scholar]
- 22. Kazerouni AS , Hormuth DA 2nd , Davis T , et al . Quantifying tumor heterogeneity via MRI habitats to characterize microenvironmental alterations in HER2+ breast cancer . Cancers (Basel) 2022. ; 14 ( 7 ): 1837 . [DOI] [PMC free article] [PubMed] [Google Scholar]


