

Abstract
Objective:
We performed a systematic review of the epidemiology literature to identify the male reproductive effects associated with phthalate exposure.
Data sources and study eligibility criteria:
Six phthalates were included in the review: di(2-ethylhexyl) phthalate (DEHP), diisononyl phthalate (DINP), dibutyl phthalate (DBP), diisobutyl phthalate (DIBP), butyl benzyl phthalate (BBP), and diethyl phthalate (DEP). The initial literature search (of PubMed, Web of Science, and Toxline) included all studies of male reproductive effects in humans, and outcomes were selected for full systematic review based on data availability.
Study evaluation and synthesis methods:
For each outcome, studies were evaluated using criteria defined a priori for risk of bias and sensitivity by two reviewers using a domain-based approach. Evidence was synthesized by outcome and phthalate and strength of evidence was summarized using a structured framework.
Results:
The primary outcomes reviewed here are (number of included/excluded studies in parentheses): anogenital distance (6/1), semen parameters (15/9), time to pregnancy (3/5), testosterone (13/8), timing of pubertal development (5/15), and hypospadias/cryptorchidism (4/10). Looking at the overall hazard, there was robust evidence of an association between DEHP and DBP exposure and male reproductive outcomes; this was based primarily on studies of anogenital distance, semen parameters, and testosterone for DEHP and semen parameters and time to pregnancy for DBP. There was moderate evidence of an association between DINP and BBP exposure and male reproductive outcomes based on testosterone and semen parameters for DINP and semen parameters and time to pregnancy for BBP. DIBP and DEP were considered to have slight evidence of an association. For DIBP, the less conclusive evidence was attributed to a more limited literature base (i.e., fewer studies) and lower exposure levels in the population, decreasing the ability to observe an effect. For DEP, the findings were consistent with experimental animal data that suggest DEP does not haves as strong an anti-androgenic effect as other phthalates.
Conclusions and implications of key findings:
Overall, despite some inconsistencies across phthalates in the specific outcomes associated with exposure, these results support that phthalate exposure at levels seen in human populations may have male reproductive effects, particularly DEHP and DBP. The relative strength of the evidence reflects differing levels of toxicity as well as differences in the range of exposures studied and the number of available studies.
The views expressed are those of the authors and do not necessarily represent the views or policies of the U.S. EPA.
1. Introduction
Phthalic acid diesters (phthalates) are a class of manmade and multifunction chemicals used in a wide array of consumer and industrial products, including as plasticizers in polyvinyl chloride plastics, excipients in some medications, and scent retainers in some personal care products. Human exposure is ubiquitous across the lifespan, including in utero through maternal exposures. Ingestion, inhalation, and dermal contacts are also routes of exposure for the general population (Johns et al., 2015). After exposure, phthalate diesters are rapidly metabolized to monoester metabolites and excreted in the urine. The group of phthalates encompasses a variety of compounds with different structures, properties, and use. The phthalates, that are the focus of this paper are: di(2-ethylhexyl) phthalate (DEHP), diisononyl phthalate (DINP), dibutyl phthalate (DBP), diisobutyl phthalate (DIBP), butyl benzyl phthalate (BBP), and diethyl phthalate (DEP). Within this group, there are phthalates that are structurally similar and moderately correlated based on human biomonitoring data (e.g., DBP and DiBP). Other are phthalates differ considerably (e.g., long vs short chain; DEP and DEHP); correlations between these phthalates are typically low (Johns et al., 2015).
Phthalates have well documented anti-androgenic activity in rodent studies resulting in reduced circulating testosterone and male reproductive tract abnormalities (Johnson et al., 2012; Howdeshell et al., 2008). Individual studies and reviews in humans and animals, including a recent report from the National Academies of Science (National Academies of Sciences, Engineering, and Medicine, 2017), have investigated male reproductive effects of phthalate exposure, but have not looked across the full spectrum of male reproductive effects (i.e., from exposures and outcomes during different lifestages, including fetal development, infancy, childhood, puberty, and sexually mature life-stages) in epidemiological studies for DEHP, DINP, DBP, DIBP, BBP, and DEP. Five of the selected phthalates (DEHP, DINP, DBP, DIBP, and BBP) were chosen because they are the most potent with respect to producing the “phthalate syndrome” of male reproductive effects in rats (National Research Council, 2008)and their metabolites have been frequently observed in human populations studies; DEP is not one of the “phthalate syndrome” compounds but was included because it is often the phthalate to which humans have the highest exposure.
We performed a systematic review of the epidemiology literature with the goal of evaluating the strength of evidence of the association between phthalate exposure and male reproductive effects, including the following outcomes: anogenital distance, semen parameters, time to pregnancy (male exposure), testosterone, timing of pubertal development, and hypospadias/cryptorchidism. The human health relevance of these outcomes is summarized briefly in Table 1. These outcomes include a variety of measures relevant to different life-stages: anogenital distance and hypospadias/cryptorchidism may reflect exposure or responsiveness to testosterone during fetal development, pubertal development depends on the functioning of multiple hormonal pathways, and semen parameters and time to pregnancy, measured in adults, are indicators of fertility. Infertility, defined as the inability to conceive after 12 months of unprotected intercourse, has been estimated to affect 15% of couples, and male-related factors are implicated in approximately 20–50% of these cases (Agarwal et al., 2015).
Table 1.
Primary outcomes included in the systematic review.
| Outcome | Background and relevance to male reproductive toxicity |
|---|---|
| Anogenital distance (AGD) |
|
| Semen parameters |
|
| Time to pregnancy |
|
| Testosterone |
|
| Hypospadias/cryptorchidism |
|
| Pubertal development |
|
2. Methods
2.1. Literature search and screening
The literature search and screening, study evaluation, data extraction, and evidence synthesis methods are described in detail in the systematic review protocol (Supplemental materials, Section 3). Briefly, epidemiology studies were identified by conducting a single broad literature search on all six phthalates of interest (DEHP, DINP, DBP, DIBP, BBP, DEP) and all outcomes. The Population, Exposure, Comparators, and Outcome (PECO) are available in the protocol (Section 2). The following databases were searched: PubMed, Web of Science, and Toxline, initially in 2013, with updates every 6–12 months through January 2017. Forward and backward searches were also performed. Title/abstract and full text screening was performed by two reviewers.
2.2. Study evaluation
Studies were evaluated by at least two reviewers using uniform approaches for each group of similar studies. Key concerns were risk of bias (factors that affect the magnitude or direction of effect) and insensitivity (factors that limit the ability of a study to detect a true effect) (Cooper et al., 2016). Evaluation was conducted for the following domains: exposure measurement, outcome ascertainment, participant selection, confounding, analysis, sensitivity, and selective reporting. Phthalate and outcome-specific criteria were developed prior to evaluation. For exposure, most of the available studies relied on phthalate metabolite biomarkers (a list of metabolites for each phthalate is provided in the protocol, Section 1.3). Different criteria were developed for short-chain (DEP, DBP, DIBP, BBP) and long-chain (DEHP, DINP) phthalates due to better reliability of single measures for short-chain phthalates. Measurement in urine was considered to be the best proxy of exposure (Johns et al., 2015). Biomarker measures based on samples other than urine (e.g., blood, amniotic fluid, breast milk) were considered to be critically deficient for all short-chain phthalates and for primary metabolites (e.g., MEHP, MINP) of long-chain phthalates (Johns et al., 2015). Rationale for these criteria and additional details for all domains are available in the protocol (Section 4.1.1) and an abbreviated version is available in the key methods supplement. For each study, in each evaluation domain, reviewers reached a consensus rating regarding the utility of the study for hazard identification, with categories of Good, Adequate, Deficient, or Critically deficient. These ratings were then combined to reach an overall study confidence classification of High, Medium, Low, or Uninformative. Studies were evaluated for their suitability for each outcome investigated, and could receive different ratings for each outcome. Descriptions of each of the categories can be found in the protocol in supplemental materials (Section 4) and the key methods supplement. Study evaluations were documented in Health Assessment Workspace (HAWC), and ratings and rationale are publicly available.
2.3. Evidence synthesis
After study evaluation, the evidence for each outcome was synthesized separately for each phthalate, using the following aspects of an association that may suggest causation: consistency, exposure-response relationship, strength of association, temporal relationship, biological plausibility, and coherence. Based on this synthesis, the evidence was assigned a strength of evidence conclusion of Robust, Moderate, Slight, Indeterminate, or Compelling evidence of no effect. Robust and Moderate describe evidence that supports a hazard, differentiated by the quantity and quality of information available to rule out alternative explanations for the results. Slight and Indeterminate describe evidence that could support a hazard, or could support the absence of a hazard. These categories are generally limited in terms of quantity or confidence level of studies, and serve to encourage additional research across the exposure range experienced by humans. Compelling evidence of no effect requires several high confidence studies with consistent null results. The ratings for the individual outcomes were then summarized into an overall conclusion for male reproductive effects by phthalates, using a structured framework available in the key methods supplement and the protocol (Section 6). No statistical quantitative meta-analysis was performed due to substantial differences across studies.
3. Results
An abbreviated version of the literature flow diagram is shown in Fig. 1. Full results of the literature search and screen are described in Supplemental materials. For each outcome, the studies included and excluded based on study evaluation are described in the respective section.
Fig. 1.
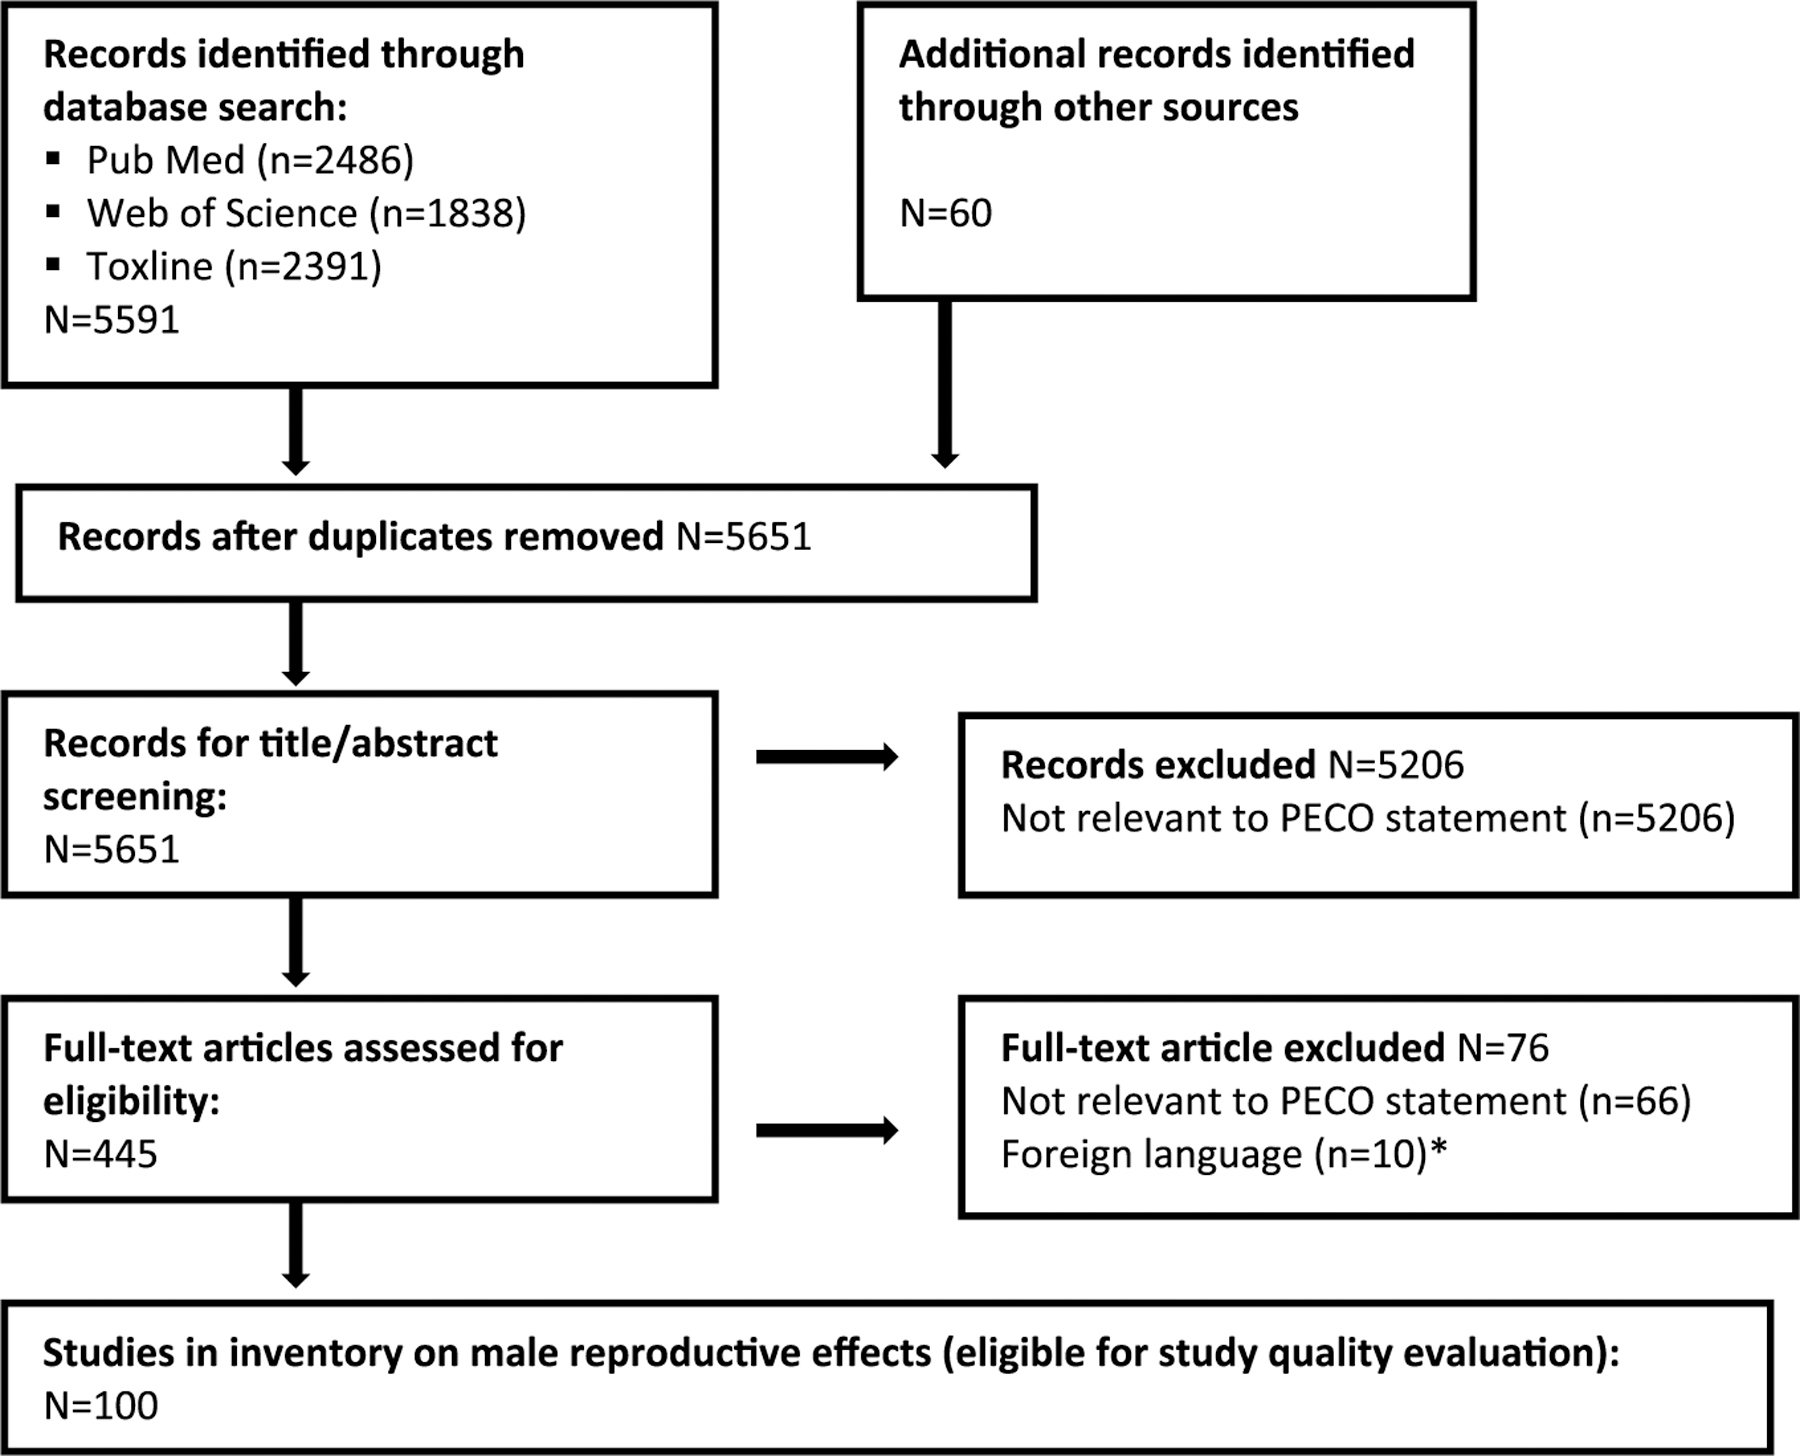
Literature flow diagram for male reproductive effects of phthalates.
*Did not include studies on male reproductive effects.
3.1. Anogenital distance
3.1.1. Study selection and evaluation
Based on the exposure evaluation strategy described in the protocol (Section 4.1.1), one study (Huang et al., 2009) was excluded because it was based on the measurement of phthalate metabolites in amniotic fluid. The specific phthalate metabolites examined in the remaining seven papers (describing six studies) and the study evaluations are summarized in Table 2 and full rationale are available at https://hawcprd.epa.gov/summary/visual/100000001/.
Table 2.
Epidemiology studies of AGD.
| Included | Reference | Study description | Includes metabolites of: | Study evaluation | ||||||||||||
| Population | Exposure | Outcome | DEHP | DINP | DBP | DIBP | BBP | DEP | Exposure | Outcome | Selection | Confounding | Analysis | Overall confidence | ||
| (Bornehag et al., 2015) | Birth cohort (N=196 boys) in Sweden | Single urine sample (1st trimester) | AGD at 19–21 mo | ✓ | ✓ | ✓ | ✓ | ✓ | A/P | G | G | A | G | Medium | ||
| (Bustamante-Montes et al., 2013) | Birth cohort (N=73 boys) in Mexico | Single urine sample (3rd trimester) | AGD at 1–2 d | ✓ | ✓a | ✓ | ✓ | P | G | A | A | G | Low | |||
| (Jensen et al., 2016) | Birth cohort (N=273 boys) in Denmark | Single urine sample (26–30 wk gestation) | AGD at 3 mo | ✓ | ✓ | ✓ | ✓ | ✓ | ✓ | A/P | G | G | A | G | Medium | |
| (Suzuki et al., 2012) | Birth cohort (N=73 boys) in Japan | Single urine sample (3rd trimester) | AGD at 1–3 d | ✓ | ✓ | ✓ | ✓ | P | A | P | P | A | Low | |||
| (Swan, 2008) | Birth cohort (N=106 boys) in U.S. | Single urine sample (mean 28 wk gestation) | AGD at mean 13 mo (range 1–36) | ✓ | ✓ | ✓ | ✓ | ✓ | A/P | P | G | A | P | Low | ||
| (Swan et al., 2015) | Birth cohort (N=365 boys) in U.S. | Single urine sample (1st trimester) | AGD at 1–2 d | ✓ | ✓ | ✓ | ✓ | ✓ | ✓ | A/P | G | A | A | A | Medium | |
| Total Studies per Phthalate | 6 | 3 | 5 | 3 | 5 | 5 | ||||||||||
| Excluded | Reference | Reason for Exclusion | ||||||||||||||
| (Huang et al., 2009) | Critical deficiency in exposure measure (exposure based on amniotic fluid measures) | |||||||||||||||
G = good; A = adequate; D = deficient; A/D = adequate for short chain phthalates, deficient for long chain phthalates.
Study was considered critically deficient for this phthalate due to a high percent below the limit of detection (LOD).
All included studies are birth cohorts, varying in size between 73 and 738 mother-child pairs in the analysis sample. All but one were limited to male offspring; (Swan et al., 2015) included both male and female offspring and stratified the analysis by sex. All of the studies were downgraded for exposure assessment as exposure was based on a single spot urine sample. The timing of collection (1st, 2nd, or 3rd trimester) varied among the studies; this variability was not considered to be a basis for downgrading the confidence in the results because the correlation in measures across trimesters is relatively high (Johns et al., 2015). The (Bustamante-Montes et al., 2013) analysis was limited by the fact that MBP, MBzP, and MEP were detected in ≤10% of samples, which is inconsistent with results of biomonitoring studies globally. The corresponding reduction in sensitivity contributed to the overall low confidence rating of this study. Limitations of the (Swan, 2008) paper (an extension of the initial study on this topic published by Swan et al., 2015) include a wide age range (1–36 months) and lack of information on the measurement evaluation strategy and standardization and reliability of measures across the different centers. Three studies were classified as medium confidence (Bornehag et al., 2015; Swan et al., 2015; Jensen et al., 2016), and the remaining three were classified as low confidence.
3.1.2. Results
Fig. 2 provides a comparison of regression coefficients (plotted against the median of exposure for each study) for the three medium confidence studies (Bornehag et al., 2015; Swan et al., 2015; Jensen et al., 2016). Because some of the studies used a natural logarithm (ln) transformation of the phthalate metabolite variables and others used a log10 transformation, the regression coefficients in Swan et al., 2015 and Swan, 2008 with log10 transformations were recalculated (divided by ln10) to make the results directly comparable. Fig. 2 also summarizes in tabular format results (recalculated if applicable) from all studies with the relevant metabolite, including low confidence studies.
Fig. 2.
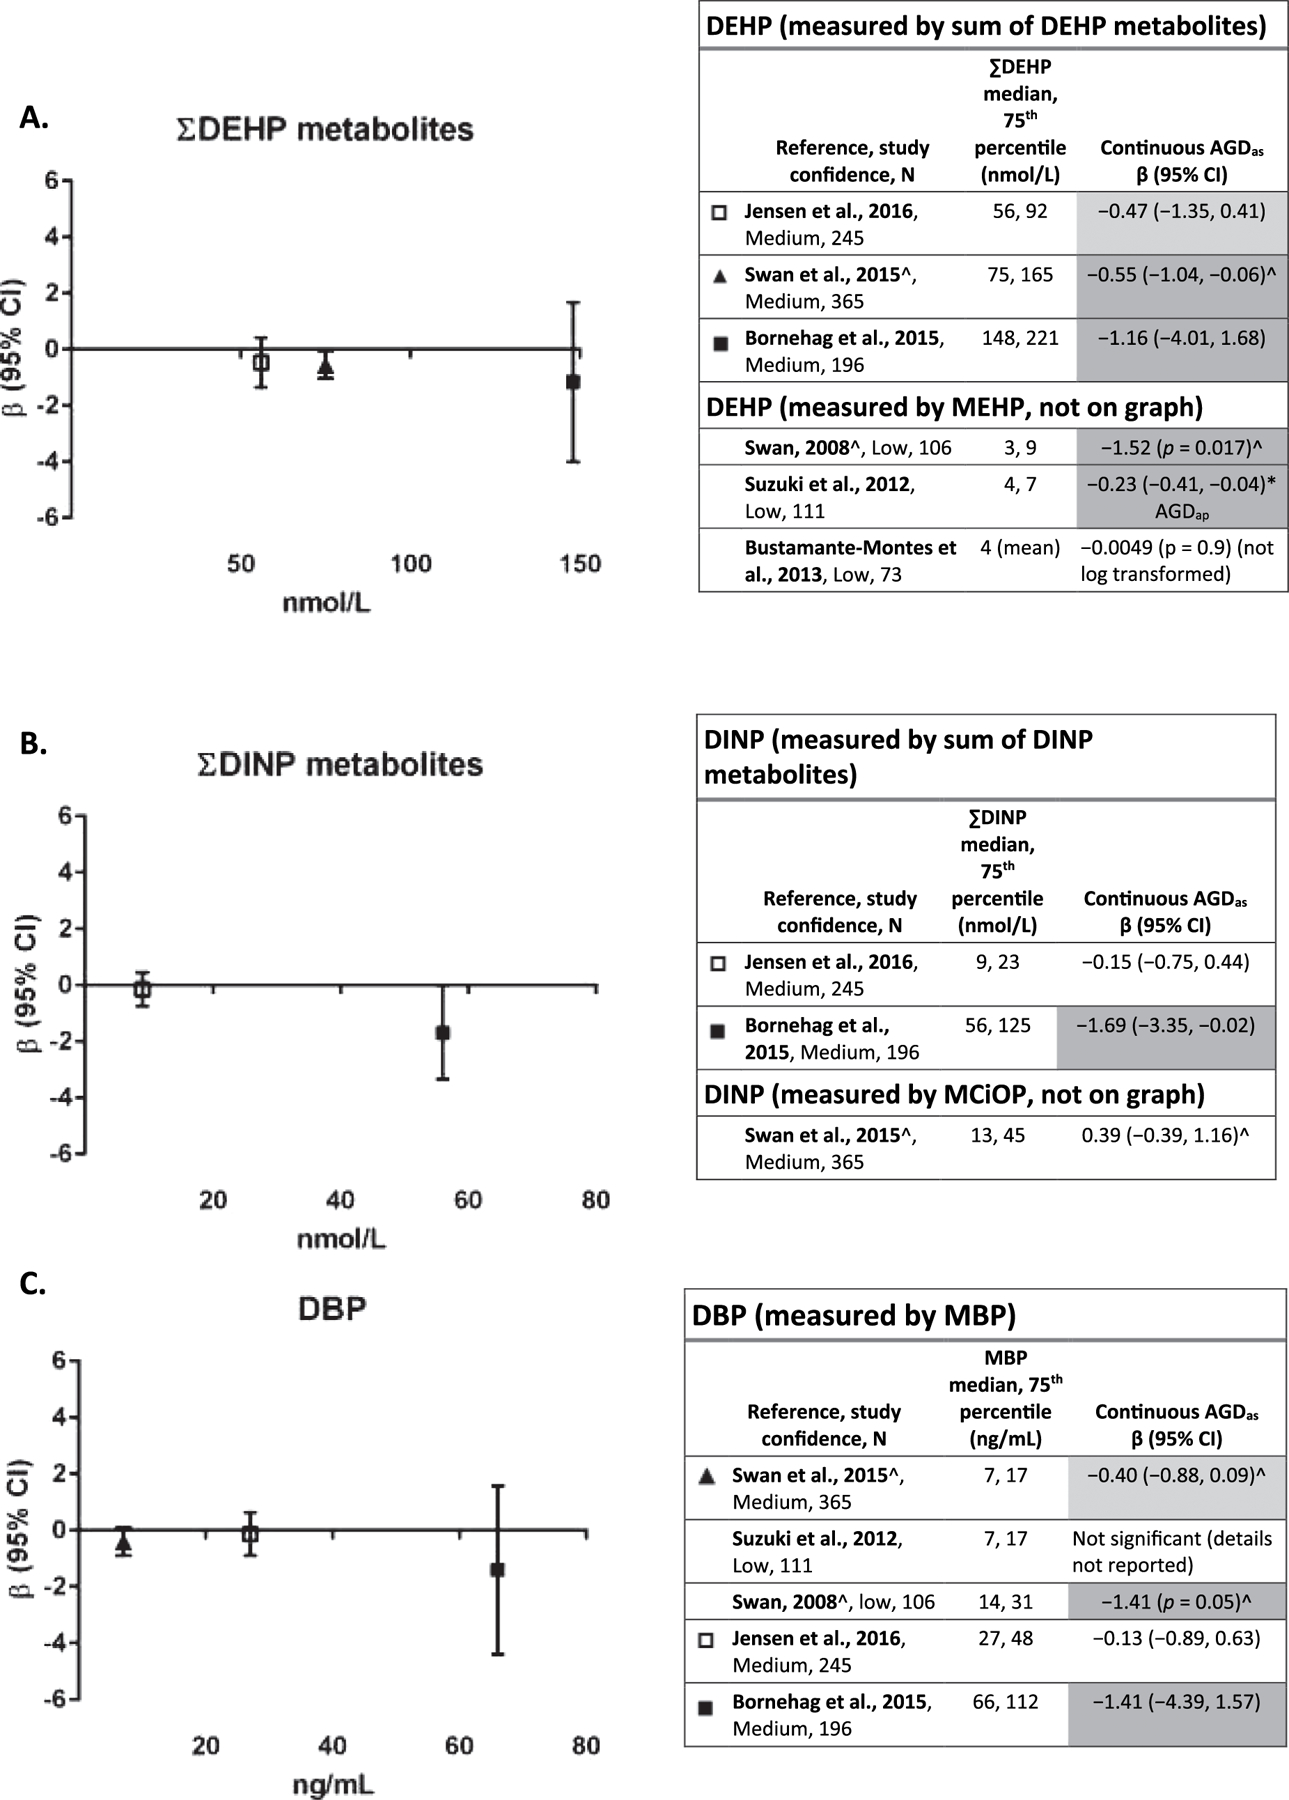
A–F. Association between phthalate metabolite levels measured in maternal urine samples during pregnancy and AGD in boys.
*p < 0.05, results that support an association are shaded. Dark gray represents one or more of the following: p < 0.05, large effect size (e.g., OR ≥ 1.5, β ≥ − 0.5), or exposure-response trend across categories of exposure. Light gray represents other supportive results.
^β recalculated to reflect ln transformation of metabolite (from log10).
‡Exposure levels from (Swan et al., 2015).
Exposure level on x-axis is population median for each study, and the axes are scaled the same for all phthalates to facilitate comparison of exposure levels, with the exception of DEHP and DINP, which were reported in nmol/L instead of ng/mL. Each panel depicts results for a metabolite(s) from a different parent phthalate. Studies within each phthalate are sorted by exposure levels. Effect estimates are change in anogenital distance in mm per ln-unit of exposure.
Evaluation of the evidence for an association between exposure to DEHP and AGD is based on six studies (Fig. 2A). The study with the highest exposure levels for the sum of DEHP metabolites (Bornehag et al., 2015) reported the strongest negative association between DEHP exposure and AGD, and the study with the lowest exposure levels (Jensen et al., 2016) reported the weakest association of the three medium confidence studies. (Swan et al., 2015) and (Swan, 2008) also reported statistically significant negative associations with sum DEHP (Swan et al., 2015) and MEHP (Swan, 2008; Swan et al., 2015). Given the consistency across medium confidence studies, evidence of a relationship between AGD and DEHP exposure is considered moderate.
Three studies (Bornehag et al., 2015; Swan et al., 2015; Jensen et al., 2016) investigated the association between DINP exposure and AGD (Fig. 2B). (Bornehag et al., 2015), a medium confidence study, reported a statistically significant association between shorter AGD with increasing DINP exposure (summed metabolites), while the other two medium confidence studies (Swan et al., 2015; Jensen et al., 2016) reported no association between DINP exposure and AGD. The association was observed in the study with the highest exposure levels, which is consistent with a dose response; however, due to the limited number and lack of consistency in the other studies, this evidence is considered slight.
The same five studies presented results on the association between DBP (measured by MBP) exposure and AGD (Fig. 2C). (Bornehag et al., 2015) again reported the strongest inverse association between AGD and DBP exposure and the highest exposure levels of MBP in this group of studies. Both (Swan et al., 2015) and (Swan, 2008) also reported inverse associations, with the latter being statistically significant. The remaining two studies reported no association. This evidence is considered moderate.
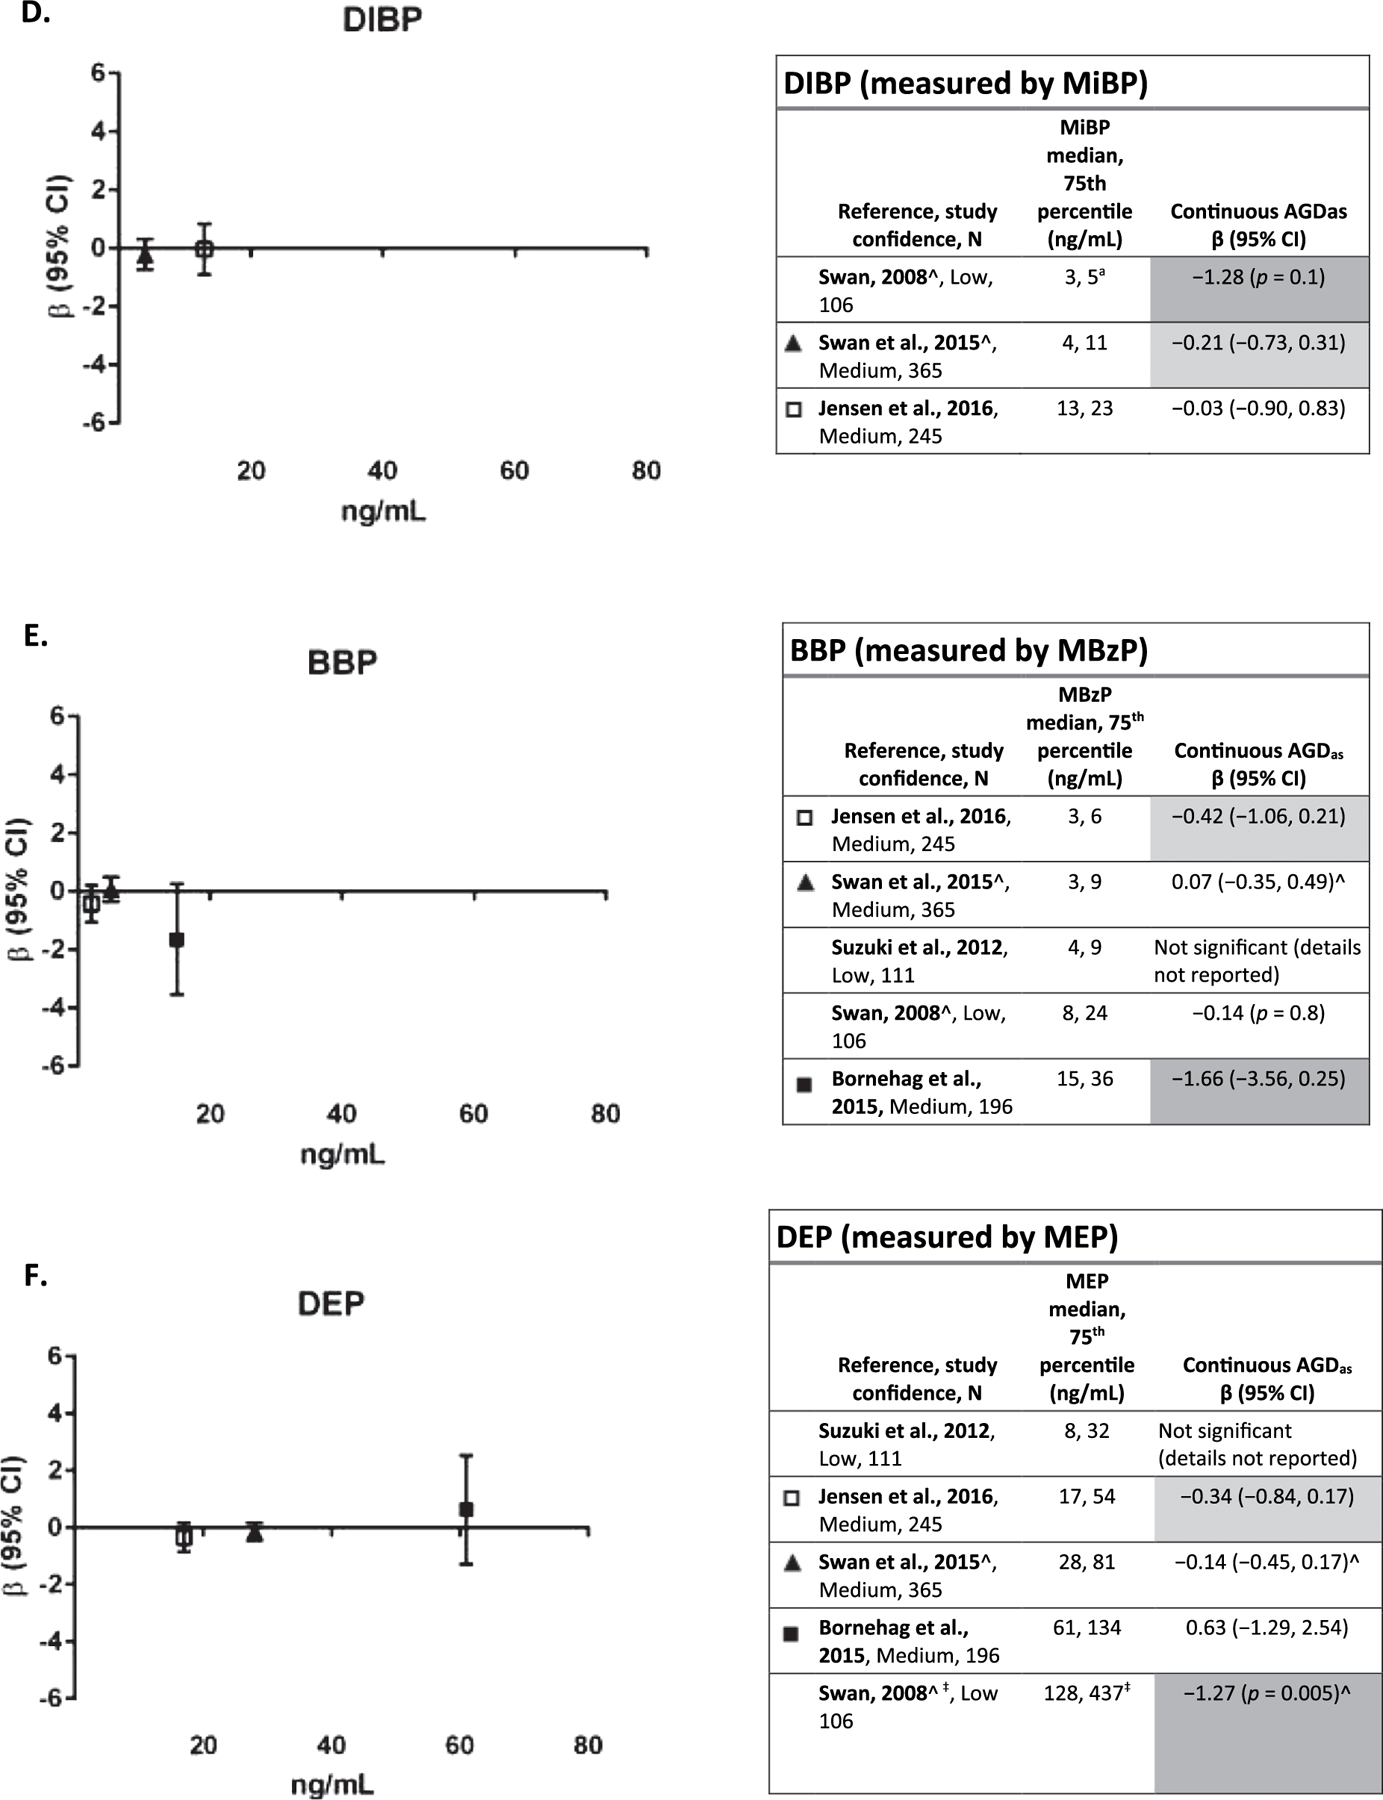
Three studies (Swan et al., 2015; Jensen et al., 2016; Swan, 2008) that examined the association between DIBP (measured by MIBP) and AGD were available (Fig. 2D). (Swan, 2008), a low confidence study, and Swan et al., 2015, a medium confidence study reported inverse associations, but neither were statistically significant, and the effect size in the latter study was small. The other medium confidence study, with higher exposure levels, reported no association. The low exposure levels in all three studies may have decreased sensitivity. This evidence is considered slight.
Five studies (Bornehag et al., 2015; Swan et al., 2015; Jensen et al., 2016; Swan, 2008; (Suzuki et al., 2012) presented results on the association between BBP (measured by MBzP) (Fig. 2E) exposure and AGD. Among three medium confidence studies, (Bornehag et al., 2015) and (Jensen et al., 2016) reported inverse associations, though neither was statistically significant; the larger effect estimate was seen in the study with higher exposure levels. (Swan et al., 2015) and the two low confidence studies (Suzuki et al., 2012; Swan, 2008) reported no association. This evidence is considered slight.
Five studies (Bornehag et al., 2015; Swan et al., 2015: Jensen et al., 2016; Swan, 2008; Suzuki et al., 2012) reported on the association between DEP exposure (measured by MEP) and AGD (Fig. 2E). In the three medium confidence studies, there was no evidence of an association. In addition, discordant results (i.e., one positive association and one inverse association) were observed in AGDAS and AGDAP (two different AGD measurements) in both (Jensen et al., 2016) and (Bornehag et al., 2015) (AGDAS result in figure, AGDAP results: Jensen et al., 2016): β = 0.02 (−0.54,0.58); (Bornehag et al., 2015): β = −1.30 (−3.40,0.81)). Since there is no evidence at this time that one of these AGD measures is a more sensitive measure of response to phthalate exposure, these study findings are considered inconsistent. One low confidence study, (Swan, 2008), reported a statistically significant inverse association between MEP and AGD. Overall, evidence is considered slight.
In summary, there is moderate evidence of an inverse association between AGD and exposure to DEHP and DBP, with mostly consistent results reported among the studies. Evidence for DINP, BBP, DIBP, and DEP is slight. The weaker evidence of an association for the DINP, BBP, and DIBP may be due to a combination of low exposure levels (i.e., poor sensitivity) and data availability (i.e., fewer available studies). While evidence for DEP was also rated slight, there were high exposure levels, so the relative lack of evidence of an association is consistent with experimental animal data that suggest that this phthalate does not have as strong an anti-androgenic effect as other phthalates. Additional studies, with higher confidence ratings, would be needed to draw a firm conclusion that DEP was not associated with AGD in humans.
3.2. Testosterone in infants
Testosterone plays an important role in the development of the male reproductive system and is therefore an important link between phthalates and other outcomes in this section, such as anogenital distance, hypospadias and cryptorchidism. Three studies (four papers) (Main et al., 2006) (Araki et al., 2016; Araki et al., 2014; Lin et al., 2011) examined the relationship between prenatal phthalate exposure and testosterone levels in newborn boys. Two studies (Main et al., 2006; Araki et al., 2014; Araki et al., 2016) were excluded due to the measurement of exposure in breast milk, blood, and cord blood, respectively, as described in the exposure evaluation strategy (see protocol Section 4.1.1). The remaining low confidence study (Lin et al., 2011) was a pregnancy cohort, with phthalate exposure measured in a single spot urine sample during the third trimester, and reproductive hormones measured in cord blood using appropriate methods. Among 81 male newborns, there was no association (Pearson’s correlation coefficients for free testosterone: MEP-0.10, MBP-0.11, MBzP 0.05, ∑DEHP 0.06, p-values for all > 0.1). This evidence is considered indeterminate.
3.3. Semen parameters
3.3.1. Study selection and evaluation
Based on the exposure evaluation, nine of the 28 epidemiology papers (Table 3) identified in the search with data on sperm parameters and exposure in adults were excluded because they used measurements of phthalates in tissues other than urine (i.e., blood or semen) or because of other critical deficiencies in methodology or reporting of results. The specific phthalates examined in the remaining 15 studies (19 papers) and their evaluations are summarized in Table 3 (Joensen et al., 2012; Kranvogl et al., 2014; Lenters et al., 2014; Pan et al., 2011, 2016; Pant et al., 2008, 2014; Toshima et al., 2012; Zhang et al., 2006). Full rationale are available at https://hawcprd.epa.gov/summary/visual/100000065/.
Table 3.
Epidemiology studies of semen parameters.
| Included | Reference | Study description | Includes metabolites of: | Study evaluation | ||||||||||||
| Population | Exposure | Outcome | DEHP | DINP | DBP | DIBP | BBP | DEP | Exposure | Outcome | Selection | Confounding | Analysis | Overall confidence | ||
| (Axelsson et al., 2015a) (Axelsson et al., 2015b) | Cross-sectional (N=314) in Sweden; men entering military | Single urine sample; subset with prenatal sample available | Concentration, motility, morphology by WHO guidelines | ✓ | ✓ | ✓ | ✓ | ✓ | A/P | A | A | A | A | Medium | ||
| (Bloom et al., 2015) | Cohort (N=375) in U.S.; men from couples trying to conceive | Single urine sample | Concentration, motility, morphology by WHO guidelines in two samples | ✓ | ✓ | ✓ | ✓ | ✓ | A/P | A | A | A | A | Medium | ||
| (Den Hond et al., 2015) | Case-control (N=40 cases reduced semen quality/80 controls) in Belgium | Single urine sample | Concentration, motility, morphology by WHO guidelines | ✓ | ✓ | ✓ | ✓ | ✓ | A/P | G | P | P | A | Low | ||
| (Han et al., 2014) | Cross-sectional (N=232) in China; general population | Single urine sample | Concentration, motility, morphology by WHO guidelines | ✓ | ✓ | ✓a | ✓ | A/P | G | P | A | A | Medium | |||
| (Hauser et al., 2006) | Cross-sectional (N=463) in U.S.; men from couples seeking infertility workup | Single urine sample | Concentration, motility, morphology by WHO guidelines | ✓ | ✓ | ✓ | ✓ | A/P | G | A | A | A | Medium | |||
| (Herr et al., 2009) | Cross-sectional (N=349) in Germany; men from couples seeking infertility workup | Single urine sample | Concentration, motility, morphology by WHO guidelines | ✓ | P | A | P | P | P | Low | ||||||
| (Huang et al., 2013) (Huang et al., 2011) | Cross-sectional (N=62) in Taiwan; factory workers and students | Single urine sample, occupational, air sampling | Concentration, motility, morphology by WHO guidelines | ✓ | A | A | A | P | A | Medium | ||||||
| (Jonsson et al., 2005) | Cross-sectional (N=234) in Sweden; men entering military | Single morning urine sample | Concentration, motility, morphology by WHO guidelines | ✓a | ✓ | ✓ | ✓ | A | A | A | P | A | Medium | |||
| (Jurewicz et al., 2013) | Cross-sectional (N=269) in Poland; men at infertility clinic | Single morning urine sample | Concentration, motility, morphology by WHO guidelines | ✓ | ✓ | ✓ | ✓ | ✓ | A/P | A | P | A | A | Medium | ||
| (Liu et al.,2012) | Cross-sectional (N=125) in China; men seeking fertility assessment | Two urine samples several days apart | Concentration, motility, morphology by WHO guidelines | ✓ | ✓ | ✓a | ✓ | G | G | P | P | A | Medium | |||
| (Pan et al., 2016); Pan et al., (2015) | Cross-sectional (N=1,066) in China; men seeking fertility assessment | Single urine sample | Concentration, motility, morphology by WHO guidelines | ✓ | ✓ | ✓ | ✓ | ✓ | ✓ | A/P | A | A | A | A | Medium | |
| (Specht et al., 2014) (Lenters et al., 2014) | Cross-sectional (N=589) in Greenland, Poland, Ukraine; men from couples at antenatal visit | Single blood sample (only used for secondary metabolites) | Concentration, motility, morphology by WHO guidelines | ✓ | ✓ | P | P | G | A | A | Medium | |||||
| Thurston et al. (2016) | Cross-sectional sample (N=420) of male partners from pregnancy cohort in U.S. | Single urine sample | Concentration, motility, morphology by WHO guidelines | ✓ | ✓ | ✓ | ✓ | A/P | G | A | A | G | Medium | |||
| (Wang et al., 2015b) | Cross-sectional (N=1,040) in China; men seeking semen analysis | Two urine samples collected same day | Concentration, motility, morphology by WHO guidelines | ✓ | ✓ | ✓ | ✓ | G | G | A | A | G | Medium | |||
| (Wirth et al., 2008) | Cross-sectional (N=45) in U.S.; men seeking fertility assessment | Single morning urine sample | Concentration, motility, morphology by WHO guidelines | ✓ | ✓ | ✓a | ✓ | ✓ | A/P | P | P | A | A | Medium | ||
| Total Studies per Phthalate | 14 | 4 | 12 | 4 | 11 | 12 | ||||||||||
| Exclu | Reference | Reason for Exclusion | ||||||||||||||
| (Joensen et al., 2012) | Results not presented for individual phthalate metabolites | |||||||||||||||
| (Kranvogl et al., 2014) | Critical deficiencies in multiple evaluation categories | |||||||||||||||
| (Pan et al., 2011) | Critical deficiency in exposure measure (exposure based on measures in semen) | |||||||||||||||
| (Pant et al., 2008) | Critical deficiency in exposure measure (exposure based on measures in semen) | |||||||||||||||
| (Pant et al., 2014) | Critical deficiency in exposure measure (exposure based on measures in semen) | |||||||||||||||
| (Toshima et al., 2012) | Critical deficiency in outcome measure; limited in other categories | |||||||||||||||
| (Wang et al., 2015a) | Critical deficiency in exposure measure (exposure based on measures in semen) | |||||||||||||||
| (Wang et al., 2016b) | Critical deficiency in exposure measure (exposure based on measures in semen); subset of study in Wang et al. (2015b) | |||||||||||||||
| (Zhang et al., 2006) | Critical deficiency in exposure measure (exposure based on measures in semen) | |||||||||||||||
G = good; A = adequate; D = deficient; A/D = adequate for short chain phthalates, deficient for long chain phthalates; WHO=World Health Organization.
Study was considered critically deficient for this phthalate due to a high percent below the LOD.
Outcome-specific criteria for study evaluation are available in the supplement. Population-based studies were preferred, but clinic or center-based samples were also acceptable as long as they were not limited to volunteers with known male fertility issues. Most of the studies are cross-sectional, varying in size between 45 and 1066 adult males. In most studies, a single urine sample was collected concurrent with outcome assessment (semen analysis). Exceptions are (Liu et al., 2012) and (Wang et al., 2015a, 2015b, 2015c), which had two urine samples several days apart and the same day, respectively. Because the relevant time window of exposure for sperm production was considered to be relatively short (< 90 days), concurrent measurement was not considered a limitation for this outcome. (Specht et al., 2014) used blood samples which were acceptable for secondary metabolites of DEHP and DINP, and (Huang et al., 2011), in which personal air samples were collected during a work shift. All of the studies assessed exposure in adulthood; one study (Axelsson et al., 2015b) additionally examined prenatal exposure, which is considered separately. Thirteen studies were classified as medium confidence, and two as low confidence (Den Hond et al., 2015, 3,045,496; Herr et al., 2009).
3.3.2. Results
Comparing results across studies is challenging due to the wide variety of analysis methods used. It is important to carefully consider the interpretation of the type of coefficient when comparing across results: for example, results supporting an association between increasing exposure and poorer semen quality will be reflected by a negative coefficient when the outcome is modeled as a continuous variable, and as a positive coefficient when the outcome is modeled as the probability of an unfavorable outcome (e.g., prevalence of sperm concentration < 15 × 106 per ml). To facilitate comparisons, the sets of studies reporting each type of metabolite in Table 4 are grouped by type of effect estimate (Beta or OR), and further sorted by overall confidence rating. Studies using dichotomous outcomes (and OR estimates) used World Health Organization guidelines for establishing cutoffs, with all using the 1999 version, with the exception of Wang et al. (2015a, 2015b, 2015c), which used the 2010 version. Both versions are similar in establishing abnormal semen quality (Catanzariti et al., 2013).
Table 4.
Associations between DEHP exposure and semen parameters.
| Reference; Study confidence; N | Exposure | Outcome transformation | Effect estimate | Metabolite (ng/mL) [median unless otherwise specified] | Sperm concentration (×106/ml) | Motility (% normal) | Morphology (% normal) |
|---|---|---|---|---|---|---|---|
| ∑DEHP | |||||||
| Huang et al. (2011); Medium; 45 | No transformation, air concentration | No transformation | β (SE; p-value) | 8/56 (n low/n high exposed) [occupational setting] | −0.19 (0.12; p = 0.1) | −0.23 (0.11; p = 0.04) | 0.014 (0.056, p = 0.8) (% abnormal) |
| (Thurston et al., 2016); Medium; 420 | Ln-transformed | Log-transformed | β (CI) | MEOHP mean 13 Range 0.5–1320 | 0.04 (−0.04,0.11) | 0.30 (−0.80,1.41) | 0.21 (−0.32,0.74) |
| Wirth et al. (2008); Medium; 45 | Tertiles | Dichotomous | OR (CI) | 10.1 | T2: 1.97 (0.2, 16.1) T3: 6.65 (0.9, 47.3) |
T2: 0.7 (0.1−4.4) T3: 0.7 (0.1−4.4) |
T2: 1.2 (0.3, 5.4) T3: 1.1 (0.3, 4.7) |
| Herr et al. (2009); Low; 349 | Quartiles | Dichotomous | OR (CI) | 4.4 | Q2: 0.86 (0.37, 1.97) Q3: 1.11 (0.46, 2.70) Q4: 1.57 (0.60, 4.08) |
Q2: 0.61 (0.2, 1.7) Q3: 0.74 (0.3, 2.2) Q4: 0.86 (0.3, 2.9) |
Q2: 1.95 (0.7, 5.2) Q3: 0.91 (0.4, 2.1) Q4: 1.26 (0.57, 2.8) |
| MEOHP | |||||||
| Bloom et al. (2015); Medium; 375 [related to Wang et al., 2015a] | Ln-transformed; 1 IQR difference | Box-Cox transformed | β (CI) | 5.7 | −1.90 (−3.7, −0.2)* | CD | −3.35 (−11.4, 4.7) |
| Wang et al. (2015b); Medium; 1,040 [related to Bloom et al., 2015] | Ln-transformed | Ln-transformed | β (CI) | 5.7 | (see row with % change effect estimates) | 0.80 (−1.0, 2.6) | −0.10 (−0.8, 0.6) |
| Huang et al. (2013); Medium; 62 | Log transformed | No transformation | β (CI) | 18/92 (low/high exposed) | −0.12 (−0.3, 0.06) | −0.02 (−0.3, −0.07) | −0.001 (−0.07, 0.07) |
| Den Hond et al. (2015); Low; 120 | Ln-transformed | No transformation | β (SE) for 1 unit increase | 7.7 (mean in controls) | 0.18 (0.28) | 1.73 (4.15) | −0.12 (0.42) |
| Specht et al. (2014); Medium; 589 | Dichotomous | Ln-transformed | Means (CI) | 0.2 | <LOD: 51.5 ≥LOD: 46.1 (35.3, 60.1) | Not significant (details not reported) | Not significant (details not reported) |
| Wang et al. (2015b); Medium; 1,040 [related to Bloom et al., 2015] | Ln-transformed | Ln-transformed | % change (CI) | 5.7 | 4.08% (−9.4, 17.4) | (see results for β effect estimates) | (see row with β effect estimates) |
| (Pan et al., 2016); Pan et al. (2015); Medium; 1,066 | Ln-transformed | Cubic root for concentration | % change (CI) | 8.4 IQR 4.8–14.3 | −1.3% (−3.6,1.0) | −0.5% (−3.6,2.5) | −2.1% (−5.4,1.2) |
| Axelsson et al. (2015a); Medium; 314 | Quartiles | Cubic root | Mean difference (Q4 vs. Q1) | 9.6 | −0.06 (−0.48, 0.36) | −6.9 (−13, −1.1)* | −0.42 (−2.4, 1.6) |
| Wang et al. (2015b); Medium; 1040 | Quartiles | Dichotomous | OR (CI) | 5.7 7.0 |
Q2: 0.97 (0.53, 1.79) Q3: 0.82 (0.43, 1.55) Q4: 0.86 (0.47, 1.60) |
Q2: 0.86 (0.6, 1.2) Q3: 0.90 (0.6, 1.3) Q4: 0.73 (0.5, 1.1) |
|
| Liu et al. (2012); Medium; 125 | Tertiles | Dichotomous | OR (CI) | 2.7 (mean) | T2: 1.4 (0.3, 7.7) T3: 0.6 (0.1, 4.2) |
T2: 1.0 (0.4, 3.1) T3: 0.6 (0.2, 1.8) |
|
| Hauser et al. (2006); Medium; 463 | Quartiles | Dichotomous | OR (CI) | 32.1 | Q2: 3.1 (0.8, 11.7) Q3: 1.1 (0.3, 4.6) Q4: 1.6 (0.4, 6.3) |
Q2: 0.9 (0.4, 2.0) Q3: 0.6 (0.3, 1.3) Q4: 0.8 (0.3, 1.6) |
Q2: 1.4 (0.5, 3.7) Q3: 0.5 (0.2, 1.5) Q4: 0.7 (0.3, 2.0) |
| MEHP | |||||||
| Jurewicz et al. (2013); Medium; 269 | Log transformed | Log transformed | β (p) | 8.8 | −0.07 (p = 0.3) | −3.85 (p = 0.001)* | 1.29 (p = 0.24) |
| Huang et al. (2013); Medium; 62 (see also means ± SD results) | Log transformed | No transformation | β (CI) | 6.3/23a | −0.07 (−0.6, 0.5) | −0.55 (−1.0, −0.1) | 0.09 (−0.1, 0.3) |
| Huang et al. (2013); Medium; 62 (see also β results) | Categorical | Means ± SD | 6.3/23a | Controls: 46.7 ± 32.0 Low: 19.9 ± 14.6 High: 27.8 ± 25.5 |
Controls: 65.2 ± 10.0 Low: 56.1 ± 18.3 High: 41.4 ± 22.0 |
Controls: 44.8 ± 7.7 Low: 41.4 ± 9.3 High: 41.4 ± 11.6 |
|
| Han et al. (2014); Medium; 232 | Dichotomous | Dichotomous | OR (CI) | 1.1 5th−95th percentile: 0−24 | 1.15 (0.57, 2.33) | 0.48 (0.08, 2.76) | 1.18 (0.58, 2.39) |
p < 0.05, results that support an association are shaded. Dark gray represents one or more of the following: p < 0.05, large effect size (e.g., OR ≥ 1.5, β ≥ −0.5, % difference ≥ 1.0%), or exposure-response trend across categories of exposure. Light gray represents other supportive results.
Q = quartile; T = tertile. Studies are sorted by study confidence level within each metabolite-effect estimate grouping.
Evaluation of the evidence for an association between exposure to DEHP and sperm parameters is based on 14 studies. Results for summed DEHP metabolites were used when available; if not available, results for MEOHP or MEHP were used (Table 4). An inverse relationship (decreased semen quality with increased DEHP exposure as measured by metabolite levels) was observed for sperm concentration in seven studies, and for motility in four studies. However, of all of the findings, only one for sperm concentration (Bloom et al., 2015) and two for motility (one for MEOHP and one for MEHP) (Axelsson et al., 2015a; Jurewicz et al., 2013) were statistically significant, and there was no indication that studies with higher median exposure levels were more likely to observe an association. The inverse findings were also supported by data (not reviewed systematically) from studies that indicated increased apoptosis (Huang et al., 2014); (Wang et al., 2016b; You et al., 2015), increased reactive oxygen species (ROS) generation (Huang et al., 2014), and increased sperm aneuploidy (Jurewicz et al., 2013)with increasing DEHP exposure, which may help inform potential mechanisms of action. Overall, there is moderate evidence of an association between increased DEHP and decreased semen quality, particularly for sperm concentration.
Four medium confidence studies examined the association between DINP exposure (measured by MCiOP or MINP) and semen parameters (Table 5). All three studies that looked at morphology (Axelsson et al., 2015a; Pan et al., 2015; Jurewicz et al., 2013) reported an inverse association between exposure and sperm quality, two of the three that looked at motility also reported an association (Axelsson et al., 2015a; Pan et al., 2015), and two of four studies reported an association with concentration (Specht et al., 2014) (Pan et al., 2015), including one with an exposure-response gradient (Specht et al., 2014). However, the only finding that was statistically significant was for morphology in Jurewicz et al. (2013). Given the consistency across studies for morphology, the relationship between DINP exposure and sperm parameters is considered moderate.
Table 5.
Associations between DINP exposure and semen parameters.
| Reference; Study Confidence Rating; N | Exposure | Outcome transformation | Effect estimate | Metabolite (ng/mL) [median unless otherwise specified] | Sperm concentration (×106/ml) | Motility (% normal) | Morphology (% normal) |
|---|---|---|---|---|---|---|---|
| MCiOP | |||||||
| Specht et al. (2014); Medium; 589 | Tertiles | Ln-transformed | Means (CI) by percentile e group | 0.5 maximum: 42 | <25th: 52.8 (43.9, 63.7) 25th−75th: 52.2 (45.1, 60.3) >75th: 51.8 (43.1, 62.2) |
||
| (Pan et al., 2016); Pan et al. (2015); Medium; 1,066 | Ln-transformed | Cubic root for concentration | % change (CI) | 1.2 IQR: 0.7–2.1 | −1.2% (−3.4, 0.9) | −2.4% (−5.2, 0.4%) | −3.4% (−6.4, 0.3) |
| Axelsson et al. (2015a); Medium; 314 | Quartiles | Cubic root | Mean difference (Q4 vs. Q1) | 16 range: 1.4−810 | −0.08 (−0.49, 0.33) | −1.3 (−7.2, 4.6) | −1.2 (−3.1, 0.81) |
| MINP | |||||||
| Jurewicz et al. (2013); Medium; 269 | Log transformed | Log transformed | β (p) | 1.1 IQR: 0.2−6.4 | −0.31 (0.191) | 6.21 (0.060) | −9.05 (0.033)* |
| Specht et al. (2014); Medium; 589 | Tertiles | Ln-transformed | Means (CI) by percentile group | 0.003 Proxy-MINP (nm) 0.15 (maximum) | <25th: 50.3 (37.8, 67.1) 25th−75th: 48.7 (37.4, 63.4) >75th: 45.5 (34.2, 60.4) |
p < 0.05, results that support an association are shaded. Dark gray represents one or more of the following: p < 0.05, large effect size (e.g., OR ≥ 1.5, β ≥ −0.5, % difference ≥ 1.0%), or exposure-response trend across categories of exposure. Light gray represents other supportive results.
Q = quartile; T = tertile. Studies are sorted by study confidence level within each metabolite-effect estimate grouping.
Twelve studies reported results on the association between DBP exposure (measured by MBP) and semen parameters (Table 6). Eight studies reported decreased concentration with increasing DBP exposure, with statistically significant and monotonic dose-response relationships observed in three (Wang et al., 2015b; Liu et al., 2012; Hauser et al., 2006). These findings were observed across the range of exposures observed in the studies. Seven studies supported an association for motility, including two that were statistically significant (Axelsson et al., 2015a; Hauser et al., 2006), but studies with lower exposure levels were more likely to report an association than studies with higher levels. Of the ten studies that included an evaluation of morphology, six support an association. Evidence for effects on semen were also supported by data (not reviewed systematically) from a study that indicated increased sperm aneuploidy with increased DBP exposure (Jurewicz et al., 2013), which may help inform potential mechanisms of action. No association was observed between DBP exposure and sperm apoptosis in one study (Wang et al., 2016b; You et al., 2015). Overall, due to the consistency across several medium confidence studies and the observation of dose-response relationships, evidence of an association between increased DBP exposure and decreased semen quality, specifically sperm concentration, is considered robust.
Table 6.
Associations between DBP and semen parameters.
| Reference; Study Confidence Rating; N | Exposure | Outcome transformation | Effect estimate | MBP (ng/mL) [median unless otherwise specified] | Sperm concentration (×106/ml) | Motility (% normal) | Morphology (% normal) |
|---|---|---|---|---|---|---|---|
| Wang et al. (2015b); Medium; 1,040 | Continuous ln-transformed | No transformation | β (CI) | 70 | (see row with change effect estimates) | −0.92 (−2.58, 0.75) | −0.40 (−1.07, 0.27) |
| Bloom et al. (2015); Medium; 375 | Continuous ln-transformed; 1 IQR difference | Box-Cox transformed | β (CI) | 7 | −0.95 (−4.0, 2.1) | −1.22 (−4.0, 1.6) | −7.03 (−21.0, 6.9) |
| Thurston et al. (2016); Medium; 420 | Ln-transformed | Log-transformed | β (CI) | 15 | 0.01 (−0.09,0.11) | −0.58 (−2.00, 0.84) | 0.22 (−0.46, 0.91) |
| Jurewicz et al. (2013); Medium; 269 | Continuous log transformed | Log transformed (concentration) | β (p) | 83 | −0.21 (p = 0.11) | −1.55 (p = 0.5) | −2.68 (p = 0.2) |
| Den Hond et al. (2015); Low; 120 | Continuous ln-transformed | No transformation | β (SE) | 18.9; 20.7 (mean controls; cases) | 0.24 (0.35) | 4.21 (5.20) | −0.25 (0.42) |
| Wang et al. (2015b); Medium; 1,040 | Continuous ln-transformed | Ln-transformed (concentration) | % change (CI) | 70 | −6.18% (1.6, −0.3) | (see row with β effect estimates) | (see row with β effect estimates) |
| (Pan et al., 2016); Pan et al. (2015); Medium; 1,066 | Ln-transformed | Cubic root for concentration | % change (CI) | 78 | −2.4% (−5.1,0.3) | −1.3% (−4.8,2.3) | −6.5 (−10.3,− 2.7)* |
| Axelsson et al. (2015a); Medium; 314 | Quartiles | Cubic root (concentration) | Mean difference (Q4 vs. Q1) | 47 | 0.04 (−0.38, 0.45) | −7.7 (−14, −1.8)* | 0.65 (−1.3, 2.6) |
| Jonsson et al. (2005); Medium; 234 | Quartiles | No transformation | Mean difference (Q4 vs. Q1) | 78 | −7.9 (−33, 17) | 2.1 (−4.0, 8.2) | |
| Wang et al. (2015b); Medium; 1,040 | Quartiles | Dichotomous | OR (CI) | 70 | Q2: 1.28 (0.7, 2.5) Q3: 0.87 (0.4, 1.8) Q4: 2.01 (1.1, 3.8)* |
Q2: 0.74 (0.5, 1.1) Q3: 0.96 (0.7, 1.4) Q4: 1.04 (0.7, 1.5) |
|
| Hauser et al. (2006); Medium; 463 | Quartiles | Dichotomous | OR (CI) | 18 | Q2: 3.1 (1.2, 8.1)* Q3: 2.5 (0.9, 6.7) Q4: 3.3 (1.2, 8.5)* |
Q2: 1.5 (0.8, 2.6) Q3: 1.5 (0.8, 2.6) Q4: 1.8 (1.1, 3.2)* |
Q2: 0.8 (0.4, 1.6) Q3: 0.9 (0.5, 1.7) Q4: 0.8 (0.4, 1.6) |
| Han et al. (2014); Medium; 232 | Dichotomous | Dichotomous | OR (CI) | 19 | 1.97 (0.97, 4.0) | 1.08 (0.7, 1.7) | 1.53 (0.8, 3.1) |
| Reference; Study Confidence Rating; N | Exposure | Outcome transformation | Effect estimate | MBP (ng/mL) [median unless otherwise specified] | Sperm concentration (×106/ml) | Motility (% normal) | Morphology (% normal) |
| Wirth et al. (2008); Medium; 45 | Dichotomous | Dichotomous | OR (CI) | 25 | 0.5 (0.1, 3.6) | 0.8 (0.2, 3.9) | 3.3 (0.7, 16.2) |
| Liu et al. (2012); Medium; 125 | Tertiles | Dichotomous | OR (CI) | 26 (mean) | Q2: 6.8 (0.6, 75.3) Q3: 12.0 (1.0, 143)* |
Q2: 0.5 (0.2, 1.4) Q3: 0.7 (0.3, 2.1) |
Q2: 1.0 (0.3, 4.1) Q3: 0.4 (0.1, 2.1) |
p < 0.05, results that support an association are shaded. Dark gray represents one or more of the following: p < 0.05, large effect size (e.g., OR ≥ 1.5, β ≥ −0.5, % difference ≥ 1.0%), or exposure-response trend across categories of exposure. Light gray represents other supportive results.
Q = quartile; T = tertile. Studies are sorted by study confidence level within each metabolite-effect estimate grouping.
Four studies reported results for DIBP exposure (measured by MIBP) and semen parameters (Table 7). Two medium confidence studies (Bloom et al., 2015) reported associations between increasing MIBP concentrations and one or more measures of decreased semen quality. The remaining medium confidence (Thurston et al., 2016) and low confidence (Den Hond et al., 2015) studies reported no association. Given the limited data and lack of consistency, the relationship between DIBP exposure and semen parameters is considered slight.
Table 7.
Associations between DIBP and semen parameters.
| Reference; Study Confidence Rating; N | Exposure | Outcome transformation | Effect estimate | MIBP median (ng/mL) | Sperm concentration (×106/ml) | Motility (% normal) | Morphology (% normal) |
|---|---|---|---|---|---|---|---|
| Thurston et al. (2016); Medium; 420 | Ln-transformed | Log-transformed | β (CI) | 2.8 | 0.02 (−0.06,0.11) | 0.82 (−0.31,1.96) | 0.28 (−0.27,0.83) |
| Bloom et al. (2015); Medium; 375 | Continuous ln transformed; 1 IQR difference | Box-Cox transformed | β (CI) | 4.4 | 0.46 (−1.90,2.83) | −0.98 (−3.16,1.20) | −4.43 (−15.15,6.29) |
| Den Hond et al. (2015); Low; 120 | Continuous ln-transformed | Continuous, no transformation noted | β (SE) | 55 (mean) | 0.16 (0.53) | 4.81 (3.59) | 0.10 (0.33) |
| (Pan et al., 2016); Pan et al. (2015); Medium; 1,066 | Ln-transformed | Cubic root for conc | % change (CI) | 48 | −2.1% (−4.6,0.4) | −2.2% (−5.4,1.1) | −5.3% (−8.9,−1.8)* |
p < 0.05, results that support an association are shaded. Dark gray represents one or more of the following: p < 0.05, large effect size (e.g., OR ≥ 1.5, β ≥ −0.5, % difference ≥ 1.0%), or exposure-response trend across categories of exposure. Light gray represents other supportive results.
Q = quartile; T = tertile. Studies are sorted by study confidence level within each metabolite-effect estimate grouping.
Ten studies reported results on the association between BBP exposure (measured by MBzP) and semen parameters (Table 8). Four studies that examined sperm concentration and eight studies that examined motility reported an association between increased BBP exposure and decreased sperm quality; for motility, studies with higher exposure levels were more likely to find an association. Statistically significant associations were reported with sperm concentration in two studies (Bloom et al., 2015) (Pan et al., 2015); and with motility in one study (Thurston et al., 2016). Only two studies examining morphology reported an association. Evidence for effects on semen were also supported by data (not reviewed systematically) from a study that reported increased sperm aneuploidy with increased BBP exposure (Jurewicz et al., 2013), which may help inform potential mechanisms of action. No association was observed between BBP exposure and sperm apoptosis in one study (Wang et al., 2016b; You et al., 2015). Overall, due to associations being reported in several medium confidence studies, there is moderate evidence that BBP exposure is associated with decreased sperm quality, specifically motility.
Table 8.
Associations between BBP and semen parameters.
| Reference; Study Confidence Rating; N | Exposure | Outcome transformation | Effect estimate | MBzP median (ng/mL) | Sperm concentration (×106/ml) | Motility (% normal) | Morphology (% normal) |
|---|---|---|---|---|---|---|---|
| Wang et al. (2015b); Medium; 1,040 | Ln-transformed | No transformation | β (CI) | 2.9 | (see row with % change effect estimates) | 0.43 (−0.62, 1.47) | 0.20 (−0.22, 0.61) |
| Bloom et al. (2015); Medium; 375 | Ln-transformed; 1 IQR difference | Box-Cox transformed | β (CI) | 3.6 | −3.09 (−5.52, −0.66)* | −1.67 (−3.92, 0.58) | −5.71 (−16.97, 5.56) |
| Thurston et al. (2016); Medium; 420 | Ln-transformed | Log-transformed | β (CI) | 11 | −0.04 (−0.12,0.04) | −1.47 (−2.61,−0.33)* | −0.19 (−0.75,0.36) |
| Jurewicz et al. (2013); Medium; 269 | Log transformed | Log transformed (concentration) | β (p) | 5.2 | −0.07 (p = 0.25) | 1.86 (0.10) | 1.17 (0.28) |
| Den Hond et al. (2015); Low; 120 | Ln-transformed | No transformation | β (SE) | 4.5 (mean controls) | −0.03 (0.17) | −1.44 (2.57) | 0.30 (0.27) |
| Wang et al. (2015b); Medium; 1,040 | Ln-transformed | Ln-transformed (concentration) | % change (CI) | 2.9 | 1.01% (−3.05, 5.13%) | (see row with β effect estimates) | (see row with β effect estimates) |
| (Pan et al., 2016); Pan et al. (2015); | Ln-transformed Medium; 1,066 | Cubic root for conc | % change (CI) | 0.1 | −3.4% (−5.9,−0.8)* | −1.8% (−5.1,1.6) | −4.0% (−7.6,−0.4)* |
| Axelsson et al. (2015a); Medium; 314 | Quartiles | Cubic root (concentration) | Mean difference (Q4 vs. Q1) | 13 | −0.29 (−0.71, 0.13) | −5.4 (−11, 0.56) | −0.79 (−2.8, 1.2) |
| Reference; Study Confidence Rating; N | Exposure | Outcome transformation | Effect estimate | MBzP median (ng/mL) | Sperm concentration (×106/ml) | Motility (% normal) | Morphology (% normal) |
| Jonsson et al. (2005); Medium; 234 | Quartiles | No transformation | Mean difference (Q4 vs. Q1) | 16 | 7.2 (−16, 31) | −4.3 (−10, 1.6) | |
| Wang et al. (2015b); Medium; 1,040 | Quartiles | Dichotomous | OR (CI) | 2.9 | Q2: 0.88 (0.48, 1.61) Q3: 0.83 (0.44, 1.53) Q4: 0.85 (0.46, 1.58) |
Q2: 0.75 (0.51, 1.09) Q3: 1.05 (0.73, 1.52) Q4: 0.93 (0.64, 1.35) |
|
|
Hauser et al. (2006); Medium; 463 |
Quartiles | Dichotomous | OR (CI) | 8.0 | Q2: 1.1 (0.4, 2.6) Q3: 1.1 (0.4, 2.5) Q4: 1.9 (0.8, 4.3) |
Q2: 1.3 (0.7, 2.3) Q3: 1.3 (0.8, 2.3) Q4: 1.3 (0.7, 2.3) |
Q2: 0.7 (0.3, 1.4) Q3: 0.9 (0.4, 1.7) Q4: 1.1 (0.6, 1.6) |
| Wirth et al. (2008); Medium; 45 | Dichotomous | No transformation | OR (CI) | 17 | 1.4 (0.3, 6.3) | 1.3 (0.3, 5.5) | 0.9 (0.2, 3.2) |
p < 0.05, results that support an association are shaded. Dark gray represents one or more of the following: p < 0.05, large effect size (e.g., OR ≥ 1.5, β ≥ −0.5, % difference ≥ 1.0%), or exposure-response trend across categories of exposure. Light gray represents other supportive results.
Q = quartile. Studies are sorted by study confidence level within each metabolite-effect estimate grouping.
Twelve studies investigated the association between DEP exposure (measured by MEP) and sperm parameters (Table 9). An inverse relationship (decreased semen quality with increased DEP exposure as measured by metabolite levels) was observed for sperm concentration in four studies, for motility in two studies, and for morphology in three studies. No association, or a positive association, was observed in the remaining studies. Given the lack of consistency across studies despite high exposure levels, this evidence is considered indeterminate; additional high confidence studies, at high exposure levels, would be needed to conclude there was compelling evidence of no effect.
Table 9.
Associations between DEP and sperm parameters.
| Reference; Study Confidence Rating; N | Exposure | Outcome transformation | Effect estimate | MEP median (ng/mL) | Sperm concentration (×106/ml) | Motility (% normal) | Morphology (% normal) |
|---|---|---|---|---|---|---|---|
| Wang et al. (2015b); Medium; 1,040 | Ln-transformed | No transformation | β (CI) | 18 | (see row with % change effect estimates) | 0.12 (−0.77, 1.02) | −0.25 (−0.60, 0.11) |
| Bloom et al. (2015); Medium; 375 | Ln-transformed; 1 IQR difference | Box-Cox transformed | β (CI) | 86 | −1.01 (−2.86, 0.85) | −0.83 (−2.54, 0.88) | −1.23 (−9.64, 7.17) |
| Thurston et al. (2016); Medium; 420 | Ln-transformed | Log-transformed | β (CI) | 201 | −0.02 (−0.07,0.04) | −0.13 (−0.95,0.69) | 0.16 (−0.24,0.55) |
| Jurewicz et al. (2013); Medium; 269 | Log-transformed | Log transformed | β (p) (concentration) | 45 | −0.07 (0.25) | −3.85 (0.001)* | 1.29 (0.24) |
| Reference; Study Confidence Rating; N | Exposure | Outcome | Effect transformation estimate | MEP median (ng/mL) | Sperm concentration (×106/ml) | Motility (% normal) | Morphology (% normal) |
| Den Hond et al. (2015); Low; 120 | Ln-transformed | No transformation noted | β (SE) | 50 (mean controls) | 0.24 (0.19) | 4.62 (2.78) | 0.05 (0.24) |
| Wang et al. (2015b); Medium; 1,040 | Ln-transformed | Ln-transformed (concentration) | % change (CI) | 18 | 1.01% (−2.02, 4.08%) | (see row with β effect estimates) | (see row with β effect estimates) |
| (Pan et al., 2016); Pan et al. (2015); Medium; 1,066 | Ln-transformed | Cubic root (concentration) | % change (CI) | 13 | −1.1% (−3.5,1.3) | 0.6% (−2.5,3.8) | −1.7% (−5.1,1.8) |
| Axelsson et al. (2015a); Medium; 314 | Quartiles | Cubic root (concentration) | Mean difference (Q4 vs. Q1) | 41 | 0.17 (−0.24, 0.59) | 2.6 (−3.3, 8.5) | −0.73 (−2.7, 1.3) |
| Jonsson et al. (2005); Medium; 234 | Quartiles | No transformation | Mean difference (Q4 vs. Q1) | 240 | 5.0 (−15, 25) | −0.4 (−6.4, 5.6) | |
| Wang et al. (2015b); High; 1,040 | Quartiles | Dichotomous | OR (CI) | 18 | Q2: 1.05 (0.56, 1.98) Q3: 0.94 (0.50, 1.79) Q4: 1.08 (0.58, 2.04) |
Q2: 0.88 (0.60, 1.29) Q3: 1.02 (0.71, 1.49) Q4: 0.93 (0.63, 1.36) |
|
| Hauser et al. (2006); Medium; 463 | Quartiles | Dichotomous | OR (CI) | 158 | Q2: 1.5 (0.7, 3.6) Q3: 1.0 (0.4, 2.5) Q4: 1.2 (0.5, 3.0) |
Q2: 1.1 (0.6, 1.9) Q3: 0.8 (0.5, 1.5) Q4: 1.0 (0.6, 1.8) |
Q2: 0.8 (0.4, 1.6) Q3: 0.7 (0.3, 1.3) Q4: 0.5 (0.3, 1.1) |
| Han et al. (2014); Medium; 232 | Dichotomous | Dichotomous | OR (CI) | 3.1 | 0.78 (0.38, 1.58) | 0.96 (0.18, 5.04) | 0.88 (0.44, 1.75) |
| Wirth et al. (2008); Medium; 45 | Tertiles | Dichotomous | OR (CI) 108 | Q2: 3.6 (0.4, 34.6) Q3: 6.5 (0.6, 73.4) |
Q2: 0.7 (0.1, 3.7) Q3: 0.5 (0.1, 2.9) |
Q2: 4.2 (0.7, 24.5) Q3: 7.0 (1.0, 48.0)* |
|
| Liu et al. (2012); Medium; 125 | Tertiles | Dichotomous | OR (CI) | 175 (mean) | Q2: 1.4 (0.2, 8.8) Q3: 1.5 (0.2, 9.6) |
Q2: 0.7 (0.2, 1.9) Q3: 0.4 (0.1, 1.2) |
Q2: 0.2 (0.1, 1.2) Q3: 0.8 (0.2, 3.0) |
p < 0.05, results that support an association are shaded. Dark gray represents one or more of the following: p < 0.05, large effect size (e.g., OR ≥ 1.5, β ≥ −0.5, % difference ≥ 1.0%), or exposure-response trend across categories of exposure. Light gray represents other supportive results.
Q = quartile. Studies are sorted by study confidence level within each metabolite-effect estimate grouping.
In summary, there is moderate to robust evidence of an association between DBP, BBP, DEHP, and DINP exposure and sperm parameters, slight evidence for DIBP, and indeterminate evidence for DEP. The strongest evidence was observed for sperm concentration, while evidence for motility and morphology was more limited (with the exception of BBP and DINP, respectively). There were notably fewer studies of DIBP, which may explain the lack of an association. DEP had both a reasonable number of studies and high exposure levels without a clear association; these results support differences in DEP’s potency or activity relative to other phthalates.
3.4. Time to pregnancy (male exposure)
3.4.1. Study selection
Three studies looked at male exposure to phthalates and its association with time to pregnancy. Two were excluded because the exposure was measured after the outcome (Table 10) (Modigh et al., 2002; Specht et al., 2015). The specific phthalates examined in the remaining study are summarized in Table 10. This was a prospective cohort identified through population-based sampling. Based on the criteria described in the outcome-specific criteria (supplement), it was classified as high confidence, and the rationale for domain ratings are available at https://hawcprd.epa.gov/rob/study/100000037/.
Table 10.
Epidemiology studies of time to pregnancy (male exposure).
| Included | Reference | Study description | Includes metabolites of: | Study evaluation | ||||||||||||
| Population | Exposure | Outcome | DEHP | DINP | DBP | DIBP | BBP | DEP | Exposure | Outcome | Selection | Confounding | Analysis | Overall confidence | ||
| Buck Louis et al. (2014) | Cohort (N=501) in U.S. of couples trying to conceive | Single urine sample at study entry | Cycles to conception (from pregnancy testing, journals, and fertility monitor) | ✓ | ✓a | ✓ | ✓ | ✓ | ✓ | A/P | G | G | A | A | High | |
| Excluded | Reference | Reason for Exclusion | ||||||||||||||
| Modigh et al. (2002) | Critical deficiency in exposure measure (exposure measured after outcome from occupational records, not validated | |||||||||||||||
| Specht et al. (2015) | Critical deficiency in exposure measure (exposure measured after outcome, during pregnancy) | |||||||||||||||
G = good; A = adequate; D = deficient; A/D = adequate for short chain phthalates, deficient for long chain phthalates.
Study was considered critically deficient for this phthalate due to a high percent below the LOD.
3.4.2. Results
In Buck Louis et al. (2014), for DBP and BBP (measured by MBP and MBzP, respectively), there were statistically significant associations between increased exposure and increased time to pregnancy, or decreased fecundity (Table 11). Because the study is high confidence and because of the coherence with semen parameters, this evidence is considered moderate. For DEHP and DIBP, there was some evidence that increased exposure to these phthalates is associated with increased time to pregnancy, but the results were not statistically significant, and this evidence is considered slight. For DEP and DINP, no association was reported; given the limited number of studies and for DINP, the relatively low range of exposures, the evidence is considered indeterminate.
Table 11.
Association between phthalate metabolites and time to pregnancy in Buck Louis et al. (2014).
| Phthalate (metabolite) | Exposure Geometric mean | Fecundability Ratio (95% CI) |
|---|---|---|
| (ng/mL) | ||
| DINP (MINP) | 0.07 | 1.01 (0.90, 1.14) |
| BBP (MBzP) | 2.8 | 0.77 (0.65, 0.92)* |
| DIBP (MiBP) | 3.4 | 0.88 (0.74, 1.04) |
| DBP (MBP) | 5.9 | 0.82 (0.70, 0.97)* |
| DEHP (MEOHP) | 6.1 | 0.91 (0.79, 1.05) |
| DEP (MEP) | 82.7 | 1.01 (0.86, 1.18) |
p < 0.05, results that support an association are shaded. Dark gray represents one or more of the following: p < 0.05, large effect size (e.g., OR ≤ 0.7), or exposure-response trend across categories of exposure. Light gray represents other supportive results.
3.5. Testosterone
3.5.1. Study selection and evaluation
Based on the exposure evaluation criteria, eight of the 21 epidemiology papers (Table 12) identified in the search with data on testosterone were excluded because they used measurements in tissues other than urine (i.e., blood or semen), did not report results for individual metabolites, or did not discuss collection time of outcome sample. The specific phthalates examined in the remaining 13 studies (15 papers) and study evaluations are summarized in Table 12 (Fong et al., 2015; Janjua et al., 2007; Lenters et al., 2014; Li et al., 2011; Pan et al., 2016; Xu et al., 2015). Full rationale for ratings are available at https://hawcprd.epa.gov/summary/visual/100000066/, and outcome-specific criteria are available in the supplement. All of the studies are cross-sectional, varying in sample size between 25 and 1066 adult men in analysis. As with studies of sperm parameters, cross-sectional design with concurrent measurement of exposure and outcome (testosterone concentration) was not considered a limitation. In most studies, a single urine sample was collected concurrent with outcome assessment, with the exception of Wang et al. (2015c), which had two same-day urine samples, and Specht et al. (2014), in which blood samples were used for secondary metabolites of DEHP and DINP. Testosterone was the most studied of the relevant reproductive hormones, and was therefore the focus of this review.
Table 12.
Epidemiology studies of testosterone.
| Included | Reference | Study description | Includes metabolites of: | Study evaluation | ||||||||||||
| Population | Exposure | Outcome | DEHP | DINP | DBP | DIBP | BBP | DEP | Exposure | Outcome | Selection | Confounding | Analysis | Overall confidence | ||
| Axelsson et al., 2015(a); Axelsson et al., 2015(b) | Cross-sectional (N=314) in Sweden; men entering military | Single urine sample; subset with prenatal sample available | Total T by immunoassay, morning blood sample | ✓ | ✓ | ✓ | ✓ | ✓ | A/P | G | A | A | A | Medium | ||
| Chang et al. (2015) | Case-control based on achieving pregnancy (N=141 cases, 35 controls) in Taiwan | Single urine sample | T by immunoassay; morning blood sample | ✓ | ✓ | ✓ | ✓ | ✓ | A/P | G | P | P | P | Low | ||
| Den Hond et al., 2015 | Case-control (N=40 cases reduced semen quality/80 controls) in Belgium | Single urine sample | T by immunoassay, adjusted for blood collection time in model | ✓ | ✓ | ✓ | ✓ | ✓ | A/P | G | P | P | A | Low | ||
| Han et al., 2014 | Cross-sectional (N=232) in China; general population | Single urine sample | T by immunoassay, morning blood sample | ✓ | ✓ | ✓a | ✓ | A/P | G | P | A | A | Medium | |||
| Jurewicz et al., 2013 | Cross-sectional (N=269) in Poland; men at infertility clinic | Single morning urine sample | T by immunoassay, morning blood sample | ✓ | ✓ | ✓ | ✓ | ✓ | A/P | A | P | A | A | Medium | ||
| Meeker and Ferguson (2014) | Cross-sectional (N=427) in U.S.; general population | Single urine sample | Total T by mass spectrometry, adjusted for blood collection time in model | ✓ | ✓ | ✓ | ✓ | ✓ | ✓ | A/P | A | G | A | A | Medium | |
| Meeker et al. (2009) | Cross-sectional (N=425) in U.S.; men from subfertile couples | Single urine sample | Total T by immunoassay, adjusted for blood collection time | ✓ | ✓ | ✓ | ✓ | A/P | A | G | A | G | Medium | |||
| Mendiola et al. (2011) | Male partners from pregnancy cohort (N=363) | Single urine sample | Total T by immunoassay, adjusted for blood collection time in model | ✓ | P | A | G | A | A | Medium | ||||||
| Pan et al. (2006) | Cross-sectional (N=137) in China; PVC (exposed) and construction (unexposed) workers | Single urine sample | Free T by immunoassay, morning blood sample | ✓ | ✓ | A/P | G | P | P | P | Low | |||||
| (Pan et al., 2016); Pan et al. (2015) | Cross-sectional (N=1,066) in China; men seeking fertility assessment | Single urine sample | Total T by immunoassay, adjusted for blood collection time in model | ✓ | ✓ | ✓ | ✓ | ✓ | ✓ | A/P | A | A | A | A | Medium | |
| Park et al. (2010) | Cross-sectional (N=25) in Korea, men working in dental labs | Single pre-shift urine sample | T by immunoassay, morning blood sample | ✓ | P | P | P | P | P | Low | ||||||
| Specht et al., 2014; Lenters et al., 2014; | Cross-sectional (N=589) in Greenland, Poland, Ukraine; men from couples at antenatal visit | Single blood sample | T by immunoassay, morning blood sample | ✓ | ✓ | P | A | G | A | A | Medium | |||||
| Wang et al. (2015c) | Cross-sectional (N=1,040) in China; men seeking semen analysis | Two urine samples collected same day | Total T by direct chemilumin-escence assay, morning blood sample | ✓ | ✓ | ✓ | ✓ | G | G | A | A | G | Medium | |||
| Total Studies per Phthalate | 13 | 5 | 10 | 4 | 8 | 9 | ||||||||||
| Excluded | Reference | Reason for Exclusion | ||||||||||||||
| Fong et al. (2015) | No discussion of or adjustment for collection time of outcome sample. | |||||||||||||||
| Janjua et al. (2007) | Critical deficiency in exposure measure (exposure based on measurement in blood) | |||||||||||||||
| Joensen et al. (2012) | Results not presented for individual phthalate metabolites | |||||||||||||||
| Jonsson et al. (2005) | No discussion of or adjustment for collection time of outcome sample. | |||||||||||||||
| Li et al. (2011) | Critical deficiency in exposure measure (exposure based on measurement in blood, semen; diesters analyzed) | |||||||||||||||
| Pant et al. (2014) | Critical deficiency in exposure measure (exposure based on measurement in semen | |||||||||||||||
| Xu et al. (2015) | Results not presented for individual phthalate metabolites | |||||||||||||||
| Wang et al. (2016b) | Critical deficiency in exposure measure (exposure based on measurement in semen) (note: same study as Wang et al. (2015b)) | |||||||||||||||
T = testosterone; G = good; A = adequate; D = deficient; A/E = adequate for short chain phthalates, deficient for long chain phthalates.
Study was considered critically deficient for this phthalate due to a high percent below the LOD.
Nine studies (ten papers) were classified as medium confidence (Axelsson et al., 2015a; Axelsson et al., 2015b; Pan et al., 2015; Han et al., 2014; Meeker and Ferguson, 2014; Specht et al., 2014; Jurewicz et al., 2013; Mendiola et al., 2011; Meeker et al., 2009);, and four studies were classified as low confidence (Chang et al., 2015; Den Hond et al., 2015; Park et al., 2010; Pan et al., 2006).
3.5.2. Results
Evaluation of the association between exposure to DEHP and testosterone is based on 13 studies (Axelsson et al., 2015a; Chang et al., 2015; Den Hond et al., 2015; Pan et al., 2015; Wang et al., 2015c; Han et al., 2014; Meeker and Ferguson, 2014; Specht et al., 2014; Jurewicz et al., 2013; Mendiola et al., 2011; Park et al., 2010; Meeker et al., 2009; Pan et al., 2006). Results for summed DEHP metabolites were used when available; if not available, results for MEOHP (preferred) or MEHP were used. Eight studies (Axelsson et al., 2015a; Wang et al., 2015c; Meeker and Ferguson, 2014; Specht et al., 2014; Jurewicz et al., 2013; Park et al., 2010; Meeker et al., 2009); (Pan et al., 2015); reported decreased testosterone levels with higher DEHP exposure (Table 13), including findings from two studies that were statistically significant (Specht et al., 2014; Jurewicz et al., 2013). The association between DEHP exposure and decreased testosterone did not show a clear response pattern with increasing exposure level or exposure range; however, medium confidence studies were more likely to report an association than low confidence studies, and low confidence studies generally had null, rather than conflicting, results. Given the overall consistency among higher confidence studies, this evidence is considered moderate.
Table 13.
Associations between DEHP exposure and testosterone.
| Reference; Study confidence; N | Transformation | Effect estimate | Metabolite (ng/mL) [median unless otherwise specified] | Exposure IQR (or as specified) | Testosterone effect estimate |
|---|---|---|---|---|---|
| ∑DEHP | |||||
| Mendiola et al. (2011); Medium; 363 | Log10 transformed | β (95% CI) for 1 unit increase | 0.24 nmol/mL | 0.1−0.5 | −0.01 (−0.04, 0.03) |
| Meeker et al. (2009); Medium; 425 | Ln-transformed exposure | β (95% CI) for IQR increase | 0.31 nmol/mL | 0.2−0.7 | −6.35 (−17.8, 5.1) |
| Chang et al. (2015); Low; 176 | Ln-transformed exposure and outcome | β (95% CI) for IQR increase | 0.15 nmol/mL (mean) | 0.98 (0.9, 1.1)Ŧ | |
| Wang et al. (2015c); Medium; 1,040 | Ln-transformed exposure and outcome | % difference (95% CI) 1 unit increase | 7.9 (MEOHP) | 3.9–8.5 | −3.7% (−8.0, 0.6) |
| Meeker and Ferguson (2014); Medium; 160 (12–19 yr) | None reported | % change (95% CI) with IQR increase | 4.9 (MEOHP) | 3.0–7.4 | −8.42% (−24.5, 11.0) |
| 267 (20–40 yr) | 4.2 (MEOHP) | 2.8–7.1 | 0.42 (−5.8, 7.1) | ||
| Specht et al. (2014); Medium; 589 | Means (95% CI) for <25th, 25th−75th, >75th percentile | 0.01 nM (Proxy DEHP) | 0.01−0.14 | Q1: 15.4 (14.3−16.7) Q2: 14.8 (14.0, 15.7) Q3: 14.1 (13.1−15.1) p trend <0.05 |
|
| MEOHP | |||||
| Den Hond et al. (2015); Low; 120 | Ln-transformed exposure | β ± SE | 7.7 | 3.9−14.0 | −0.03 ± 0.04 |
| Pan et al., 2016; Pan et al. (2015); Medium; 1,066 | Ln-transformed exposure and outcome | % change (CI) | 8.4 | 4.8–14.3 | −1.6% (−2.2,1.0) |
| Axelsson et al. (2015a); Medium; 314 | Ln-transformed exposure and outcome | Mean difference (Q4 vs. Q1) | 9.6 | 0.5−1,100 (range) | −1.0 (−9.7, 8.7) |
| Park et al. (2010); Low; 25 | Ln-transformed exposure | Correlation coefficient | 14 (pre-shift) | 9.2−19 | −0.33 (p = 0.1) |
| MEHP | |||||
| Jurewicz et al. (2013); Medium; 269 | Log-transformed exposure | β (p) | 8.8 | 0.6–136 (range) | −0.29 (p = 0.04) |
| Han et al. (2014); Medium; 232 | None reported | Partial correlation coefficient | 1.1 | 0.0–23.8 (5th–95th) | −0.05 |
| Pan et al. (2006); Medium; 137 | Log10 transformed outcome | Partial correlation coefficient | 562/5 μg/g creatinine (exposed/unexposed) | 210–1,884/3.7–10 | −0.2 (free testosterone) |
p < 0.05, results that support an association are shaded. Dark gray represents one or more of the following: p < 0.05, large effect size (e.g., OR ≥ 1.5, β ≥ −0.5, % difference ≥ 1.0%), or exposure-response trend across categories of exposure. Light gray represents other supportive results.
Q = quartile.
Ŧ Coefficient was calculated by study authors with back-transformation of both hormone and phthalate metabolite concentrations. A coefficient < 1.0 indicates a multiplicative decrease in hormone level for an IQR change in exposure.
Units for testosterone differed across studies: ng/mL (Jurewicz et al., 2013, Meeker and Ferguson, 2014, nmol/L (Han et al., 2014, Axelsson et al., 2015a, 2015b, Mendiola et al., 2011, Chang et al., 2015, Pan et al., 2015), nmol/mL (Specht et al., 2014), pg/mL (Pan et al., 2006), ng/dL (Meeker et al., 2009; Den Hond et al., 2015; Wang et al., 2015a, 2015b, 2015c).
Five medium confidence studies (Axelsson et al., 2015a; Pan et al., 2015; Meeker and Ferguson, 2014; Specht et al., 2014; Jurewicz et al., 2013) investigated the association between DINP exposure (measured by MINP or MCiOP) and testosterone (Table 14). Three studies (Meeker and Ferguson, 2014; Specht et al., 2014)) found decreasing testosterone levels with increasing DINP exposure; the results in two were statistically significant, including an exposure-response gradient in Specht et al., 2014. The evidence for an association between DINP exposure and decreased testosterone is considered moderate.
Table 14.
Associations between DINP exposure and testosterone.
| Reference; Study confidence; N | Transformation | Effect estimate | Metabolite (ng/mL) [median unless otherwise specified] | Exposure IQR (or as specified) | Testosterone effect estimate |
|---|---|---|---|---|---|
| MINP | |||||
| Jurewicz et al. (2013); Medium; 269 | Log-transformed exposure | β (p) | 1.1 | 0.2–6.4 | 0.30 (0.373) |
| Specht et al. (2014); Medium; 589 | Ln-transformed | Means (CI) for <25th, 25th–75th, >75th percentile | 0.003 Proxy-MINP (nm) | 0.15 (maximum) | Q1: 15.3 (14.2, 16.4) Q2: 14.9 (14.0, 15.8) Q3: 13.9 (12.9, 14.9) p trend <0.05 |
| MCiOP | |||||
| (Pan et al., 2016); Pan et al. (2015); Medium; 1,066 | Ln-transformed | % change (CI) | 1.2 | 0.7–2.1 | −2.3% (−4.5,−0.1)* |
| Meeker and Ferguson (2014); Medium; 160 (12–19 yr) | None reported | % change (95% CI) with IQR increase | 14 | 7.76−43.1 | −22.5% (−36.7, −5.18) |
| 267 (20–40 yr) | 23 | 9.28–57.0 | −0.33 (−7.09, 6.92) | ||
| Axelsson et al. (2015a); Medium; 314 | Ln-transformed exposure and outcome | Mean difference (95% CI) Q4 vs. Q1 | 16 | 1.4–810 (range) | 4.3 (−4.9, 14) |
p < 0.05, results that support an association are shaded. Dark gray represents one or more of the following: p < 0.05, large effect size (e.g., OR ≥ 1.5, β ≥ −0.5, % difference ≥ 1.0%), or exposure-response trend across categories of exposure. Light gray represents other supportive results.
Q = quartile.
Units for testosterone differed across studies: ng/mL (Jurewicz et al., 2013; Meeker and Ferguson, 2014), nmol/L (Pan et al., 2015), nmol/mL (Specht et al., 2014).
Evaluation of the association between exposure to DBP (measured by MBP) and testosterone is based on ten studies (Axelsson et al., 2015a; Chang et al., 2015; Den Hond et al., 2015; Pan et al., 2015; Wang et al., 2015c; Han et al., 2014; Meeker and Ferguson, 2014; Jurewicz et al., 2013; Meeker et al., 2009; Pan et al., 2006). Five studies (Pan et al., 2015; Meeker and Ferguson, 2014; Meeker et al., 2009; Pan et al., 2006); Wang et al., 2015b) reported results that indicate decreased testosterone levels with increased DBP exposure (Table 15). The association in one study (Pan et al., 2015) was statistically significant. There was no clear pattern between observed associations and exposure level or range. This evidence is considered slight.
Table 15.
Associations between DBP and DIBP exposure and testosterone.
| Reference; Study confidence; N | Transformation estimate | Effect | Metabolite (ng/mL) [median unless otherwise specified] | Exposure IQR (or as specified) | Testosterone effect estimate |
|---|---|---|---|---|---|
| DBP (measured by MBP) | |||||
| Meeker et al. (2009); Medium; 425 | Ln-transformed exposure and outcome (except testosterone) | β (95% CI) for IQR increase | 17.7 | 10.6−32.75 | −4.65 (−15.7, 6.33) |
| Jurewicz et al. (2013); Medium; 269 | Log-transformed exposure | β (p) | 83 | 19−1,530 (range) | 0.02 (p = 1.0) |
| Den Hond et al. (2015); Low; 120 | Ln-transformed exposure | β ± SE | 19 | 12−42 | −0.03 (0.03) |
| Chang et al. (2015); Low; 176 | Ln-transformed exposure and outcome | β (95% CI) for IQR increase Ŧ | 11.1 (fertile mean) | 0.96 (0.90, 1.02) | |
| Wang et al. (2015c); High; 1,040 | Ln-transformed exposure and outcome | % difference (95% CI) 1 unit increase | 70 | 28−84 | −1.1% (−4.6, 2.3) |
| Meeker and Ferguson (2014); Medium; 160 (12–19 yr) | None reported | % change (95% CI) with IQR increase | 8.9 | 5.0−14.3 | −19.3% (−37.0, 3.34) |
| 267 (20–40 yr) | 7.0 | 3.9−11.2 | −3.85% (−11.0, 3.89) | ||
| (Pan et al., 2016); Pan et al. (2015); Medium; 1,066 | Ln-transformed exposure and outcome | % change (CI) | 78 | 39–162 | −3.9% (−6.6,−1.1)* |
| Axelsson et al. (2015a); Medium; 314 | Ln-transformed exposure and outcome | Mean difference for Q4 vs. Q1 (95% CI) | 47 | 1.0, 690 (range) | 2.1 (−11, 7.6) |
| Han et al. (2014); Medium; 232 | None reported | Partial correlation coefficient | 18.72 | 2.10−129.34 (5th−95th) | 0.10 |
| Pan et al. (2006); Medium; 137 | Log10 transformed outcome | Partial correlation coefficient | 548/113 μg/g (exposed/unexposed) | 252–1,493/75–207 | −0.253 (free testosterone) |
| DIBP (measured by MIBP) | |||||
| Den Hond et al. (2015); Low; 80/163 | Ln-transformed exposure | β ± SE | 55 | 27.0–113.0 | 0.00 ± 0.03 |
| Chang et al. (2015); Low; 176 | Ln-transformed exposure and outcome | β (95% CI) for IQR increaseŦ | 7.6 (fertile mean) | 0.92 (0.87, 0.98)* | |
| Meeker and Ferguson (2014); Medium; 160 (12–19 yr) | None reported | % change (95% CI) with IQR increase | 7.3 | 4.3–11.4 | −19.9 (−39.4, 5.83) |
| 267 (20–40 yr) | 5.1 | 3.5−9.1 | 0.39 (−6.26, 7.52) | ||
| (Pan et al., 2016); Pan et al. (2015); Medium; 1,066 | Ln-transformed exposure and outcome | % change (CI) | 48 | 28–84 | −4.1% (−6.7,−1.5)* |
p < 0.05, results that support an association are shaded. Dark gray represents one or more of the following: p < 0.05, large effect size (e.g., OR ≥ 1.5, β ≥ −0.5, % difference ≥ 1.0%), or exposure-response trend across categories of exposure. Light gray represents other supportive results.
Ŧ Coefficient was calculated by study authors with back-transformation of both hormone and phthalate metabolite concentrations. A coefficient < 1.0 indicates a multiplicative decrease in hormone level for an IQR change in exposure.
Units for testosterone differed across studies: ng/mL (Jurewicz et al., 2013, Meeker and Ferguson, 2014), nmol/L (Han et al., 2014; Axelsson et al., 2015a, 2015b; Chang et al., 2015; Pan et al., 2015), nmol/mL (Specht et al., 2014), pg/mL (Pan et al., 2006), ng/dL (Meeker et al., 2009, Den Hond et al., 2015, Wang et al., 2015a, 2015b, 2015c).
Four studies (Chang et al., 2015; Den Hond et al., 2015; Pan et al., 2015; Meeker and Ferguson, 2014) provided data on the association between DIBP exposure (measured by MIBP) and testosterone (Table 15). Of the four studies, three (Chang et al., 2015; Meeker and Ferguson, 2014) (Pan et al., 2015) found decreased testosterone levels with increasing DIBP exposure; the results in two were statistically significant. The fourth study (Den Hond et al., 2015) reported no association, despite having higher exposure levels for MIBP than other studies in this assessment, but was also rated as low confidence. Based on the overall consistency, this evidence is considered moderate.
Eight studies (Axelsson et al., 2015a; Chang et al., 2015; Den Hond et al., 2015; Wang et al., 2015c; Meeker and Ferguson, 2014; Jurewicz et al., 2013; Meeker et al., 2009) investigated the association between BBP exposure (measured by MBzP) and testosterone (Table 16). Two studies (Pan et al., 2015; Meeker and Ferguson, 2014) reported an inverse association between BBP exposure and testosterone levels, but they were not statistically significant. Results from some of the remaining studies were in the opposite direction (i.e., a positive association). Given the lack of consistency, this evidence is considered to be indeterminate.
Table 16.
Associations between BBP and DEP exposure and testosterone.
| Reference; Study confidence; N | Transformation | Effect estimate | Metabolite (ng/mL) [median unless otherwise specified] | Exposure IQR (or as specified) | Testosterone effect estimate |
|---|---|---|---|---|---|
| BBP (measured by MBzP) | |||||
| Meeker et al. (2009); Medium; 425 | Ln-transformed exposure and outcome (except testosterone) | β (95% CI) for IQR increase | 8.2 | 4.20−15.9 | 4.58 (−7.91, 17.0) |
| Jurewicz et al. (2013); Medium; 269 | Log-transformed exposure | β (p) | 5.2 | 0.4−205 (range) | −0.09 (p = 0.5) |
| Den Hond et al. (2015); Low; 120 | Ln-transformed exposure | β ± SE | 4.5 | 2.5−9.0 | −0.02 ± 0.02 |
| Chang et al. (2015); Low; 176 | Ln-transformed exposure and outcome | β (95% CI) for IQR increaseŦ | 0.7 (fertile mean) | 0.96 (0.91, 1.02) | |
| Wang et al. (2015c); Medium; 1,040 | Ln-transformed exposure and outcome | % difference (95% CI) 1 unit increase | 2.9 | 1.0−3.4 | −1.2% (−5.3, 2.9) |
| Meeker and Ferguson (2014); Medium; 160 (12–19 yr) | None reported | % change (95% CI) with IQR increase | 5.8 | 3.6−11.3 | −21.1 (−38.6, 1.30) |
| 267 (20–40 yr) | 3.7 | 2.2−6.7 | −4.92 (−12.9, 3.82) | ||
| (Pan et al., 2016); Pan et al. (2015); Medium; 1,066 | Ln-transformed exposure and outcome | % change (CI) | 0.1 | <LOD-0.4 | −2.6% (−5.3,0.1) |
| Axelsson et al. (2015a); Medium; 314 | Ln-transformed exposure and outcome | Mean difference for Q4 vs. Q1 (95% CI) | 13 | 0.5–260 (range) | 2.3 (−2.8, 6.0) |
| DEP (measured by MEP) | |||||
| Meeker et al. (2009); Medium; 425 | Ln-transformed exposure and outcome (except testosterone) | β (95% CI) for IQR increase | 153 | 59.9–518 | 8.87 (−7.18, 24.9) |
| Jurewicz et al. (2013); Medium; 269 | Log-transformed exposure | β (p) | 45 | 3.8–2,483 (range) | 0.08 (p = 0.6) |
| Den Hond et al. (2015); Low; 120 | Ln-transformed exposure | β ± SE | 50 | 20.5–110.5 | 0.01 ± 0.02 |
| Chang et al. (2015); Low; 176 | Ln-transformed exposure and outcome | β (95% CI) for IQR increaseŦ | 13 (fertile mean) | 1.00 (0.97, 1.04) | |
| Wang et al. (2015c); Medium; 1,040 | Ln-transformed exposure and outcome | % difference (95% CI) 1 unit increase | 18 | 7.1−25 | −1.7% (−3.8, 0.30) |
| Meeker and Ferguson (2014); Medium; 160 (12–19 yr) | None reported | % change (95% CI) with IQR increase | 26 | 14.0−46.9 | 9.46 (−17.1, 44.5) |
| 267 (20–40 yr) | 27 | 12.2−74.7 | −3.30 (−9.81, 3.67) | ||
| (Pan et al., 2016); Pan et al. (2015); Medium; 1,066 | Ln-transformed exposure and outcome | % change (CI) | 13 | 6.6–32 | −1.5% (−4.0,1.1) |
| Axelsson et al. (2015a); Medium; 314 | Ln-transformed exposure and outcome | Mean difference for Q4 vs. Q1 (95% CI) | 41 | 2−6,900 (range) | 1.0 (−7.9, 11) |
| Han et al. (2014); Medium; 232 | None reported | Partial correlation coefficient | 3.1 | 0.0−59.7 (5th−95th) | −0.01 |
p < 0.05, results that support an association are shaded. Dark gray represents one or more of the following: p < 0.05, large effect size (e.g., OR ≥ 1.5, β ≥ −0.5, % difference ≥ 1.0%), or exposure-response trend across categories of exposure. Light gray represents other supportive results.
Ŧ Coefficient was calculated by study authors with back-transformation of both hormone and phthalate metabolite concentrations. A coefficient < 1.0 indicates a multiplicative decrease in hormone level for an IQR change in exposure.
Units for testosterone differed across studies: ng/mL (Jurewicz et al., 2013, Meeker and Ferguson, 2014), nmol/L (Han et al., 2014, Axelsson et al., 2015a, 2015b, Chang et al., 2015, Pan et al., 2015), nmol/mL (Specht et al., 2014), pg/mL (Pan et al., 2006), ng/dL (Meeker et al., 2009, Den Hond et al., 2015, Wang et al., 2015a, 2015b, 2015c).
Nine studies (Axelsson et al., 2015a; Chang et al., 2015; Den Hond et al., 2015; Wang et al., 2015c; Han et al., 2014; Meeker and Ferguson, 2014; Jurewicz et al., 2013; Meeker et al., 2009) (Pan et al., 2015) investigated the association between DEP (measured by MEP) and testosterone (Table 16). Three studies (Pan et al., 2015; Wang et al., 2015c; Meeker and Ferguson, 2014) reported an inverse association between DEP exposure and testosterone levels, but none were statistically significant. Results from some of the remaining studies were in the opposite direction (i.e., a positive association). Given the lack of consistency despite high exposure levels, this evidence is considered indeterminate.
In summary, there is moderate evidence of an association between exposure to DEHP, DINP, and DIBP and decreased testosterone levels, slight evidence for exposure to DBP, and indeterminate evidence for BBP and DEP. In the case of BBP, the reporting of no association in the majority of studies may be explained by the lower exposure levels, and corresponding lower sensitivity to observe an effect. Therefore, the results for BBP are not necessarily inconsistent with the results for the other phthalates. DEP, with both a reasonable number of studies and higher exposure levels, showed no clear association with testosterone levels. This lack of association may reflect an inherent difference in potency or activity towards testosterone relative to other phthalates. This difference is consistent with observations from experimental animal studies.
3.6. Other male reproductive effects
In addition to the health effects already described, systematic reviews were performed for hypospadias/cryptorchidism and timing of pubertal development. These reviews are described in detail in the supplemental materials. In summary, for both outcomes, results were largely inconsistent and the evidence was considered slight or indeterminate for all phthalates.
3.7. Summary of male reproductive effects
Results for all phthalate-outcome combinations are summarized in Fig. 3. Tables 17–21 present the summary of evidence across outcomes within each phthalate with moderate or robust evidence of male reproductive toxicity.
Fig. 3.
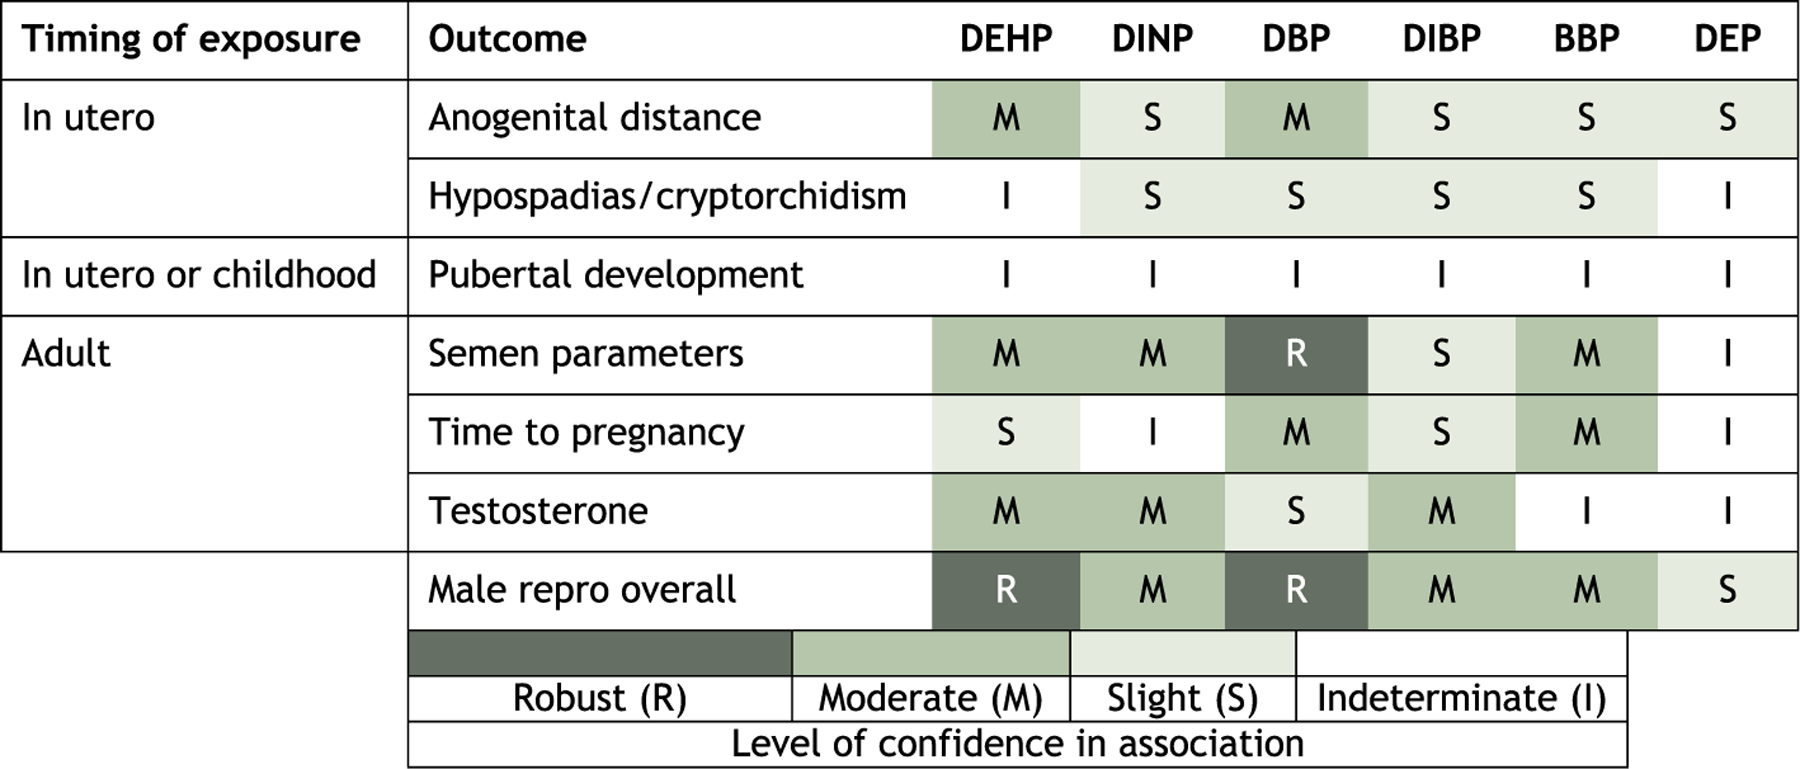
Summary of epidemiologic evidence of male reproductive effects associated with phthalates.
Table 17.
Evidence profile table for male reproductive effects of DEHP.
| Outcome | Studies (design in parentheses) | Factors that increase confidence | Factors that decrease confidence | Summary of findings | Confidence judgement for outcome | Confidence judgement for overall hazard |
|---|---|---|---|---|---|---|
| Anogenital distance | Medium confidence Bornehag et al., 2015 (C) Jensen et al., 2016 (C) Swan et al., 2015 (C) Low confidence Bustamante-Montes et al., 2013 (C) Suzuki et al., 2012 (C) Swan, 2008 (C) |
Among medium confidence studies:
Overall:
|
|
Inverse associations between DEHP exposure and anogenital distance reported in 5/6 studies (Jensen et al., 2016, Swan et al., 2015, Bornehag et al., 2015, Swan, 2008, Suzuki et al., 2012), of which 2 were statistically significant (Swan et al., 2015, Swan, 2008). Among 3 medium confidence studies, effect size increased with increasing exposure levels (Fig. 2). | ⨁⨁◯ MODERATE | ⨁⨁⨁ ROBUST Supported by coherence across outcomes. |
| Semen parameters | Medium confidence Axelsson et al., 2015a, 2015b (CS) Bloom et al., 2015 (C) Han et al., 2014 (CS) Hauser et al., 2006 (CS) Huang et al., 2013 (CS) Jurewicz et al., 2013 (CS) Liu et al., 2012 (CS) Pan et al., 2015 (CS) Specht et al., 2014 (CS) Thurston et al., 2016 (CS) Wang et al., 2015a, 2015b, 2015c (CS) Wirth et al., 2008 (CS) Low confidence Den Hond et al., 2015 (CS) Herr et al., 2009 (CS) |
|
|
Inverse associations between DEHP exposure and sperm concentration in 7/14 studies (Herr et al., 2009, Huang et al., 2011, Wirth et al., 2008, Specht et al., 2014, Bloom et al., 2015, Hauser et al., 2006), of which 1 was statistically significant (Bloom et al., 2015). Four studies reported an inverse association with motility (Axelsson et al., 2015a; Huang et al., 2013; Huang et al., 2011, and Jurewicz et al., 2013), and 2 were statistically significant (Axelsson et al., 2015a; Jurewicz et al., 2013) (Table 4). Biological plausibility-Studies showed increased apoptosis (Huang et al., 2014); (Wang et al., 2016b; You et al., 2015), increased reactive oxygen species generation (Huang et al., 2014), and increased sperm aneuploidy (Jurewicz et al., 2013) with increased exposure. |
⨁⨁◯ MODERATE for concentration | |
| Testosterone | Medium confidence Axelsson et al., 2015a, 2015b (CS) Han et al., 2014 (CS) Jurewicz et al., 2013 (CS) Meeker and Ferguson, 2014 (CS) Meeker et al., 2009 (CS) Mendiola et al., 2011 (C) Pan et al., 2015 (CS) Specht et al., 2014 (CS) Wang et al., 2015c (CS) Low confidence Chang et al. (2015) (CS) Den Hond et al., 2015 (CS) Pan et al., 2006 (CS) Park et al., 2010 (CS) |
|
|
Inverse associations between DEHP exposure and testosterone levels in 8/13 studies (Specht et al., 2014, Meeker and Ferguson, 2014, Wang et al., 2015b, Meeker et al., 2009, Axelsson et al., 2015a, Park et al., 2010, Jurewicz et al., 2013, Pan et al., 2015), 2 of which were statistically significant (Specht et al., 2014, Jurewicz et al., 2013), with the former showing an exposure-response trend, other studies did not examine exposure-response gradient (Table 13). | ⨁⨁◯ MODERATE | |
| Time to Pregnancy | ⨁◯◯ SLIGHT | |||||
| Hypospadias/cryptorchidism and pubertal development | ◯◯◯ INDETERMINATE |
C: cohort, CC: case-control, CS: cross-sectional.
Table 21.
Evidence profile table for male reproductive effects of BBP.
| Outcome | Studies (design in parentheses) | Factors that increase confidence | Factors that decrease confidence | Summary of findings | Confidence judgement for outcome | Confidence judgement for overall hazard |
|---|---|---|---|---|---|---|
| Semen parameters | Medium confidence Axelsson et al., 2015a, 2015b (CS) Bloom et al., 2015 (CS) Hauser et al., 2006 (CS) Jonsson et al., 2005 (CS) Jurewicz et al., 2013 (CS) Pan et al., 2015 (CS) Thurston et al., 2016 (CS) Wang et al., 2015c (CS) Wirth et al., 2008 (CS) Low confidence Den Hond et al., 2015 (CS) |
|
|
Inverse associations between BBP exposure and sperm concentration in 4/10 studies (Bloom et al., 2015; Hauser et al., 2006; Wirth et al., 2008; Pan et al., 2015), of which 2 were statistically significant (Bloom et al., 2015; Pan et al., 2015). Eight studies reported an inverse association with motility (Bloom et al., 2015; Den Hond et al., 2015; Hauser et al., 2006; Axelsson et al., 2015a; Jonsson et al., 2005; Wirth et al., 2008; Pan et al., 2015; Thurston et al., 2016), and 1 was statistically significant (Thurston et al., 2016) (Table 8). Biological plausibility-Studies showed increased sperm aneuploidy (Jurewicz et al., 2013) with increased exposure. | ⨁⨁◯ MODERATE for motility |
⨁⨁◯ MODERATE Supported by coherence across outcomes. |
| Time to pregnancy | High confidence Buck Louis et al., 2014 (C) |
|
|
Decrease in fecundability with increased BBP exposure in one study (Buck Louis et al., 2014); results were statistically significant (Table 11). | ⨁⨁◯ MODERATE |
|
| Anogenital distance, hypospadias/cryptorchidism | ⨁◯◯ SLIGHT |
|||||
| Testosterone, pubertal development | ◯◯◯ INDETERMINATE |
C: cohort, CC: case-control, CS: cross-sectional, OR = odds ratio.
4. Discussion
With the exception of DEP, all the phthalates included in this systematic review had moderate or greater evidence of male reproductive effects; these findings are directly relevant to humans as they generally are based on exposure levels seen in general populations (i.e., not in occupationally exposed settings). The strongest (robust) evidence of male reproductive effects comes from studies of DBP and DEHP in adult males. These two phthalates tended to have the largest number of studies, and exposure levels higher than most of the other phthalates (i.e., DINP, DIBP, and BBP).
The differences in data availability and exposure level/range may explain the differing confidence in the associations between these phthalates and male reproductive effects. For DIBP in particular, which might be expected to have similar activity as DBP due to their similarity in structure, there was a considerably smaller number of available studies and lower exposure levels relative to other phthalates. While it is possible there are differences in potency/activity between these phthalates, at this point, inadequate sensitivity of the systematic review (i.e., low exposure levels, fewer studies) for DINP, BBP, and in particular DIBP seems to be a likely explanation. In light of these issues, it would be inappropriate to conclude that substituting DINP for DEHP or DIBP for DBP would be health protective. In contrast, DEP had a similar number of studies as DBP and generally higher exposure levels, but weaker evidence of an association. This is consistent with experimental animal data that suggest that DEP does not have as strong an anti-androgenic effect as other phthalates (Howdeshell et al., 2008).
The results of this review illustrate the difficulty in drawing conclusions across different phthalates (i.e., do phthalates in general cause male reproductive toxicity?). There is slight evidence of an association for most of the individual phthalate/outcome combinations, but these are generally marked by inconsistency across available studies and are difficult to draw conclusions from. Looking at the combinations with moderate or robust evidence, there is little consistency in which outcomes were strongly associated across the six phthalates. Semen parameters were the most consistent, with four phthalates (DBP, DEHP, BBP, and DINP) having moderate or robust evidence, and as already discussed, there are reasonable explanations for the differences with DIBP and DEP, but the specific parameters with stronger evidence differed across phthalates (concentration for DBP and DEHP, motility for BBP, and morphology for DINP). While DEHP and DBP both had robust evidence overall and moderate evidence for anogenital distance, DEHP had stronger evidence for testosterone, while DBP had stronger evidence for time to pregnancy. Still, there are mechanistic linkages between all of these outcomes – low testosterone is associated with decreased anogenital distance and semen quality, semen quality is associated with time to pregnancy – and so there is consistency in a broader sense. Still, more consistency within outcomes, across phthalates, would strengthen the confidence in the overall association between phthalates and male reproductive effects. Additional studies with higher sensitivity (i.e., with repeated exposure measures, higher exposure levels/adequate range, and appropriately powered) would be informative. In addition, more evidence on the cumulative effect of phthalates and confounding across phthalates would help reduce uncertainties.
This systematic review benefited from the involvement of experts on phthalates and male reproductive epidemiology throughout the process, from development of the study evaluation criteria through evidence synthesis. However, one important limitation was that we did not perform quantitative meta-analysis to summarize the findings of the studies. This was generally due to differences in the way results were presented across studies. Additionally, further review of mechanistic data for specific outcomes may have clarified the relationship, as would review of animal studies. Discussion of some additional issues that apply to all phthalate studies, such as correlations across phthalates, will be presented in a forthcoming editorial.
Despite these limitations, our results support male reproductive effects as a hazard associated with phthalate exposure in humans, which supports recent regulations by the U.S. Consumer Product Safety Commission to ban certain phthalates in children’s toys and other products (CPSC 2017, CPSC 2008). Our findings are consistent with other more limited-scope systematic reviews and meta-analyses that examined some of the outcomes discussed here. NAS also found moderate evidence of an association between DEHP and DBP and anogenital distance, while considering the evidence for infant testosterone and hypospadias to be inadequate (National Academies of Sciences, Engineering, and Medicine, 2017). Two meta-analyses on semen parameters and phthalate exposure reported that phthalate exposure was associated with diminished semen quality (Wang et al., 2016a; Cai et al., 2015). This consistency across different review methods provides clear support for our findings.
Supplementary Material
Table 18.
Evidence profile table for male reproductive effects of DINP.
| Outcome | Studies (design in parentheses) | Factors that increase confidence | Factors that decrease confidence | Summary of findings | Confidence judgement for outcome | Confidence judgement for overall hazard |
|---|---|---|---|---|---|---|
| Testosterone | Medium confidence Axelsson et al., 2015a, 2015b (CS) Jurewicz et al., 2013 (CS) Meeker and Ferguson, 2014 (CS) Pan et al., 2015 (CS) Specht et al., 2014 (CS) |
|
|
Inverse associations between DINP exposure and testosterone levels in 3/5 studies (Specht et al., 2014, Meeker and Ferguson, 2014, Pan et al., 2015), 2 included statistically significant results (Pan et al., 2015, Specht et al., 2014), with the latter being a trend (other studies did not examine exposure-response gradient) (Table 14). | ⨁⨁◯ MODERATE | ⨁⨁◯ MODERATE Based on testosterone and semen parameters, supported by coherence of slight findings in other outcomes with few available studies |
| Semen parameters | Medium confidence Axelsson et al., 2015a, 2015b (CS) Jurewicz et al., 2013 (CS) (Pan et al., 2015) (CS) Specht et al., 2014 (CS) |
|
|
Inverse associations between DINP exposure and sperm morphology in all 4 studies, 1 of which was statistically significant (Jurewicz et al., 2013). 2/3 studies for motility (Pan et al., 2015, Axelsson et al., 2015a) and 2/4 studies for concentration (Specht et al., 2014, Pan et al., 2015) also reported inverse associations (Table 5). | ⨁⨁◯ MODERATE | |
| Anogenital distance, Hypospadias/Cryptorchidism | ⨁◯◯ SLIGHT | |||||
| Time to pregnancy, pubertal development | ◯◯◯ INDETERMINATE |
C: cohort, CC: case-control, CS: cross-sectional.
Table 19.
Evidence profile table for male reproductive effects of DBP.
| Outcome | Studies (design in parentheses) | Factors that increase confidence | Factors that decrease confidence | Summary of findings | Confidence judgement for outcome | Confidence judgement for overall hazard |
|---|---|---|---|---|---|---|
| Semen parameters | Medium confidence Axelsson et al., 2015a, 2015b (CS) Bloom et al., 2015 (C) Han et al., 2014 (CS) Hauser et al., 2006 (CS) Jonsson et al., 2005 (CS) Jurewicz et al., 2013 (CS) Liu et al., 2012 (CS) Pan et al., 2015 (CS) Thurston et al., 2016 (CS) Wang et al., 2015c (CS) Wirth et al., 2008 (CS) Low confidence Den Hond et al., 2015 (CS) |
|
|
Inverse associations between DBP exposure and sperm concentration in 8/12 studies (Bloom et al., 2015; Jurewicz et al., 2013; Wang et al., 2015a, 2015b, 2015c; Pan et al., 2015; Jonsson et al., 2005; Hauser et al., 2006; Han et al., 2014; Liu et al., 2012), of which 3 were statistically significant and displayed monotonic exposure-response relationships (Wang et al., 2015a; Liu et al., 2012; Hauser et al., 2006). Seven studies reported an inverse association with motility (Wang et al., 2015a, 2015b, 2015c; Bloom et al., 2015; Thurston et al., 2016; Jurewicz et al., 2013; Pan et al., 2015; Axelsson et al., 2015a, 2015b; Hauser et al., 2006), and 2 were statistically significant (Axelsson et al., 2015a; Hauser et al., 2006) (Table 6) Biological plausibility-Studies showed increased sperm aneuploidy (Jurewicz et al., 2013) with increased exposure. |
⨁⨁⨁ ROBUST for concentration | ⨁⨁⨁ ROBUST Based on semen parameters, supported by coherence across outcomes. |
| Anogenital distance | Medium confidence Bornehag et al., 2015 (C) Jensen et al., 2016 (C) Swan et al., 2015 (C) Low confidence Suzuki et al., 2012 (C) Swan, 2008 (C) |
|
|
Inverse associations between DBP exposure and anogenital distance reported in 3/5 studies (Swan et al., 2015, Bornehag et al., 2015, Swan, 2008), of which Swan, 2008 was statistically significant (Fig. 2-C). | ⨁⨁◯ MODERATE |
|
| Time to pregnancy | High confidence Buck Louis et al., 2014 (C) |
|
|
Decrease in fecundability with increased DBP exposure in one study (Buck Louis et al., 2014); results were statistically significant (Table 11). | ⨁⨁◯ MODERATE |
|
| Hypospadias/cryptorchidism, testosterone | ⨁◯◯ SLIGHT |
|||||
| Pubertal development | ◯◯◯ INDETERMINATE |
C: cohort, CC: case-control, CS: cross-sectional, OR = odds ratio.
Table 20.
Evidence profile table for male reproductive effects of DIBP.
| Outcome | Studies (design in parentheses) | Factors that increase confidence | Factors that decrease confidence | Summary of findings | Confidence judgement for outcome | Confidence judgement for overall hazard |
|---|---|---|---|---|---|---|
| Testosterone | Medium confidence Meeker and Ferguson, 2014 (CS) Pan et al., 2015 (CS) Low confidence Chang et al., 2015 (CS) Den Hond et al., 2015 (CS) |
|
|
Inverse associations between DIBP exposure and testosterone levels in 3/4 studies (Meeker and Ferguson, 2014, Pan et al., 2015, Chang et al., 2015), 2 of which were statistically significant. No studies examined exposure-response gradient (Table 15). | ⨁⨁◯ MODERATE |
⨁⨁◯ MODERATE Based on testosterone and supported by slight evidence in other outcomes, with explanation for weaker observed associations (i.e., sensitivity and few available studies). Results for DBP, a structurally similar phthalate are also supportive. |
| Anogenital distance, semen parameters, time to pregnancy hypospadias/cryptorchidism | ⨁◯◯ SLIGHT |
|||||
| Pubertal development | ◯◯◯ INDETERMINATE |
C: cohort, CC: case-control, CS: cross-sectional.
Acknowledgements
Susan Rieth, Audrey Galizia, Larissa Pardo, Rebecca Nachman, Amanda Persad, Cynthia Yund, Leonid Kopylev, Erin Yost, Xabier Arzuaga, Tom Luben, Susan Euling, Kris Thayer, Courtney Lynch, Jane Burns, Wendy Robinson, Andrew Greenhalgh.
Footnotes
Appendix A. Supplemental materials
Supplementary data to this article can be found online at https://doi.org/10.1016/j.envint.2018.07.029.
References
- Agarwal A, Mulgund A, Hamada A, Chyatte M, 2015. A unique view on male infertility around the globe. Reprod. Biol. Endocrinol 13. [DOI] [PMC free article] [PubMed] [Google Scholar]
- Araki A, Mitsui T, Goudarzi H, Nakajima T, Miyashita C, Itoh S, Sasaki S, Cho K, Moriya K, Shinohara N, Nonomura K, Kishi R, 2016. Prenatal di(2-ethylhexyl) phthalate exposure and disruption of adrenal androgens and glucocorticoids levels in cord blood: the Hokkaido Study. Sci. Total Environ 581–582, 297–304. 10.1016/j.scitotenv.2016.12.124. [DOI] [PubMed] [Google Scholar]
- Araki A, Mitsui T, Miyashita C, Nakajima T, Naito H, Ito S, Sasaki S, Cho K, Ikeno T, Nonomura K, Kishi R, 2014. Association between maternal exposure to di(2-ethylhexyl) phthalate and reproductive hormone levels in fetal blood: the Hokkaido study on environment and children’s health. PLoS One 9, e109039. 10.1371/journal.pone.0109039. [DOI] [PMC free article] [PubMed] [Google Scholar]
- Axelsson J, Rylander L, Rignell-Hydbom A, Jönsson BA, Lindh CH, Giwercman A, 2015a. Phthalate exposure and reproductive parameters in young men from the general Swedish population. Environ. Int 85, 54–60. 10.1016/j.envint.2015.07.005. [DOI] [PubMed] [Google Scholar]
- Axelsson J, Rylander L, Rignell-Hydbom A, Lindh CH, Jönsson BA, Giwercman A, 2015b. Prenatal phthalate exposure and reproductive function in young men. Environ. Res 138C, 264–270. 10.1016/j.envres.2015.02.024. [DOI] [PubMed] [Google Scholar]
- Bloom MS, Whitcomb BW, Chen Z, Ye A, Kannan K, Buck Louis GM, 2015. Associations between urinary phthalate concentrations and semen quality parameters in a general population. Hum. Reprod 30, 2645–2657. 10.1093/humrep/dev219. [DOI] [PMC free article] [PubMed] [Google Scholar]
- Bornehag CG, Carlstedt F, Jönsson BA, Lindh CH, Jensen TK, Bodin A, Jonsson C, Janson S, Swan SH, 2015. Prenatal phthalate exposures and anogenital distance in Swedish boys. Environ. Health Perspect 123, 101–107. 10.1289/ehp.1408163. [DOI] [PMC free article] [PubMed] [Google Scholar]
- Buck Louis GM, Schisterman EF, Sweeney AM, Wilcosky TC, Gore-Langton RE, Lynch CD, Boyd Barr D, Schrader SM, Kim S, Chen Z, Sundaram R, 2011. Designing prospective cohort studies for assessing reproductive and developmental toxicity during sensitive windows of human reproduction and development–the LIFE Study. Paediatr. Perinat. Epidemiol 25, 413–424. 10.1111/j.1365-3016.2011.01205.x. [DOI] [PMC free article] [PubMed] [Google Scholar]
- Buck Louis GM, Sundaram R, Sweeney AM, Schisterman EF, Maisog J, Kannan K, 2014. Urinary bisphenol A, phthalates, and couple fecundity: the Longitudinal Investigation of Fertility and the Environment (LIFE) study. Fertil. Steril 101, 1359–1366. 10.1016/j.fertnstert.2014.01.022. [DOI] [PMC free article] [PubMed] [Google Scholar]
- Bustamante-Montes LP, Hernández-Valero MA, Flores-Pimentel D, García-Fábila M, Amaya-Chávez A, Barr DB, Borja-Aburto VH, 2013. Prenatal exposure to phthalates is associated with decreased anogenital distance and penile size in male newborns. J. Dev. Orig. Health Dis 4, 300–306. 10.1017/S2040174413000172. [DOI] [PMC free article] [PubMed] [Google Scholar]
- Cai H, Zheng W, Zheng P, Wang S, Tan H, He G, Qu W, 2015. Human urinary/seminal phthalates or their metabolite levels and semen quality: a meta-analysis. Environ. Res 142, 486–494. 10.1016/j.envres.2015.07.008. [DOI] [PubMed] [Google Scholar]
- Catanzariti F, Cantoro U, Lacetera V, Muzzonigro G, Polito M, 2013. Comparison between WHO (World Health Organization) 2010 and WHO 1999 parameters for semen analysis - interpretation of 529 consecutive samples. Arch. Ital. Urol. Androl 26, 125–129. [DOI] [PubMed] [Google Scholar]
- Chang WH, Li SS, Wu MH, Pan HA, Lee CC, 2015. Phthalates might interfere with testicular function by reducing testosterone and insulin-like factor 3 levels. Hum. Reprod 30, 2658–2670. 10.1093/humrep/dev225. [DOI] [PubMed] [Google Scholar]
- Cooper G, Lunn R, Agerstrand M, Glenn B, Kraft A, Luke A, Ratcliffe J, 2016. Study sensitivity: evaluating the ability to detect effects in systematic reviews of chemical exposures. Environ. Int 92–93, 605–610. 10.1016/j.envint.2016.03.017. [DOI] [PMC free article] [PubMed] [Google Scholar]
- Dean A, Sharpe RM, 2013. Clinical review: anogenital distance or digit length ratio as measures of fetal androgen exposure: relationship to male reproductive development and its disorders [Review]. J. Clin. Endocrinol. Metab 98, 2230–2238. 10.1210/jc.2012-4057. [DOI] [PubMed] [Google Scholar]
- Den Hond E, Tournaye H, De Sutter P, Ombelet W, Baeyens W, Covaci A, Cox B, Nawrot TS, Van Larebeke N, D’Hooghe T, 2015. Human exposure to endocrine disrupting chemicals and fertility: a case-control study in male subfertility patients [Review]. Environ. Int 84, 154–160. 10.1016/j.envint.2015.07.017. [DOI] [PubMed] [Google Scholar]
- Dent MP, Carmichael PL, Jones KC, Martin FL, 2015. Towards a non-animal risk assessment for anti-androgenic effects in humans [Review]. Environ. Int 83, 94–106. 10.1016/j.envint.2015.06.009. [DOI] [PubMed] [Google Scholar]
- Fong JP, Lee FJ, Lu IS, Uang SN, Lee CC, 2015. Relationship between urinary concentrations of di(2-ethylhexyl) phthalate (DEHP) metabolites and reproductive hormones in polyvinyl chloride production workers. Occup. Environ. Med 72, 346–353. 10.1136/oemed-2014-102532. [DOI] [PubMed] [Google Scholar]
- Gnoth C, Godehardt D, Godehardt E, Frank-Herrmann P, Freundl G, 2003. Time to pregnancy: results of the German prospective study and impact on the management of infertility. Hum. Reprod 18, 1959–1966. [DOI] [PubMed] [Google Scholar]
- Han X, Cui Z, Zhou N, Ma M, Li L, Li Y, Lin H, Ao L, Shu W, Liu J, Cao J, 2014. Urinary phthalate metabolites and male reproductive function parameters in Chongqing general population, China. Int. J. Hyg. Environ. Health 217, 271–278. 10.1016/j.ijheh.2013.06.006. [DOI] [PubMed] [Google Scholar]
- Hauser R, Meeker JD, Duty S, Silva MJ, Calafat AM, 2006. Altered semen quality in relation to urinary concentrations of phthalate monoester and oxidative metabolites. Epidemiology 17, 682–691. 10.1097/01.ede.0000235996.89953.d7. [DOI] [PubMed] [Google Scholar]
- Herr C, zur Nieden A, Koch HM, Schuppe HC, Fieber C, Angerer J, Eikmann T, Stilianakis N, 2009. Urinary di(2-ethylhexyl)phthalate (DEHP)–metabolites and male human markers of reproductive function. Int. J. Hyg. Environ. Health 212, 648–653. 10.1016/j.ijheh.2009.08.001. [DOI] [PubMed] [Google Scholar]
- Howdeshell KL, Rider CV, Wilson VS, Gray LE Jr., 2008. Mechanisms of action of phthalate esters, individually and in combination, to induce abnormal reproductive development in male laboratory rats [Review]. Environ. Res 108, 168–176. 10.1016/j.envres.2008.08.009. [DOI] [PubMed] [Google Scholar]
- Huang LP, Lee CC, Fan JP, Kuo PH, Shih TS, Hsu PC, 2013. Urinary metabolites of di(2-ethylhexyl) phthalate relation to sperm motility, reactive oxygen species generation, and apoptosis in polyvinyl chloride workers. Int. Arch. Occup. Environ. Health 87, 635–646. 10.1007/s00420-013-0905-6. [DOI] [PubMed] [Google Scholar]
- Huang LP, Lee CC, Hsu PC, Shih TS, 2011. The association between semen quality in workers and the concentration of di(2-ethylhexyl) phthalate in polyvinyl chloride pellet plant air. Fertil. Steril 96, 90–94. 10.1016/j.fertnstert.2011.04.093. [DOI] [PubMed] [Google Scholar]
- Huang PC, Kuo PL, Chou YY, Lin SJ, Lee CC, 2009. Association between prenatal exposure to phthalates and the health of newborns. Environ. Int 35, 14–20. 10.1016/j.envint.2008.05.012. [DOI] [PubMed] [Google Scholar]
- Huang T, Saxena AR, Isganaitis E, James-Todd T, 2014. Gender and racial/ethnic differences in the associations of urinary phthalate metabolites with markers of diabetes risk: national health and nutrition examination survey 2001–2008. Environ. Health 13, 6. 10.1186/1476-069X-13-6. [DOI] [PMC free article] [PubMed] [Google Scholar]
- Janjua NR, Mortensen GK, Andersson AM, Kongshoj B, Skakkebaek NE, Wulf HC, 2007. Systemic uptake of diethyl phthalate, dibutyl phthalate, and butyl paraben following whole-body topical application and reproductive and thyroid hormone levels in humans. Environ. Sci. Technol 41, 5564–5570. 10.1021/es0628755. [DOI] [PubMed] [Google Scholar]
- Jensen TK, Frederiksen H, Kyhl HB, Lassen TH, Swan SH, Bornehag CG, Skakkebaek NE, Main KM, Lind DV, Husby S, Andersson AM, 2016. Prenatal exposure to phthalates and anogenital distance in male infants from a low-exposed Danish cohort (2010–2012). Environ. Health Perspect 124, 1107–1113. 10.1289/ehp.1509870. [DOI] [PMC free article] [PubMed] [Google Scholar]
- Joensen UN, Frederiksen H, Jensen MB, Lauritsen MP, Olesen IA, Lassen TH, Andersson AM, Jørgensen N, 2012. Phthalate excretion pattern and testicular function: a study of 881 healthy Danish men. Environ. Health Perspect 120, 1397–1403. 10.1289/ehp.1205113. [DOI] [PMC free article] [PubMed] [Google Scholar]
- Johns LE, Cooper GS, Galizia A, Meeker JD, 2015. Exposure assessment issues in epidemiology studies of phthalates [Review]. Environ. Int 85, 27–39. 10.1016/j.envint.2015.08.005. [DOI] [PMC free article] [PubMed] [Google Scholar]
- Johnson KJ, Heger NE, Boekelheide K, 2012. Of mice and men (and rats): phthalate-induced fetal testis endocrine disruption is species-dependent [Review]. Toxicol. Sci 129, 235–248. 10.1093/toxsci/kfs206. [DOI] [PMC free article] [PubMed] [Google Scholar]
- Jonsson BAG, Richthoff J, Rylander L, Giwercman A, Hagmar L, 2005. Urinary phthalate metabolites and biomarkers of reproductive function in young men. Epidemiology 16, 487–493. 10.1097/01.ede.0000164555.19041.01. [DOI] [PubMed] [Google Scholar]
- Jurewicz J, Radwan M, Sobala W, Ligocka D, Radwan P, Bochenek M, Hawuła W, Jakubowski L, Hanke W, 2013. Human urinary phthalate metabolites level and main semen parameters, sperm chromatin structure, sperm aneuploidy and reproductive hormones. Reprod. Toxicol 42, 232–241. 10.1016/j.reprotox.2013.10.001. [DOI] [PubMed] [Google Scholar]
- Kranvogl R, Knez J, Miuc A, Vončina E, Vončina DB, Vlaisavljević V, 2014. Simultaneous determination of phthalates, their metabolites, alkylphenols and bisphenol A using GC-MS in urine of men with fertility problems. Acta Chim. Slov 61, 110–120. [PubMed] [Google Scholar]
- Lenters V, Portengen L, Smit LA, Jönsson BA, Giwercman A, Rylander L, Lindh CH, Spanò M, Pedersen HS, Ludwicki JK, Chumak L, Piersma AH, Toft G, Bonde JP, Heederik D, Vermeulen R, 2014. Phthalates, perfluoroalkyl acids, metals and organochlorines and reproductive function: a multipollutant assessment in Greenlandic, Polish and Ukrainian men. Occup. Environ. Med 72, 385–393. 10.1136/oemed-2014-102264. [DOI] [PubMed] [Google Scholar]
- Li S, Dai J, Zhang L, Zhang J, Zhang Z, Chen B, 2011. An association of elevated serum prolactin with phthalate exposure in adult men. Biomed. Environ. Sci 24, 31–39. 10.3967/0895-3988.2011.01.004. [DOI] [PubMed] [Google Scholar]
- Lin L, Wang S, Chang Y, Huang P, Cheng J, Su P, Liao P, 2011. Associations between maternal phthalate exposure and cord sex hormones in human infants. Chemosphere 83, 1192–1199. 10.1016/j.chemosphere.2010.12.079. [DOI] [PubMed] [Google Scholar]
- Liu C, Xu X, Huo X, 2014. Anogenital distance and its application in environmental health research. Environ. Sci. Pollut. Res. Int 21, 5457–5464. 10.1007/s11356-014-2570-z. [DOI] [PubMed] [Google Scholar]
- Liu L, Bao H, Liu F, Zhang J, Shen H, 2012. Phthalates exposure of Chinese reproductive age couples and its effect on male semen quality, a primary study. Environ. Int 42, 78–83. 10.1016/j.envint.2011.04.005. [DOI] [PubMed] [Google Scholar]
- Main KM, Mortensen GK, Kaleva MM, Boisen KA, Damgaard IN, Chellakooty M, Schmidt IM, Suomi AM, Virtanen HE, Petersen JH, Andersson AM, Toppari J, Skakkebaek NE, 2006. Human breast milk contamination with phthalates and alterations of endogenous reproductive hormones in infants three months of age. Environ. Health Perspect 114, 270–276. 10.1289/ehp.8075. [DOI] [PMC free article] [PubMed] [Google Scholar]
- Meeker JD, Calafat AM, Hauser R, 2009. Urinary metabolites of di(2-ethylhexyl) phthalate are associated with decreased steroid hormone levels in adult men. J. Androl 30, 287–297. 10.2164/jandrol.108.006403. [DOI] [PMC free article] [PubMed] [Google Scholar]
- Meeker JD, Ferguson KK, 2014. Urinary phthalate metabolites are associated with decreased serum testosterone in men, women, and children from NHANES 2011–2012. J. Clin. Endocrinol. Metab 99, 4346–4352. 10.1210/jc.2014-2555. [DOI] [PMC free article] [PubMed] [Google Scholar]
- Mendiola J, Jørgensen N, Andersson AM, Calafat AM, Silva MJ, Redmon JB, Sparks A, Drobnis EZ, Wang C, Liu F, Swan SH, 2011. Associations between urinary metabolites of di(2-ethylhexyl) phthalate and reproductive hormones in fertile men. Int. J. Androl 34, 369378. 10.1111/j.1365-2605.2010.01095.x. [DOI] [PMC free article] [PubMed] [Google Scholar]
- Modigh CM, Bodin SL, Lillienberg L, Hlman-Hoglund A, Akesson B, Axelsson G, 2002. Time to pregnancy among partners of men exposed to di(2-ethylhexyl)phthalate. Scand. J. Work Environ. Health 28, 418–428. [DOI] [PubMed] [Google Scholar]
- National Academies of Sciences, Engineering, and Medicine, 2017. Application of Systematic Review Methods in an Overall Strategy for Evaluating Low-Dose Toxicity from Endocrine Active Chemicals The National Academices Press, Washington, DC. 10.17226/24758. [DOI] [PubMed] [Google Scholar]
- National Research Council, 2008. Phthalates and Cumulative Risk Assessment: The Tasks Ahead The National Academies Press, Washington, DC. 10.17226/12528. [DOI] [PubMed] [Google Scholar]
- Pan G, Hanaoka T, Yoshimura M, Zhang S, Wang P, Tsukino H, Inoue K, Nakazawa H, Tsugane S, Takahashi K, 2006. Decreased serum free testosterone in workers exposed to high levels of di-n-butyl phthalate (DBP) and di-2-ethylhexyl phthalate (DEHP): a cross-sectional study in China. Environ. Health Perspect 114, 1643–1648. 10.1289/ehp.9016. [DOI] [PMC free article] [PubMed] [Google Scholar]
- Pan G, Hanaoka T, Yu L, Na J, Yamano Y, Hara K, Ichiba M, Nakadate T, Kishi R, Wang P, Yin H, Zhang S, Feng Y, 2011. Associations between hazard indices of di-n-butylphthalate and di-2-ethylhexylphthalate exposure and serum reproductive hormone levels among occupationally exposed and unexposed Chinese men. Int. J. Androl 34, e397–e406. 10.1111/j.1365-2605.2011.01201.x. [DOI] [PubMed] [Google Scholar]
- Pan Y, Jing J, Dong F, Yao Q, Zhang W, Zhang H, Yao B, Dai J, 2015. Association between phthalate metabolites and biomarkers of reproductive function in 1066 Chinese men of reproductive age. J. Hazard. Mater 300, 729–736. 10.1016/j.jhazmat.2015.08.011. [DOI] [PubMed] [Google Scholar]
- Pan Y, Jing J, Yeung LW, Sheng N, Zhang H, Yao B, Dai J, 2016. Associations of urinary 5-methyl-2′-deoxycytidine and 5-hydroxymethyl-2′-deoxycytidine with phthalate exposure and semen quality in 562 Chinese adult men. Environ. Int 94, 583–590. 10.1016/j.envint.2016.06.020. [DOI] [PubMed] [Google Scholar]
- Thonneau Marchand, S., Tallec A, Ferial ML, Ducot B, Lansac J, et al. , 1991. Incidence and main causes of infertility in a resident population (1,850,000) of three French regions (1988–1989). Hum. Reprod 6, 811–816. [DOI] [PubMed] [Google Scholar]
- Pant N, Kumar G, Upadhyay AD, Patel DK, Gupta YK, Chaturvedi PK, 2014. Reproductive toxicity of lead, cadmium, and phthalate exposure in men. Environ. Sci. Pollut. Res. Int 21, 11066–11074. 10.1007/s11356-014-2986-5. [DOI] [PubMed] [Google Scholar]
- Pant N, Shukla M, Kumar Patel D, Shukla Y, Mathur N, Kumar Gupta Y, Saxena DK, 2008. Correlation of phthalate exposures with semen quality. Toxicol. Appl. Pharmacol 231, 112–116. 10.1016/j.taap.2008.04.001. [DOI] [PubMed] [Google Scholar]
- Park MS, Yang YJ, Hong YP, Kim SY, Lee YP, 2010. Assessment of di (2-ethyl-hexyl) phthalate exposure by urinary metabolites as a function of sampling time. J. Prev. Med. Public Health 43, 301–308. 10.3961/jpmph.2010.43.4.301. [DOI] [PubMed] [Google Scholar]
- Specht IO, Bonde JP, Toft G, Lindh CH, Jönsson BA, Jørgensen KT, 2015. Serum phthalate levels and time to pregnancy in couples from Greenland, Poland and Ukraine. PLoS One 10, e0120070. 10.1371/journal.pone.0120070. [DOI] [PMC free article] [PubMed] [Google Scholar]
- Specht IO, Toft G, Hougaard KS, Lindh CH, Lenters V, Jönsson BA, Heederik D, Giwercman A, Bonde JP, 2014. Associations between serum phthalates and biomarkers of reproductive function in 589 adult men. Environ. Int 66, 146–156. 10.1016/j.envint.2014.02.002. [DOI] [PubMed] [Google Scholar]
- Suzuki Y, Yoshinaga J, Mizumoto Y, Serizawa S, Shiraishi H, 2012. Foetal exposure to phthalate esters and anogenital distance in male newborns. Int. J. Androl 35, 236–244. 10.1111/j.1365-2605.2011.01190.x. [DOI] [PubMed] [Google Scholar]
- Swan SH, 2008. Environmental phthalate exposure in relation to reproductive outcomes and other health endpoints in humans [Review]. Environ. Res 108, 177–184. 10.1016/j.envres.2008.08.007. [DOI] [PMC free article] [PubMed] [Google Scholar]
- Swan SH, Sathyanarayana S, Barrett ES, Janssen S, Liu F, Nguyen RH, Redmon JB, TIDES Study Team, 2015. First trimester phthalate exposure and anogenital distance in newborns. Hum. Reprod 30, 963–972. 10.1093/humrep/deu363. [DOI] [PMC free article] [PubMed] [Google Scholar]
- Thurston SW, Mendiola J, Bellamy AR, Levine H, Wang C, Sparks A, Redmon JB, Drobnis EZ, Swan SH, 2016. Phthalate exposure and semen quality in fertile US men. Andrology 4, 632–638. 10.1111/andr.12124. [DOI] [PMC free article] [PubMed] [Google Scholar]
- Toshima H, Suzuki Y, Imai K, Yoshinaga J, Shiraishi H, Mizumoto Y, Hatakeyama S, Onohara C, Tokuoka S, 2012. Endocrine disrupting chemicals in urine of Japanese male partners of subfertile couples: a pilot study on exposure and semen quality. Int. J. Hyg. Environ. Health 215, 502–506. 10.1016/j.ijheh.2011.09.005. [DOI] [PubMed] [Google Scholar]
- U.S. EPA (U.S. Environmental Protection Agency), 1996. Guidelines for Reproductive Toxicity Risk Assessment U.S. Environmental Protection Agency, Risk Assessment Forum, Washington, DC, pp. 1–143 (EPA/630/R-96/009). [Google Scholar]
- Wang C, Yang L, Wang S, Zhang Z, Yu Y, Wang M, Cromie M, Gao W, Wang SL, 2016a. The classic EDCs, phthalate esters and organochlorines, in relation to abnormal sperm quality: a systematic review with meta-analysis [Review]. Sci. Rep 6, 19982. 10.1038/srep19982. [DOI] [PMC free article] [PubMed] [Google Scholar]
- Wang SY, Wang Y, Xie FQ, Li YX, Wan XL, Ma WW, Wang DC, Wu YH, 2015a. Analysis of PAEs in semen of infertile men. Int. J. Occup. Environ. Health 21, 40–48. 10.1179/2049396714Y.0000000088. [DOI] [PMC free article] [PubMed] [Google Scholar]
- Wang YX, You L, Zeng Q, Sun Y, Huang YH, Wang C, Wang P, Cao WC, Yang P, Li YF, Lu WQ, 2015b. Phthalate exposure and human semen quality: results from an infertility clinic in China. Environ. Res 142, 1–9. 10.1016/j.envres.2015.06.010. [DOI] [PubMed] [Google Scholar]
- Wang YX, Zeng Q, Sun Y, Yang P, Wang P, Li J, Huang Z, You L, Huang YH, Wang C, Li YF, Lu WQ, 2016b. Semen phthalate metabolites, semen quality parameters and serum reproductive hormones: a cross-sectional study in China. Environ. Pollut 211, 173–182. 10.1016/j.envpol.2015.12.052. [DOI] [PubMed] [Google Scholar]
- Wang YX, Zeng Q, Sun Y, You L, Wang P, Li M, Yang P, Li J, Huang Z, Wang C, Li S, Dan Y, Li YF, Lu WQ, 2015c. Phthalate exposure in association with serum hormone levels, sperm DNA damage and spermatozoa apoptosis: a cross-sectional study in China. Environ. Res 150, 557–565. 10.1016/j.envres.2015.11.023. [DOI] [PubMed] [Google Scholar]
- Wirth J, Rossano M, Potter R, Puscheck E, Daly D, Paneth N, Krawetz S, Protas B, Diamond M, 2008. A pilot study associating urinary concentrations of phthalate metabolites and semen quality. Syst Biol Reprod Med 54, 143–154. 10.1080/19396360802055921. [DOI] [PubMed] [Google Scholar]
- Xu C, Liu Q, Liu H, Heroux P, Zhang Q, Jiang ZY, Gu A, 2015. Low serum testosterone levels are associated with elevated urinary mandelic acid, and strontium levels in adult men according to the us 2011–2012 National Health and Nutrition Examination Survey. PLoS One 10, e0127451. 10.1371/journal.pone.0127451. [DOI] [PMC free article] [PubMed] [Google Scholar]
- You L, Wang Y, Zeng Q, Li M, Huang Y, Hu Yu, Cao W, Liu A, Lu W, 2015. Semen phthalate metabolites, spermatozoa apoptosis, and DNA damage: a cross-sectional study in China. Environ. Sci. Technol 49, 3805–3812. 10.1021/acs.est.5b00588. [DOI] [PubMed] [Google Scholar]
- Zhang YH, Zheng LX, Chen BH, 2006. Phthalate exposure and human semen quality in Shanghai: a cross-sectional study. Biomed. Environ. Sci 19, 205–209. [PubMed] [Google Scholar]
Associated Data
This section collects any data citations, data availability statements, or supplementary materials included in this article.