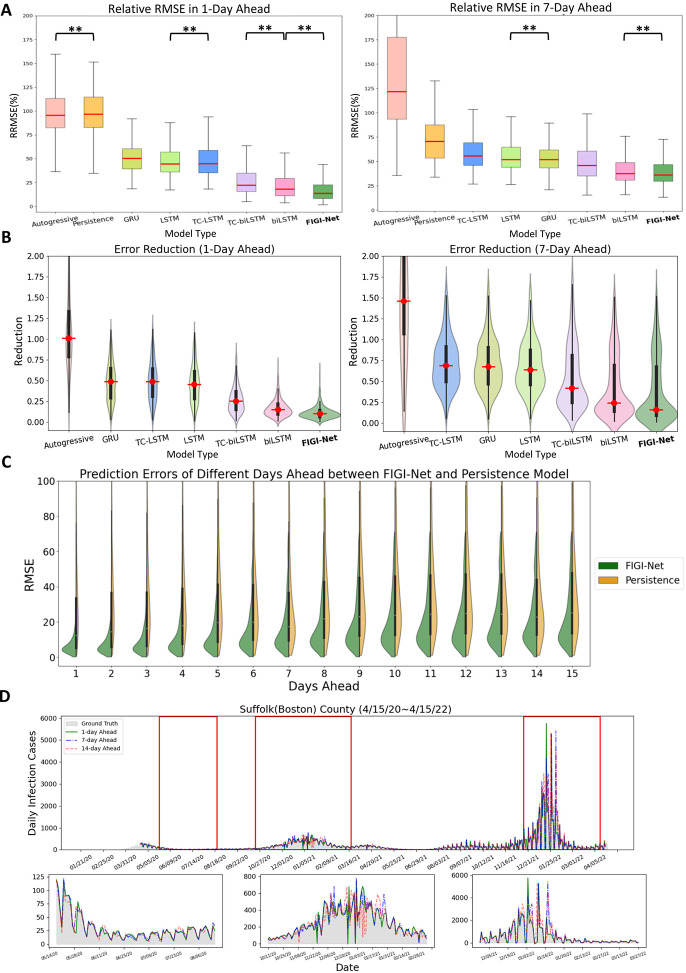
Figure 3:
A summary of the comparative performance of FIGI-Net at the county level, for the 1-day and 7-day ahead horizon tasks from Oct. 18th, 20 to Apr. 15th, 22. (A) Performance of each model over all 3143 counties presented as a box plot. The median is highlighted in red along with the 5th and 95th percentile whiskers. The models are ordered in decreasing order, with the most accurate model (lowest RRMSE) appearing on the rightmost side. Notably, FIGI-Net exhibits the lowest RRMSE compared to other models for both tasks, as confirmed by the two-sided Wilcoxon rank sum test. (B) Error Reduction between each model with Persistence model. Compared to other models, FIGI-Net provides the fewest erroneous forecasting results. (C) Performance comparison of FIGI-Net against Persistence (our baseline model).Comparison is shown as a set of violin plots across the different time horizons. Our model consistently displays a narrower distribution of prediction errors (RMSE) compared to the Persistence model. (D) shows Daily prediction results of our model in 1-day, 7-day and 14-day horizons in Suffolk county. The example demonstrates our model’s ability to provide highly accurate predictions for diverse locations and various time periods.
**: p-value ¡ 0.001

