Figure 2:

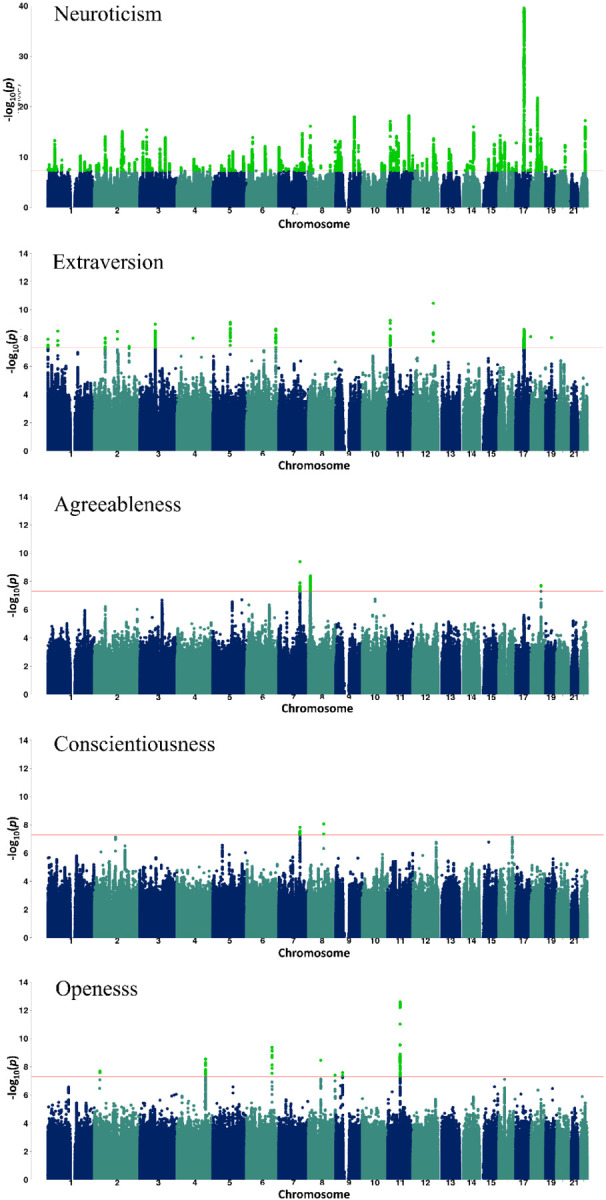
Metaanalysis data GWAS Manhattan plots of the 5 personality traits showing the genome-wide significant (GWS) variants in light green color. The red line depicts the p-value threshold used.

Metaanalysis data GWAS Manhattan plots of the 5 personality traits showing the genome-wide significant (GWS) variants in light green color. The red line depicts the p-value threshold used.