. 2024 Jan 30;13:e79714. doi: 10.7554/eLife.79714

Figure 7. Simulation of population structure with and without long-range dispersal.

(A) A base model of spatial structure is established by calibrating per-generation dispersal rate to generate a maximum FST of ~0.03 across the maximal spatial distance, and visualized using PCA. In addition to this base dispersal, either 4% (B) or 8% (C) of individuals disperse longer distances, and the effect is tracked by analyzing spatial FST through time, as well as PCA after 120 generations of long-range dispersal.

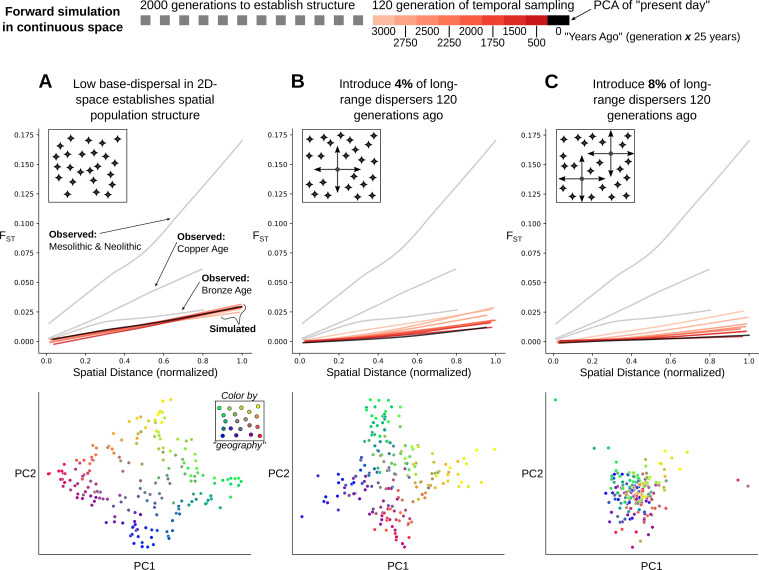
Figure 7.

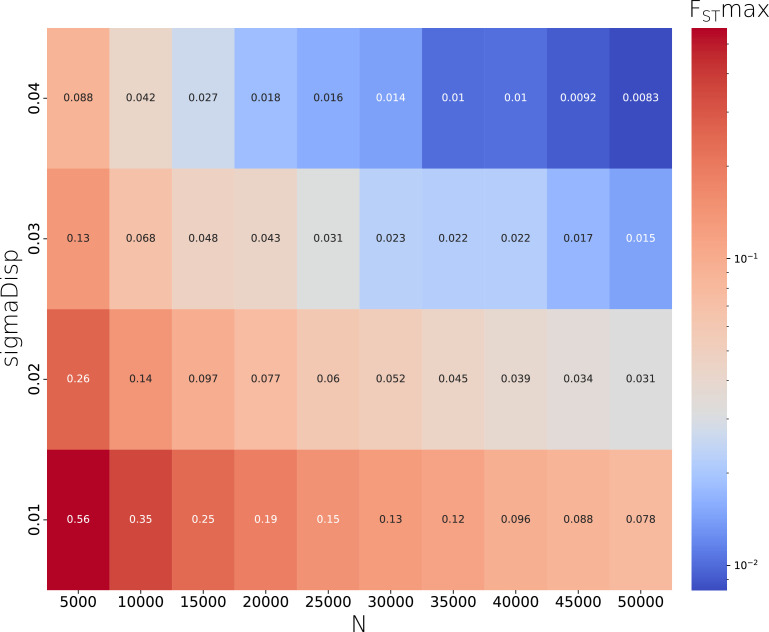
Figure 7—figure supplement 1. A sigmaDisp - N parameter pair was chosen to closely approximate the observed FSTmax of ~0.03 using grid search across a range of parameter pairs.

Figure 7—figure supplement 1.

We used the pair N=50,000 & sigmaDisp = 0.02 for all other simulations we report.
Figure 7—figure supplement 2. A sigmaDispLR parameter was chosen to qualitatively resemble long-range dispersal distances observed in the data, by comparing the distribution of distances under long-range dispersal (outliers) to randomly chosen distances given the spatial distribution of samples.

Figure 7—figure supplement 2.

We used a value of 0.20 for all other simulations we report.