

Abstract
Alzheimer’s disease has recently been classified using three biological markers (amyloid [A], tau [T], and neurodegeneration [N]) to help elucidate its progression. We aimed to investigate whether there were differences between cognitive function and the clinical dementia symptoms over time relative to the ATN classification in the amyloid-negative group. In the Alzheimer’s Disease Neuroimaging Initiative (ADNI) cohort, 310 participants who underwent all the tests required for ATN classification were enrolled. The cognitive function score differences (Alzheimer’s Disease Assessment Scale-Cognitive Subscale 13 [ADAS-Cog 13], Clinical Dementia Rating Sum of Boxes [CDR-SOB], and Mini-Mental State Examination [MMSE]) between the groups were analyzed using the analysis of covariance and score changes over time with a linear mixed-effects model. In the cross-sectional analysis, ADAS-Cog 13 scores were higher for A-T-N+ and A-T+N+ than for A-T-N- (p<0.001) and A-T+N- (p<0.001). In the longitudinal analysis, CDR-SOB scores for A-T+N+ deteriorated faster than A-T-N- (p<0.001), A-T+N- (p<0.001) and A-T-N+ (p<0.001). Hippocampal atrophy progressed faster in A-T-N+ (p<0.001) and A-T+N+ (p=0.02) than in A-T-N-. Through this study, we discovered that even in individuals classified as amyloid negative, neurodegeneration with tau deposition exacerbates cognitive decline and worsens clinical symptoms, underscoring the need for continuous monitoring and observation.
Keywords: ATN Classification, Amyloid PET Negative, SNAP, PART
INTRODUCTION
Dementia is a syndrome in which cognitive decline in memory, language, visuospatial, and frontal executive function causes problems in daily life.1 As neuroimaging and neurochemical biomarkers that reveal the pathology of Alzheimer’s disease (AD) have evolved, AD is no longer considered a clinical syndrome based solely on specific symptoms. Instead, it is a biological disease defined by distinct pathological mechanisms.2 In 2018, the National Institute on Aging and Alzheimer’s Association (NIA-AA) research framework was established, categorizing Alzheimer’s biological markers into eight combinations based on three key indicators: beta-amyloid (CSF Aβ or amyloid Positron Emission Tomography (PET): “A”), tau (CSF p-tau or tau PET: “T”), and neurodegeneration (brain atrophy seen in magnetic resonance imaging (MRI) or metabolic dysfunction in Fluorodeoxyglucose (FDG) PET: “N”).3
Concerning amyloid-negative groups, current research primarily categorizes two main concepts: Suspected Non-Alzheimer’s Pathophysiology (SNAP)4 and Primary Age-Related Tauopathy (PART).5 SNAP refers to abnormal neurodegeneration without amyloid pathology; tau accumulation may be present but is not necessary. On the other hand, PART represents the condition where abnormal tau deposition is neuropathologically diagnosed without amyloid pathology. Previous research has indicated that individuals with PART, who exhibit tau pathology without amyloid, tend to experience slower cognitive decline than AD patients with amyloids.6
The present study investigated differences in cognitive function and the clinical progression based on ATN classification in the amyloid-negative group. We hypothesized that even with an amyloid-negative status, tau deposition or neurodegeneration reflect clinical deterioration cross-sectionally and longitudinally.
MATERIALS AND METHODS
1. Participants
The Alzheimer’s Disease Neuroimaging Initiative (ADNI) represents a comprehensive, multi-institutional endeavor to develop clinical, imaging, genetic, and biochemical biomarkers for the early detection and longitudinal observation of AD.7 This cohort study aimed to diagnose AD in its earliest stages and track disease progression through the continuous assessment of MRI, amyloid PET using florbetapir (FBP) or florbetaben (FBB), tau PET with flortaucipir, and other biological markers and neuropsychological evaluations. ADNI participants were recruited from over 50 regions throughout the United States and Canada, comprising adults aged 55 to 90 with normal cognition, early or late mild cognitive impairment (MCI), or early AD dementia. Early MCI participants were recruited based on a Wechsler Memory Scale-Revised (WMS-R) Logical Memory II Story A score, approximately 1.0 standard deviation (S.D) below the expected education-adjusted norms for memory function. Late MCI participants were included if their memory function was approximately 1.5 S.D below the expected education-adjusted norms.8,9 Recruitment for AD dementia was based on criteria from the National Institute of Neurological and Communicative Disorders and Stroke (NINCDS) and the Alzheimer’s Disease and Related Disorders Association (ADRDA).2 These individuals received various imaging, clinical evaluations, and regular re-evaluations to monitor disease pathology. For this study, we acquired the most recent dataset from the ADNI database (ida.loni.usc.edu) as of April 5, 2022. Specifically, we focused on individuals who had undergone all required imaging assessments for ATN classification (n=310). All demographic information, including age, sex, education, and the presence of Apolipoprotein E ε4 (Apo E ε4), was obtained through the ADNI website (https://ida.loni.usc.edu/login.jsp). The Institutional Review Boards of each participating institution approved the ADNI. Informed written consent was obtained from all participants at each ADNI site.10
2. Cognitive scales
Following participant recruitment and initial evaluation in the ADNI cohort, cognitive scores and clinical dementia scales were monitored at predetermined intervals. Detailed information regarding these assessment intervals is provided on the ADNI website (https://adni.loni.usc.edu/study-design/).
1) Alzheimer’s disease assessment scale - cognitive subscale 13 (ADAS-Cog 13)
The ADAS-Cog-13 test evaluates cognitive and non-cognitive symptom severity in AD patients.11 ADAS-Cog-13 includes additional evaluations such as a delayed word recall test and tasks involving number cancellation or maze completion to assess early AD characteristics. Higher scores indicate cognitive impairment.
2)Mini-mental state examination (MMSE)
The MMSE assesses various cognitive functions, including temporal orientation, spatial orientation, registration, memory recall, attention and calculation abilities, language, and visuospatial construction. Tests are scored from 0 to 30. MMSE is widely used as a dementia screening tool to assess the extent of cognitive impairment. Lower MMSE scores indicate a more substantial cognitive impairment.12
3) Clinical dementia rating sum of boxes (CDR-SOB)
CDR-SOB evaluates dementia progression across six domains: memory, orientation, judgment and problem-solving, community affairs, home and hobbies, and personal care and dressing. This test categorizes dementia stages into five levels based on these evaluations. CDR-SOB enables the assessment of dementia progression extent, assists in formulating treatment plans, and evaluates changes from treatment. Higher CDR-SOB scores indicate advanced dementia symptoms.13
3. Imaging
1) Brain MRI data acquisition
T1-weighted images were acquired with a spatial resolution of 0.94×0.94 mm and 1.2 mm slice thickness using a 3D magnetization-prepared rapid acquisition gradient echo (MPRAGE) protocol. As provided by the ADNI website, hippocampal volumes were obtained through semi-automated measurements using a commercially available high-dimensional brain mapping tool (Medtronic Surgical Navigation Technologies, Louisville, Co). This method, utilized in the present study, has been previously validated by comparing its results to manual measurements.14 Hippocampal volumes measured within the six months closest to the time of tau PET imaging were chosen for analysis.
2) Amyloid PET
Amyloid PET analysis was conducted on individuals who received FBP or FBB amyloid PET scans. Standardized uptake value ratios (SUVRs) were measured using the cerebellar cortex as the reference region,15 and all scans were co-registered with simultaneously acquired MRI images using FreeSurfer v5.3. FBP PET images were obtained over 20 minutes (4×5-minute frames), approximately 50 minutes after 370 MBq (10.0 mCi) radiotracer injection. FBB PET images were acquired over 20 minutes (4×5-minute frames), 90 minutes following 300 MBq (8.1 mCi) radiotracer injection. Standard voxel sizes (1.5 mm×1.5 mm×1.5 mm) of co-acquired MPRAGE images were used with the PET images to define regional tracer retention in the cerebral cortex and reference regions.
3) Tau PET
Tau (Flortaucipir) PET images were obtained over 30 minutes (6×5-minute frames), approximately 75 minutes after 370 MBq (10.0 mCi) radiotracer injection. As established by Braak neuropathological stages, regions of interest (ROI) were defined using FreeSurfer, specifically the entorhinal cortex (Braak 1), inferolateral temporal (Braak 34), and extratemporal neocortical (Braak 56) regions.16 Braak 2 (hippocampus) was excluded due to suboptimal off-target binding in the choroid plexus.17 Similar to amyloid PET, tau PET quantification involved computing the SUVR with the cerebellum or white matter as the reference region. By referencing the inferior or posterior cerebellum, this process avoided potential off-target binding in veins or the choroid plexus.
4) FDG PET
Per the ADNI protocol (http://adni.loni.usc.edu), all subjects were administered 197±47 MBq of FDG, and 3D PET images were acquired 30 minutes later using Siemens, GE, and Philips PET scanners. We obtained FDG PET SUVR data provided by ADNI, which averaged five regions of interest (ROIs), including the left angular gyrus, right angular gyrus, bilateral posterior cingulate, left inferior parietal lobule, and right inferior parietal lobule, referencing the cerebellar vermis.18
5) ATN classification
Participants were categorized into eight groups based on amyloid, tau, and neurodegeneration (ATN) status. Amyloid positivity (A) was assessed using amyloid PET imaging. The amyloid positivity threshold was defined as FBP SUVR ≥1.11 or FBB SUVR ≥1.08, as proposed by ADNI.19
For abnormal tau (T) classification, we followed the criteria set by PART, focusing on the entorhinal and inferolateral temporal regions (Braak 1, Braak 3-4). Specifically, the tau SUVR threshold values of 1.21 for Braak 1 (entorhinal region) and 1.23 for Braak 3-4 (inferolateral temporal region) were established as the optimal cut-off points to differentiate between amyloid-negative and amyloid-positive groups.20 Therefore, abnormal tau (T+) was defined when these threshold values were surpassed in Braak 1 or Braak 3-4 regions, signifying abnormal tau accumulation in the entorhinal or inferolateral temporal areas.
Neurodegeneration (N) was assessed by measuring the SUVR value of the FDG PET meta ROI and the adjusted mean hippocampal volume. FDG PET meta ROI SUVR ≤1.19 was defined as positive for neurodegeneration (N+).21,22 We utilized the previously established 3.68 mL threshold for hippocampal volume, effectively distinguishing amyloid-positive and amyloid-negative categories within the ADNI Go/2 cohort. Thus, hippocampal atrophy was considered a neurodegeneration indicator when the hippocampal volume was less than 3.68 mL.21
4. Statistical analyses
We performed an analysis of variance (ANOVA) for continuous variables and the chi-square test for categorical variables to compare demographic and clinical characteristics within the ATN group. Next, we conducted an analysis of covariance (ANCOVA) after controlling for age, sex, and education to compare cognitive performance (MMSE, ADAS-Cog13, and CDR-SOB) among the four ATN groups (A-T-N-, A-T+N-, A-T-N+ and A-T+N+). To compare hippocampal volumes, we performed ANCOVA after controlling for age, sex, education, and intracranial volume (ICV), and Bonferroni correction was accomplished with the post hoc test. In order to compare longitudinal cognitive decline among the ATN groups, linear mixed models were assessed after including age, sex, education, ATN group, time, ICV (added in hippocampal volume analyses), and the ATN group by time interaction as fixed effects with participant-specific random effects.
Statistical tests were conducted using chi-squared tests, ANOVA, ANCOVA, and Kaplan-Meier analysis with SPSS version 28.0 (SPSS Inc., Chicago, IL, USA). Linear mixed-effects models were implemented using STATA (Stata Corp. 2020. Stata Statistical Software: Release 16.1). A significance level of p<0.05 was used to determine statistical significance.
RESULTS
1. Demographic characteristics
We collected data from 310 individuals in the ADNI cohort who underwent amyloid PET, tau PET, Brain MRI, or FDG PET scans and completed all the necessary imaging examinations for ATN classification. Per ATN classification criteria, the frequency distribution was as follows: A-T-N- in 127 (41.0%), A-T+N- in 18 (5.8%), A-T-N+ in 132 (42.6%), and A-T+N+ in 33 (10.6) participants. The average age (mean±S.D) was 72.7±7.7 years old, and the mean years of education was 16.5±2.5 years for total participants. Approximately 20.6% of participants possessed at least one APOE ε4 allele. The A-T-N+ group exhibited a significantly higher age (74.0±7.8) compared to the A-T-N- group (71.2±7.3), while no significant age differences were detected among other groups. Furthermore, no significant variations were identified between the ATN groups in terms of sex, education, APOE ε4 carrier status, or diagnostic distribution (Table 1).
TABLE 1. Demographic and clinical characteristics relative to ATN group.

Data are expressed as mean (S.D) or n (%) unless otherwise indicated. Statistical analyses were performed with Chi-square tests for gender, APOE e4 carrier (status was defined as having at least one APOE e4 allele), and diagnosis. Analysis of variance (ANOVA) was used for age and education. Analysis of covariance (ANCOVA) with age, sex, and education covariates was used for ADAS-Cog 13, MMSE, and CDR-SOB and with the additional ICV covariate (added in hippocampal volume). *p<0.05 between A-T-N- and A-T-N+. ap<0.05 between A-T-N- and A-T-N+, A-T-N- and A-T+N+. bp<0.05 between A-T+N- and A-T-N+, A-T+N- and A-T+N+. S.D: standard deviation, APOE ε4: apolipoprotein E ε4 allele, CN: cognitively normal, MCI: mild cognitive impairment, ADAS-Cog 13: Alzheimer’s disease assessment scale-cognitive subscale 13, MMSE: mini-mental state examination, CDR-SOB: clinical dementia rating sum of boxes.
2. Cross-sectional analysis relative to tau and neurodegeneration status
We investigated differences in cognitive function (ADAS-Cog 13 and MMSE), clinical dementia symptoms (CDR-SOB), and hippocampal volume relative to ATN status in amyloid-negative participants. Differences were observed among the four groups across all cognitive function scores (ADAS-Cog 13, p<0.001; MMSE, p=0.02; CDR-SOB, p=0.01; hippocampal volume, p<0.001; Table 1 and Fig. 1).
FIG. 1. Comparison of cognitive scale and hippocampal volume within the ATN group. (A) ADAS-Cog 13 was highest in A-T+N+, followed by A-T-N+, A-T-N-, and A-T+N-. (B) MMSE score was lowest in A-T+N+, but there was no statistical difference between each group. (C) CDR-SOB was highest in A-T+N+, but there was no statistical difference between each group. (D) Hippocampal volume was lowest in A-T+N+, followed by A-T-N+, A-T-N-, and A-T+N-. p-values for differences between ATN groups are from the analysis of covariance with age, gender, education, and ICV (added in hippocampal volume) covariates. ap<0.05 between A-T-N- and A-T-N+, A-T-N- and A-T+N+. bp<0.05 between A-T+N- and A-T-N+, A-T+N- and A-T+N+. ADAS-Cog 13: Alzheimer’s disease assessment scale-cognitive subscale 13, MMSE: mini-mental state examination, CDR-SOB: clinical dementia rating sum of boxes.

Post hoc tests using Bonferroni correction revealed that the ADAS-Cog 13 score for A-T-N- (mean±S.D, 10.8±7.8) was significantly lower than A-T-N+ (16.1±10.1, p<0.001) and A-T+N+ (18.7±12.4, p<0.001). In addition, the A-T+N- ADAS-Cog 13 score (8.2±4.0) was also significantly lower than A-T-N+ (p=0.023) and A-T+N+ (p=0.005) but there was no significant difference between the A-T-N- and A-T+N- (p=1.00) groups (Fig. 1A). Concerning MMSE scores, A-T+N+ (26.6±3.9) exhibited lower scores than the A-T-N- (28.2±3.0), A-T+N- (28.9±1.1), and A-T-N+ (27.3±2.9) groups. However, no statistically significant differences were detected among the groups (Fig. 1B). Regarding CDR-SOB scores, A-T-N+ (1.66±2.29) and A-T+N+ (2.14±2.64) groups had relatively higher scores compared to the A-T-N- (0.93±2.35) and A-T+N- (0.31±0.60) groups; however, no statistically significant differences were observed (Fig. 1C). For hippocampal volume, the Neurodegeneration (N+) [A-T-N+ (3236.9±426.0 mm3, p<0.001) and A-T+N+ (3280.9±521.9, p<0.001)] groups each showed significantly smaller hippocampal volumes than the N- [A-T-N- (4049.4±303.1) and A-T+N- (4028.4±224.2)] groups (Fig. 1D).
3. Longitudinal changes relative to tau and neurodegeneration status
The A-T+N+ and A-T-N+ groups exhibited higher ADAS-Cog 13 and lower MMSE scores than A-T-N- and A-T+N-; however, no significant time-dependent interactions were observed (Table 2, Figs. 2A and 2B). Concerning CDR-SOB (Table 2 and Fig. 2C), A-T+N+ displayed significant time-dependent interactions, indicating the steepest aggravation, followed by A-T-N+ (β [S.E]=0.10 [0.03], p=0.00), A-T-N- (β [S.E]=0.13 [0.03], p=0.00), and A-T+N- (β [S.E]=0.16 [0.05], p=0.00). For hippocampal volume (Table 2 and Fig. 2D), significant time-dependent interactions were observed. A-T+N+ (β [S.E]=−21.84 [8.96], p=0.02) and A-T-N+ (β [S.E]=−30.20 [6.75], p=0.00) presented faster hippocampal atrophy progression than A-T-N-.
TABLE 2. Longitudinal changes among ATN groups in the amyloid-negative group.

Values are adjusted means with 95% CI (adjusted for age, sex, education, and ICV (hippocampal volume only). All p-values were calculated by linear mixed model using a random intercept model. ADAS-Cog 13: Alzheimer’s disease assessment scale-cognitive subscale 13, MMSE: mini-mental state examination, CDR-SOB: clinical dementia rating sum of boxes, β (S.E): beta coefficient with standard error.
FIG. 2. Longitudinal cognitive decline and hippocampal volume within the ATN group. (A) Incline in ADAS-Cog 13 score and (B) decline in MMSE was steepest in A-T+N+, followed by A-T-N+, A-T-N-, and A-T+N-, but there was no statistical difference between each group. (C) Incline in CDR-SOB was steepest in A-T+N+, followed by A-T-N+, A-T-N-, and A-T+N- with statistical significance. (D) Hippocampal volume was lower in A-T+N+ and A-T-N+ than A-T-N- with statistical significance. This graph estimates the performance of linear mixed models including age, sex, education, ATN group, time, and ICV (added in hippocampal volume analyses) by time interaction as fixed effects and participant-specific random effects. This graph plots the mean of the predicted values for each follow-up year derived from the predicted model equation. Follow-up time ‘0’ refers to the point at which the ATN group is determined. Error bars are 95% confidence intervals. *p<0.05 in the linear mixed model analysis. ADAS-Cog 13: Alzheimer’s disease assessment scale-cognitive subscale 13, MMSE: mini-mental state examination, CDR-SOB: clinical dementia rating sum of boxes.

4. Conversion ratio to dementia in the ATN group
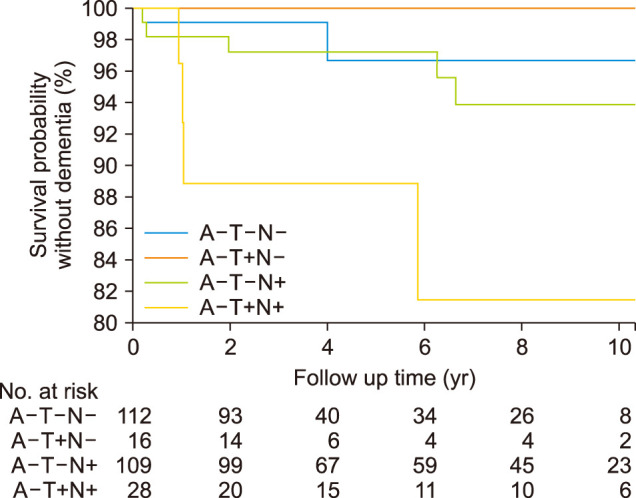
We conducted a Kaplan-Meier analysis to investigate which ATN group progressed the most to dementia. We excluded participants diagnosed with dementia at baseline and a single follow-up. Eleven participants (A-T-N- 2/112, A-T+N- 0/16, A-T-N+ 5/109, A-T+N+ 4/28) progressed to dementia (Table 3 and Fig. 3). The dementia event rate at year 10 indicated that the A-T+N+ (18.5 [0.9-36.2], % [95% CI]) group had the highest risk of conversion to dementia throughout the observation period compared to the A-T-N+ (6.1 [0.7-11.6]) and the A-T-N- (3.4 [0.0-8.5]) groups (p=0.02).
TABLE 3. Dementia conversion event rate in the ATN group.

aBased on Kaplan-Meier estimates. p-values are from the log-rank test.
FIG. 3. The Kaplan-Meier survival curve of the time until conversion to dementia. Kaplan-Meier curves illustrate clinical progression to dementia. Separate lines represent the four ATN biomarker profiles. The numbers at risk for time points 0, 2, 4, 6, 8, and 10 years are depicted below the figure.
DISCUSSION
The present study investigated the clinical effects of tau and neurodegeneration relative to ATN classification in amyloid-negative participants using cross-sectional and longitudinal outcomes. In the cross sectional-analysis, those with neurodegeneration (A-T+N+ and A-T-N+) among amyloid-negative participants presented worse cognitive impairment (ADAS-Cog 13) than those without neurodegeneration (A-T-N- and A-T+N-). Additionally, participants with tau deposition and neurodegeneration (A-T+N+) revealed steeper clinical symptom aggravation (CDR-SOB) than those without neurodegeneration (A-T-N- and A-T+N-) and those with neurodegeneration only (A-T-N+). Overall, our findings indicate that even in the amyloid-negative group, clinicians should consider potential cognitive decline and clinical symptoms when neurodegeneration is observed. Moreover, when tau deposition and neurodegeneration are apparent, deterioration may occur more rapidly, necessitating ongoing monitoring and observation.
Our first substantial finding was that patients with neurodegeneration exhibited worse cognitive impairment than those without neurodegeneration. Participants exhibiting neurodegeneration without amyloid and with or without tau deposition were categorized as SNAP. Our study results corroborated recent research based on ATN classification, confirming that the A-T-N+ group experienced faster cognitive decline than the A-T-N- group.23 Additionally, the A-T+N- group, which is believed to be indicative of PART, exhibited clinical characteristics, cognitive function, and prognosis closely resembling those with normal biomarker profiles (A-T-N-).24 These findings are consistent with past research on PART, revealing characteristics such as a slower rate of disease progression.5,25
Our second significant finding was that tau deposition and neurodegeneration (A-T+N+) predicated worse cognitive impairment than those without neurodegeneration (A-T-N- and A-T+N-) or with neurodegeneration only (A-T-N+). Upon examining research based on the presence or absence of tau deposition without considering neurodegeneration, individuals were categorized into A-T-, A-T+, and A+T+ groups to compare tau accumulation and cognitive function.20 This study revealed that the A-T+ group exhibited intermediate tau deposition levels in Braak 1/3-4/5-6 regions compared to the A-T- and A+T+ groups. In the cognitive test, the A-T+ group achieved intermediate scores in memory and executive function compared to the A-T- or A+T+ groups. Therefore, the A-T+ group may represent a pathology associated with healthy aging or a diverse group with potential progression to AD despite the absence of amyloid, sharing many characteristics with the disease. Our study further delineated that even within the same A-T+ group, the absence of neurodegeneration does not significantly differ from A-T-N- regarding cognitive and clinical symptom changes. Neurodegeneration (A-T+N+) confirms a faster deterioration in cognitive and clinical symptom changes, differentiating our study from previous research.
The current study acknowledges some limitations. First, pathological evaluation was not conducted. We did not consider the effects of other neurodegenerative pathologies, including cerebrovascular disease, α-synuclein, transactive response DNA-binding protein (TDP) - 43, argyrophilic grain pathology, and hippocampal sclerosis. Thus, additional follow-up studies and analyses should be conducted in the future. Second, we used a common regional cutoff value. Thresholds often vary between research centers, highlighting an inherent weakness of the ATN approach.23 We used a cutoff point for categorizing into ATN groups by employing the same amyloid, tau, and neurodegeneration cutoff values as in other previous studies.19,20,21 Third, we used ADNI cohort data. ADNI is a well-organized, longitudinal cohort that serves as an excellent resource for investigating AD. Participants clinically diagnosed with frontotemporal dementia or dementia with Lewy bodies and moderate to severe white matter hyperintensity were excluded from the ADNI dataset.7 However, cohorts with high-quality longitudinal cognitive assessments and amyloid PET (A), tau PET (T), and Brain MRI or FDG PET (N) data are extremely rare, making this cohort the most suitable choice for our study. Recently, there has been a growing number of studies utilizing ADNI data for SNAP research.21,26
In conclusion, within the amyloid negative group, neurodegeneration may have a more substantial effect on cognitive decline and clinical deterioration. Moreover, deterioration could progress more rapidly when accompanied by tau deposition and neurodegeneration, underscoring the need for continuous monitoring and observation.
ACKNOWLEDGEMENTS
This study was financially supported by Chonnam National University (Grant numbers 2021-2207).
Footnotes
CONFLICT OF INTEREST STATEMENT: None declared.
References
- 1.Li X, Feng X, Sun X, Hou N, Han F, Liu Y. Global, regional, and national burden of Alzheimer’s disease and other dementias, 1990-2019. Front Aging Neurosci. 2022;14:937486. doi: 10.3389/fnagi.2022.937486. [DOI] [PMC free article] [PubMed] [Google Scholar]
- 2.McKhann GM, Knopman DS, Chertkow H, Hyman BT, Jack CR, Jr, Kawas CH, et al. The diagnosis of dementia due to Alzheimer’s disease: recommendations from the National Institute on Aging-Alzheimer’s Association workgroups on diagnostic guidelines for Alzheimer’s disease. Alzheimers Dement. 2011;7:263–269. doi: 10.1016/j.jalz.2011.03.005. [DOI] [PMC free article] [PubMed] [Google Scholar]
- 3.Jack CR, Jr, Bennett DA, Blennow K, Carrillo MC, Dunn B, Haeberlein SB, et al. NIA-AA Research Framework: toward a biological definition of Alzheimer’s disease. Alzheimers Dement. 2018;14:535–562. doi: 10.1016/j.jalz.2018.02.018. [DOI] [PMC free article] [PubMed] [Google Scholar]
- 4.Jack CR, Jr, Knopman DS, Chételat G, Dickson D, Fagan AM, Frisoni GB, et al. Suspected non-Alzheimer disease pathophysiology--concept and controversy. Nat Rev Neurol. 2016;12:117–124. doi: 10.1038/nrneurol.2015.251. [DOI] [PMC free article] [PubMed] [Google Scholar]
- 5.Crary JF, Trojanowski JQ, Schneider JA, Abisambra JF, Abner EL, Alafuzoff I, et al. Primary age-related tauopathy (PART): a common pathology associated with human aging. Acta Neuropathol. 2014;128:755–766. doi: 10.1007/s00401-014-1349-0. [DOI] [PMC free article] [PubMed] [Google Scholar]
- 6.Bell WR, An Y, Kageyama Y, English C, Rudow GL, Pletnikova O, et al. Neuropathologic, genetic, and longitudinal cognitive profiles in primary age-related tauopathy (PART) and Alzheimer’s disease. Alzheimers Dement. 2019;15:8–16. doi: 10.1016/j.jalz.2018.07.215. [DOI] [PMC free article] [PubMed] [Google Scholar]
- 7.Petersen RC, Aisen PS, Beckett LA, Donohue MC, Gamst AC, Harvey DJ, et al. Alzheimer’s Disease Neuroimaging Initiative (ADNI): clinical characterization. Neurology. 2010;74:201–209. doi: 10.1212/WNL.0b013e3181cb3e25. [DOI] [PMC free article] [PubMed] [Google Scholar]
- 8.Jessen F, Wolfsgruber S, Wiese B, Bickel H, Mösch E, Kaduszkiewicz H, et al. AD dementia risk in late MCI, in early MCI, and in subjective memory impairment. Alzheimers Dement. 2014;10:76–83. doi: 10.1016/j.jalz.2012.09.017. [DOI] [PubMed] [Google Scholar]
- 9.Aisen PS, Petersen RC, Donohue MC, Gamst A, Raman R, Thomas RG, et al. Clinical Core of the Alzheimer’s Disease Neuroimaging Initiative: progress and plans. Alzheimers Dement. 2010;6:239–246. doi: 10.1016/j.jalz.2010.03.006. [DOI] [PMC free article] [PubMed] [Google Scholar]
- 10.Mueller SG, Weiner MW, Thal LJ, Petersen RC, Jack C, Jagust W, et al. The Alzheimer’s disease neuroimaging initiative. Neuroimaging Clin N Am. 2005;15:869–877. xi–xii. doi: 10.1016/j.nic.2005.09.008. [DOI] [PMC free article] [PubMed] [Google Scholar]
- 11.Kueper JK, Speechley M, Montero-Odasso M. The Alzheimer’s Disease Assessment Scale-Cognitive Subscale (ADAS-Cog): modifications and responsiveness in pre-dementia populations. A narrative review. J Alzheimers Dis. 2018;63:423–444. doi: 10.3233/JAD-170991. [DOI] [PMC free article] [PubMed] [Google Scholar]
- 12.Larner AJ. Mini-Mental State Examination: diagnostic test accuracy study in primary care referrals. Neurodegener Dis Manag. 2018;8:301–305. doi: 10.2217/nmt-2018-0018. [DOI] [PubMed] [Google Scholar]
- 13.O’Bryant SE, Waring SC, Cullum CM, Hall J, Lacritz L, Massman PJ, et al. Staging dementia using Clinical Dementia Rating Scale Sum of Boxes scores: a Texas Alzheimer’s research consortium study. Arch Neurol. 2008;65:1091–1095. doi: 10.1001/archneur.65.8.1091. [DOI] [PMC free article] [PubMed] [Google Scholar]
- 14.Hsu YY, Schuff N, Du AT, Mark K, Zhu X, Hardin D, et al. Comparison of automated and manual MRI volumetry of hippocampus in normal aging and dementia. J Magn Reson Imaging. 2002;16:305–310. doi: 10.1002/jmri.10163. [DOI] [PMC free article] [PubMed] [Google Scholar]
- 15.Cho SH, Choe YS, Park S, Kim YJ, Kim HJ, Jang H, et al. Appropriate reference region selection of 18F-florbetaben and 18F-flutemetamol beta-amyloid PET expressed in Centiloid. Sci Rep. 2020;10:14950. doi: 10.1038/s41598-020-70978-z. [DOI] [PMC free article] [PubMed] [Google Scholar]
- 16.Braak H, Braak E. Neuropathological stageing of Alzheimer-related changes. Acta Neuropathol. 1991;82:239–259. doi: 10.1007/BF00308809. [DOI] [PubMed] [Google Scholar]
- 17.Lemoine L, Leuzy A, Chiotis K, Rodriguez-Vieitez E, Nordberg A. Tau positron emission tomography imaging in tauopathies: the added hurdle of off-target binding. Alzheimers Dement (Amst) 2018;10:232–236. doi: 10.1016/j.dadm.2018.01.007. [DOI] [PMC free article] [PubMed] [Google Scholar]
- 18.Landau SM, Mintun MA, Joshi AD, Koeppe RA, Petersen RC, Aisen PS, et al. Amyloid deposition, hypometabolism, and longitudinal cognitive decline. Ann Neurol. 2012;72:578–586. doi: 10.1002/ana.23650. [DOI] [PMC free article] [PubMed] [Google Scholar]
- 19.Landau SM, Breault C, Joshi AD, Pontecorvo M, Mathis CA, Jagust WJ, et al. Amyloid-β imaging with Pittsburgh compound B and florbetapir: comparing radiotracers and quantification methods. J Nucl Med. 2013;54:70–77. doi: 10.2967/jnumed.112.109009. [DOI] [PMC free article] [PubMed] [Google Scholar]
- 20.Yoon B, Guo T, Provost K, Korman D, Ward TJ, Landau SM, et al. Abnormal tau in amyloid PET negative individuals. Neurobiol Aging. 2022;109:125–134. doi: 10.1016/j.neurobiolaging.2021.09.019. [DOI] [PMC free article] [PubMed] [Google Scholar]
- 21.Wisse LEM, Butala N, Das SR, Davatzikos C, Dickerson BC, Vaishnavi SN, et al. Suspected non-AD pathology in mild cognitive impairment. Neurobiol Aging. 2015;36:3152–3162. doi: 10.1016/j.neurobiolaging.2015.08.029. [DOI] [PMC free article] [PubMed] [Google Scholar]
- 22.Ou YN, Xu W, Li JQ, Guo Y, Cui M, Chen KL, et al. FDG-PET as an independent biomarker for Alzheimer’s biological diagnosis: a longitudinal study. Alzheimers Res Ther. 2019;11:57. doi: 10.1186/s13195-019-0512-1. [DOI] [PMC free article] [PubMed] [Google Scholar]
- 23.Delmotte K, Schaeverbeke J, Poesen K, Vandenberghe R. Prognostic value of amyloid/tau/neurodegeneration (ATN) classification based on diagnostic cerebrospinal fluid samples for Alzheimer’s disease. Alzheimers Res Ther. 2021;13:84. doi: 10.1186/s13195-021-00817-4. [DOI] [PMC free article] [PubMed] [Google Scholar]
- 24.Altomare D, de Wilde A, Ossenkoppele R, Pelkmans W, Bouwman F, Groot C, et al. Applying the ATN scheme in a memory clinic population: the ABIDE project. Neurology. 2019;93:e1635–e1646. doi: 10.1212/WNL.0000000000008361. [DOI] [PubMed] [Google Scholar]
- 25.Hickman RA, Flowers XE, Wisniewski T. Primary age-related tauopathy (PART): addressing the spectrum of neuronal tauopathic changes in the aging brain. Curr Neurol Neurosci Rep. 2020;20:39. doi: 10.1007/s11910-020-01063-1. [DOI] [PMC free article] [PubMed] [Google Scholar]
- 26.Wisse LEM, de Flores R, Xie L, Das SR, McMillan CT, Trojanowski JQ, et al. Pathological drivers of neurodegeneration in suspected non-Alzheimer’s disease pathophysiology. Alzheimers Res Ther. 2021;13:100. doi: 10.1186/s13195-021-00835-2. [DOI] [PMC free article] [PubMed] [Google Scholar]